| Science Run Stop: | 2005:05:14:13:24 |
| Science Run Start: | 2005:05:16:12:17 |
| Interruption: | 106.0ks |
| Triggered by: | auto |
Go to:
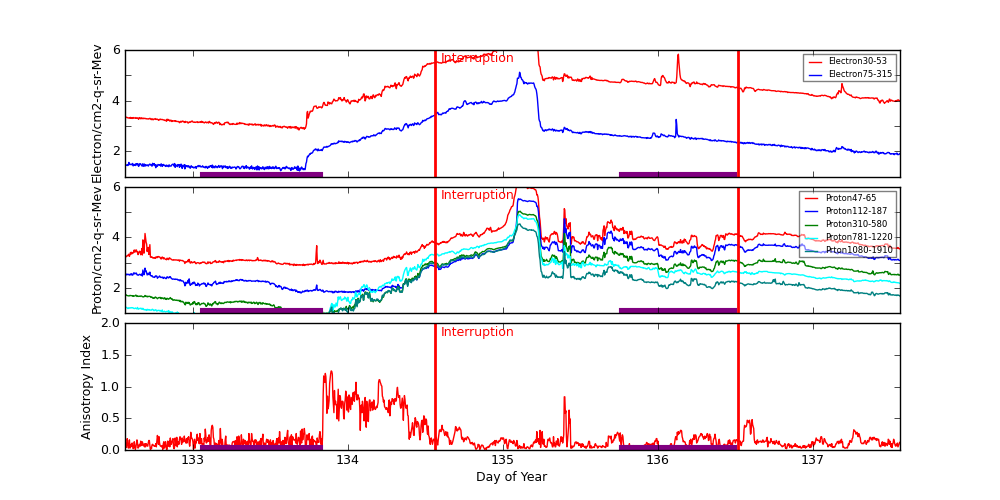
ACE Plot (E38/E175, P47/P112/P310/P761/P1060, Anisotopy)
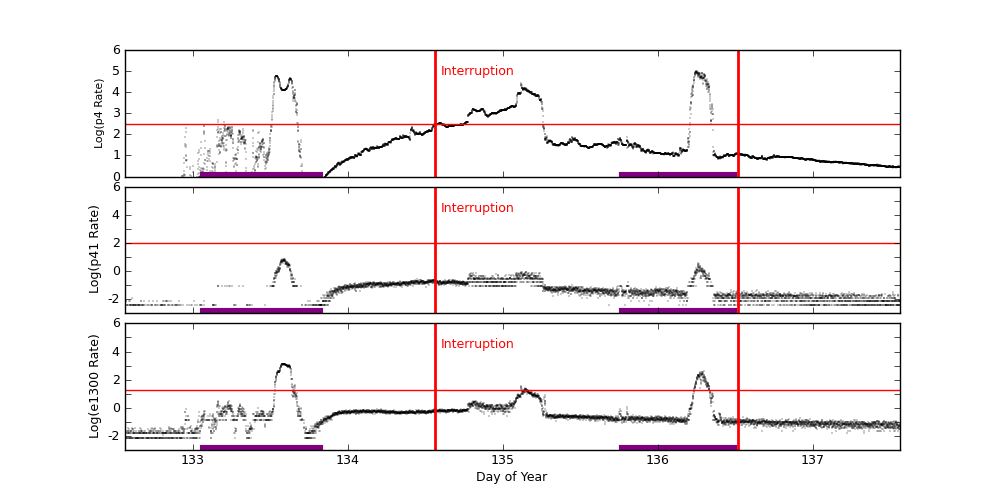
EPHIN Plot (P4/P41/E1300)
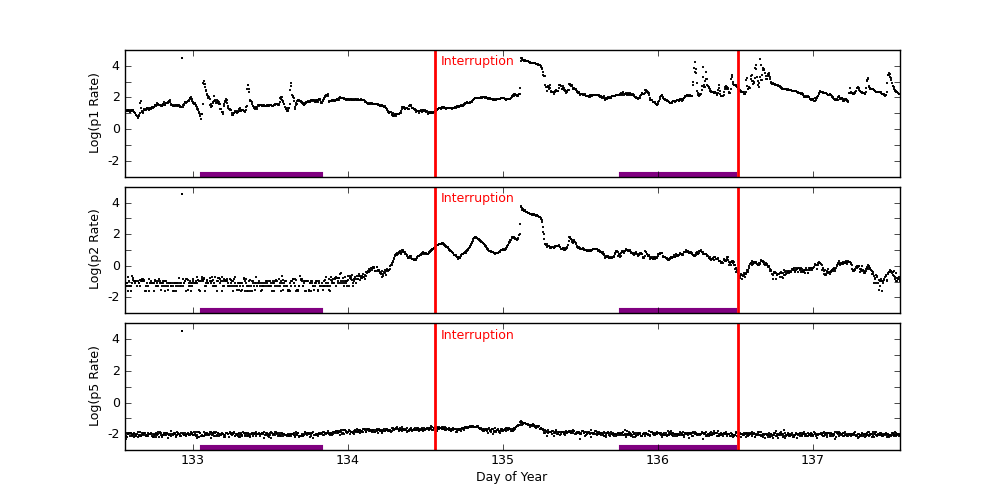
GOES-11 Plot (P1/P2/P5)
ACE radiation data are plotted around periods when science runs were interrupted. Plots start exactly 2 days before the interruption started. The top panel shows differential fluxes of electrons 38-53 and 175-315 (particles/cm2-s-ster-MeV), the middle panel shows differential fluxes of protons 47-65, 112-187, and 310-580 (particles/cm2-s-ster-MeV), and the bottom panel shows anisotropy ratio. The original data are prepared by the U.S. Dept. of Commerce, NOAA, Space Environment Center.
Data Period  (dom): 132.5583 - 137.5583
Interruption (dom): 134.5583 - 136.5118
			Avg		 Max		Time	Min		Time		Value at Interruption Started
--------------------------------------------------------------------------------------------------------------------------
e38 		2.650e+05+/-1.017e+06	1.000e+07	135.104 	6.930e+02	133.681		9.980e+03
e175		2.626e+03+/-1.002e+04	1.320e+05	135.104 	1.670e+01	133.684		7.990e+01
p47 		4.026e+04+/-1.925e+05	2.180e+06	135.090 	7.670e+02	133.646		3.510e+03
p112		9.665e+03+/-4.381e+04	3.350e+05	135.097 	6.290e+01	133.694		1.230e+03
p310		3.098e+03+/-1.322e+04	1.080e+05	135.108 	8.950e+00	133.837		3.240e+02
p761		2.397e+03+/-9.300e+03	7.820e+04	135.104 	2.830e+00	133.691		1.540e+02
p1060		1.013e+03+/-3.825e+03	3.380e+04	135.104 	7.220e-01	133.823		4.890e+01
anisotropy	2.045e-01+/-2.288e-01	1.250e+00	133.889 	1.000e-02	132.625		1.200e-01

Hardness:
e38/e175	1.024e+02+/-7.256e+01	1.690e+03	136.129 	2.895e+01	136.115		1.249e+02
p47/p1060	2.223e+02+/-3.581e+02	5.098e+03	133.795 	5.882e+00	134.924		7.178e+01
p112/p1060	3.438e+01+/-3.451e+01	1.659e+02	132.688 	7.370e-01	135.042		2.515e+01
p310/p1060	6.452e+00+/-4.356e+00	1.887e+01	133.385 	7.853e-01	133.892		6.626e+00
p761/p1060	2.968e+00+/-8.156e-01	9.480e+00	133.844 	1.097e+00	133.879		3.149e+00

Steepest Rise
------------
	Time		Slope(in log per hr)
----------------------------------------
e1  	135.0868		9696109.2519
e175	135.0868		134641.5171
p47 	135.0729		2416827.2319
p112	135.0799		394132.4409
p310	135.0799		118057.3302
p761	135.0868		73560.8289
p1060	135.0799		29604.3336
Two vertical red lines indicate the start and the end of the interruption. Purple hatched areas indicate that the satellite is in the radiation belt.
EPHIN Data are used to trigger science run interruptions. The trigger levels are:
| P4 | 300 | Counts/cm2 sec sr MeV |
| P41 | 10 | Counts/cm2 sec sr MeV |
| E1300 | 20 | Counts/cm2 sec sr MeV |
		Avg			Max		Time		Min		Time		Value at Interruption Started
--------------------------------------------------------------------------------------------------------------------------
p4	2.192e+03 +/- 9.551e+03		9.851e+04	136.244		1.483e-02	133.724		3.104e+02
p41	1.313e-01 +/- 5.146e-01		7.622e+00	133.571		1.000e-04	132.406		1.765e-01
e1300	1.847e+01 +/- 1.229e+02		1.309e+03	133.578		1.000e-04	132.411		6.901e-01
Two vertical red lines indicate the start and the end of the interruption. Red horizontal lines indicate SCS 107 limits. Purple hatched areas indicate that the satellite is in the radiation belt.
GOES-11 data are taken from NOAA site (http://goes.ngdc.noaa.gov).
| P1 | .8 - 4.0 | MeV protons (Counts/cm2 sec sr MeV) Uncorrected |
| P2 | 4.0 - 9.0 | MeV protons (Counts/cm2 sec sr MeV) Uncorrected |
| P5 | 40.0 - 80.0 | MeV protons (Counts/cm2 sec sr MeV) Uncorrected |
		Avg			Max		Time		Min		Time		Value at Interruption Started
--------------------------------------------------------------------------------------------------------------------------
p1	8.118e+02 +/- 3.336e+03		3.270e+04	132.924		4.330e+00	133.049		1.310e+01
p2	1.151e+02 +/- 1.291e+03		3.270e+04	132.924		2.580e-02	132.576		1.580e+01
p5	4.543e+01 +/- 1.218e+03		3.270e+04	132.924		4.620e-03	136.285		2.860e-02
Two vertical red lines indicate the start and the end of the interruption. Red horizontal lines indicate SCS 107 limits. Purple hatched areas indicate that the satellite is in the radiation belt.