| Science Run Stop: | 2005:09:08:01:57 |
| Science Run Start: | 2005:09:12:21:37 |
| Interruption: | 285.3ks |
| Triggered by: | auto |
Go to:
ACE Plot (E38/E175, P47/P112/P310/P761/P1060, Anisotopy)
EPHIN Plot (P4/P41/E1300)
GOES-11 Plot (P1/P2/P5)
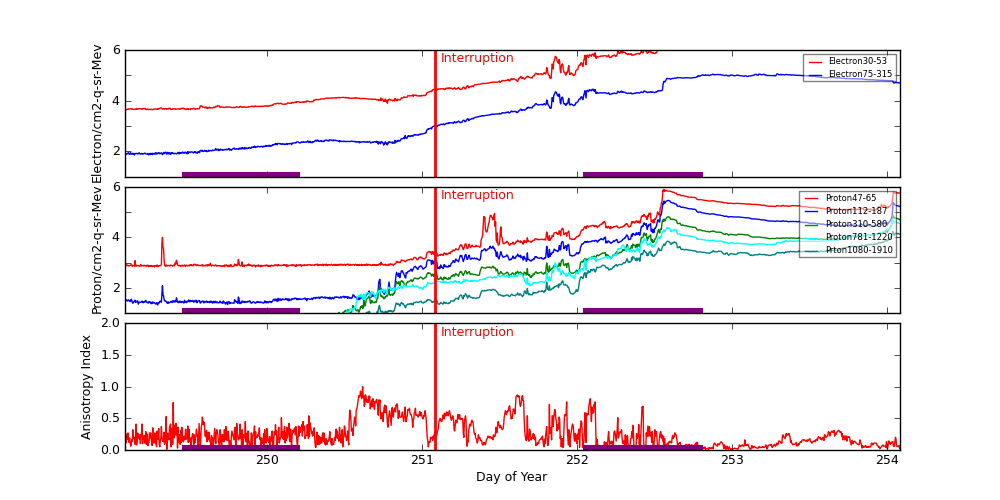
ACE radiation data are plotted around periods when science runs were interrupted. Plots start exactly 2 days before the interruption started. The top panel shows differential fluxes of electrons 38-53 and 175-315 (particles/cm2-s-ster-MeV), the middle panel shows differential fluxes of protons 47-65, 112-187, and 310-580 (particles/cm2-s-ster-MeV), and the bottom panel shows anisotropy ratio. The original data are prepared by the U.S. Dept. of Commerce, NOAA, Space Environment Center.
Data Period  (dom): 249.0813 - 259.0813
Interruption (dom): 251.0813 - 255.9007
			Avg		 Max		Time	Min		Time		Value at Interruption Started
--------------------------------------------------------------------------------------------------------------------------
e38 		5.700e+05+/-8.485e+05	3.560e+06	252.580 	4.090e+03	249.083		6.840e+04
e175		1.939e+04+/-3.075e+04	1.140e+05	253.288 	7.140e+01	249.142		1.870e+03
p47 		7.119e+04+/-1.160e+05	7.730e+05	252.559 	6.760e+02	249.924		2.150e+04
p112		2.152e+04+/-3.796e+04	2.860e+05	252.587 	2.130e+01	249.292		6.470e+03
p310		5.814e+03+/-9.600e+03	7.070e+04	254.038 	3.800e+00	249.285		1.450e+03
p761		3.834e+03+/-5.950e+03	5.260e+04	254.035 	1.700e+00	249.285		7.170e+02
p1060		1.425e+03+/-2.267e+03	1.700e+04	254.035 	5.480e-01	249.260		2.420e+02
anisotropy	1.954e-01+/-1.760e-01	1.000e+00	250.615 	1.000e-02	249.351		7.000e-02

Hardness:
e38/e175	3.439e+01+/-1.028e+01	6.416e+01	249.323 	1.513e+01	251.701		3.658e+01
p47/p1060	1.728e+02+/-3.082e+02	8.381e+03	249.323 	6.653e+00	258.062		8.884e+01
p112/p1060	2.057e+01+/-1.158e+01	1.042e+02	249.323 	2.161e+00	257.878		2.674e+01
p310/p1060	4.888e+00+/-1.894e+00	1.239e+01	251.066 	1.454e+00	257.653		5.992e+00
p761/p1060	3.093e+00+/-1.108e+00	1.188e+01	250.594 	1.625e+00	257.517		2.963e+00

Steepest Rise
------------
	Time		Slope(in log per hr)
----------------------------------------
e1  	252.9062		3045197.4556
e175	252.9062		127969.3872
p47 	252.5417		814264.4714
p112	252.5417		267076.8508
p310	254.0174		61851.8705
p761	254.0174		37679.8751
p1060	254.0174		11706.8291
Two vertical red lines indicate the start and the end of the interruption. Purple hatched areas indicate that the satellite is in the radiation belt.
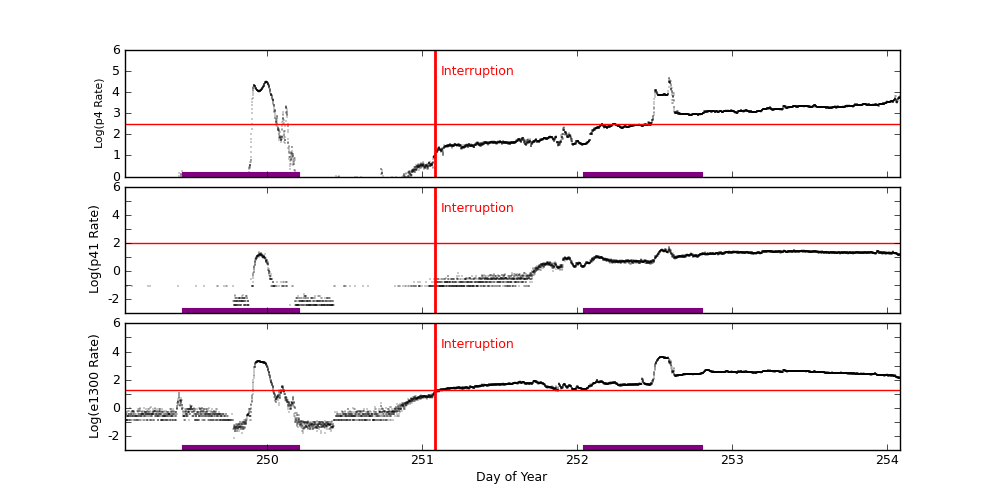
EPHIN Data are used to trigger science run interruptions. The trigger levels are:
| P4 | 300 | Counts/cm2 sec sr MeV |
| P41 | 10 | Counts/cm2 sec sr MeV |
| E1300 | 20 | Counts/cm2 sec sr MeV |
		Avg			Max		Time		Min		Time		Value at Interruption Started
--------------------------------------------------------------------------------------------------------------------------
p4	1.762e+03 +/- 5.819e+03		1.030e+05	255.301		8.469e-02	248.917		1.118e+01
p41	4.596e+00 +/- 7.789e+00		5.268e+01	252.589		1.000e-04	248.846		1.000e-04
e1300	1.466e+02 +/- 4.328e+02		4.390e+03	252.544		1.000e-04	248.915		1.258e+01
Two vertical red lines indicate the start and the end of the interruption. Red horizontal lines indicate SCS 107 limits. Purple hatched areas indicate that the satellite is in the radiation belt.
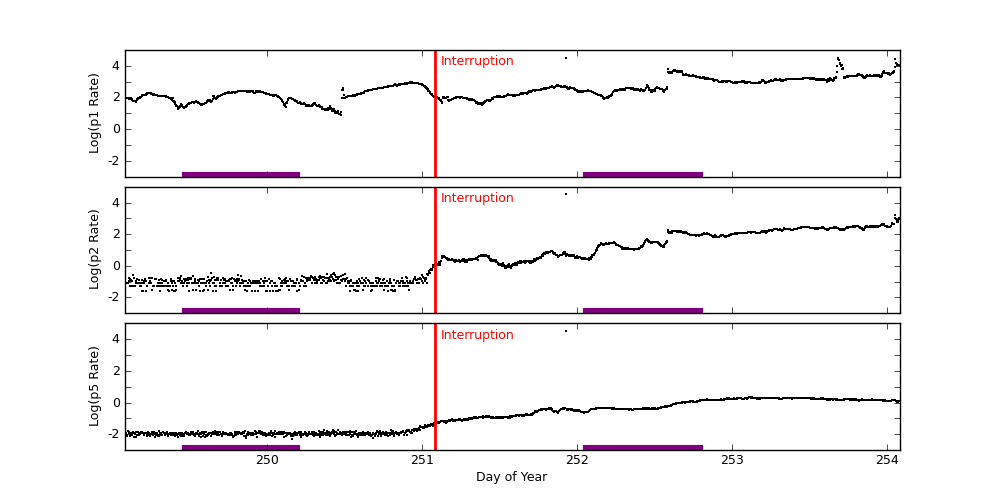
GOES-11 data are taken from NOAA site (http://goes.ngdc.noaa.gov).
| P1 | .8 - 4.0 | MeV protons (Counts/cm2 sec sr MeV) Uncorrected |
| P2 | 4.0 - 9.0 | MeV protons (Counts/cm2 sec sr MeV) Uncorrected |
| P5 | 40.0 - 80.0 | MeV protons (Counts/cm2 sec sr MeV) Uncorrected |
		Avg			Max		Time		Min		Time		Value at Interruption Started
--------------------------------------------------------------------------------------------------------------------------
p1	1.990e+03 +/- 6.624e+03		1.520e+05	255.299		8.340e+00	250.472		1.020e+02
p2	1.022e+02 +/- 8.813e+02		3.270e+04	251.924		2.580e-02	249.188		1.340e+00
p5	3.439e+01 +/- 1.055e+03		3.270e+04	251.924		4.950e-03	250.156		4.490e-02
Two vertical red lines indicate the start and the end of the interruption. Red horizontal lines indicate SCS 107 limits. Purple hatched areas indicate that the satellite is in the radiation belt.