| Science Run Stop: | 2006:12:10:08:59 |
| Science Run Start: | 2006:12:12:03:35 |
| Interruption: | 89.0ks |
| Triggered by: | auto |
Go to:
ACE Plot (E38/E175, P47/P112/P310/P761/P1060, Anisotopy)
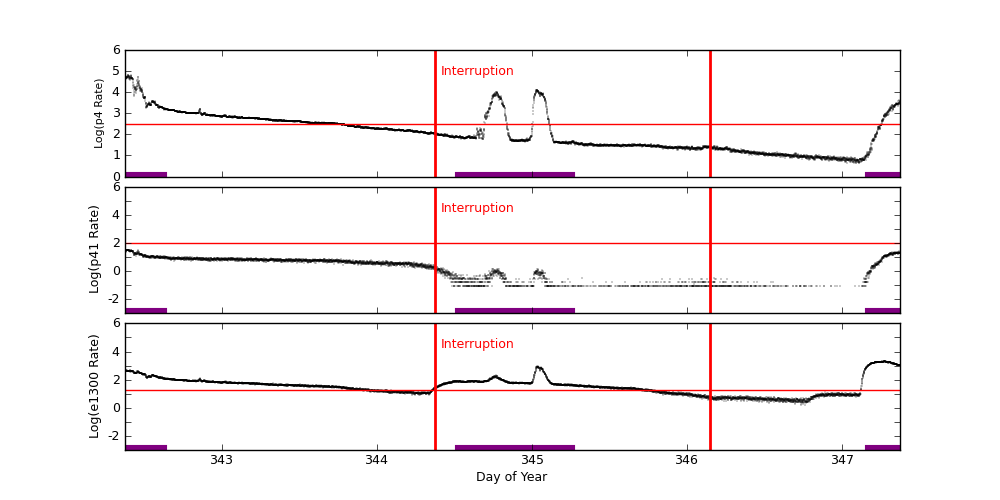
EPHIN Plot (P4/P41/E1300)
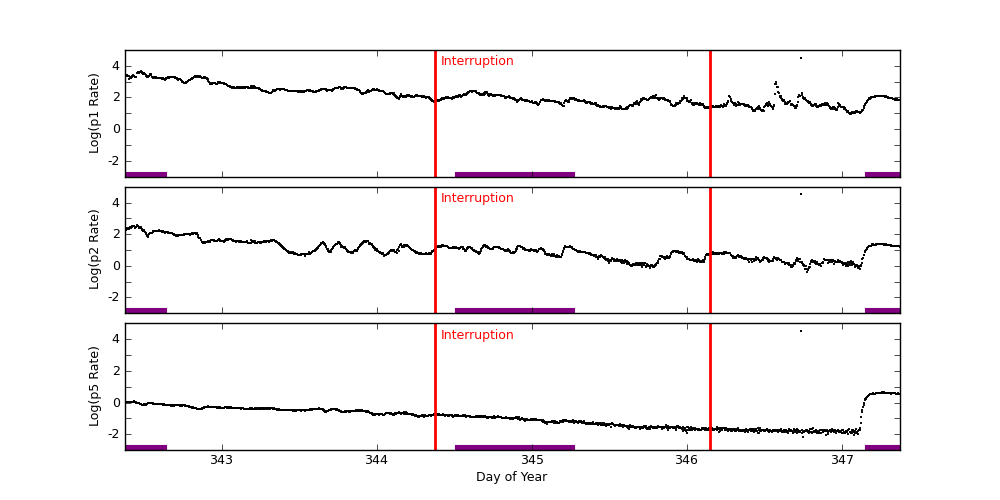
GOES-11 Plot (P1/P2/P5)
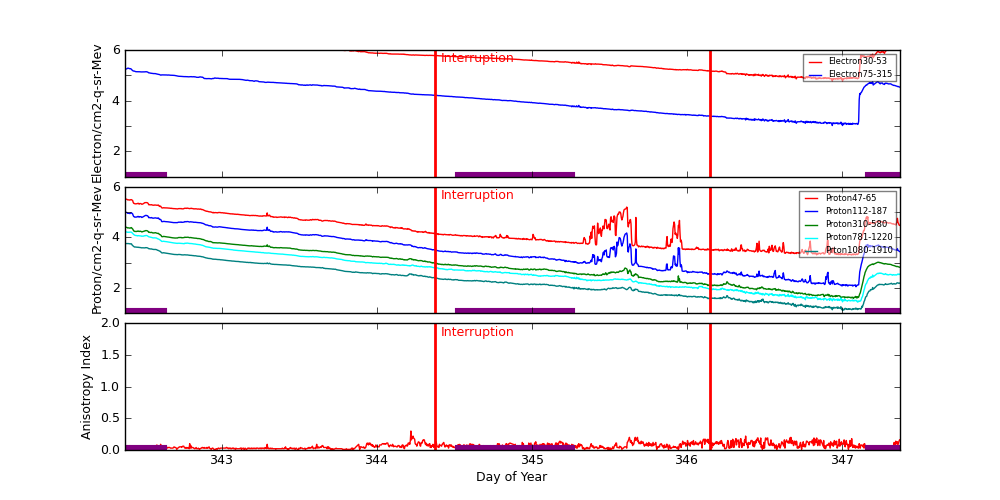
ACE radiation data are plotted around periods when science runs were interrupted. Plots start exactly 2 days before the interruption started. The top panel shows differential fluxes of electrons 38-53 and 175-315 (particles/cm2-s-ster-MeV), the middle panel shows differential fluxes of protons 47-65, 112-187, and 310-580 (particles/cm2-s-ster-MeV), and the bottom panel shows anisotropy ratio. The original data are prepared by the U.S. Dept. of Commerce, NOAA, Space Environment Center.
Data Period  (dom): 342.3743 - 347.3743
Interruption (dom): 344.3743 - 346.1493
			Avg		 Max		Time	Min		Time		Value at Interruption Started
--------------------------------------------------------------------------------------------------------------------------
e38 		8.392e+05+/-9.129e+05	4.810e+06	342.396 	5.930e+04	347.003		1.140e+06
e175		2.926e+04+/-3.657e+04	1.910e+05	342.392 	1.040e+03	346.938		3.440e+04
p47 		4.098e+04+/-5.658e+04	3.220e+05	342.382 	1.990e+03	347.038		3.000e+04
p112		1.033e+04+/-1.696e+04	9.770e+04	342.382 	1.120e+02	347.090		2.750e+03
p310		2.555e+03+/-4.314e+03	2.500e+04	342.382 	3.870e+01	347.073		6.630e+02
p761		1.564e+03+/-2.789e+03	1.640e+04	342.378 	2.760e+01	347.101		3.490e+02
p1060		5.682e+02+/-9.649e+02	5.680e+03	342.378 	1.270e+01	347.003		1.550e+02
anisotropy	6.456e-02+/-4.248e-02	3.000e-01	344.219 	1.000e-02	342.507		1.600e-01

Hardness:
e38/e175	4.187e+01+/-1.414e+01	6.818e+01	347.062 	9.537e+00	347.111		3.314e+01
p47/p1060	1.236e+02+/-1.691e+02	1.832e+03	345.611 	5.048e+01	342.441		1.935e+02
p112/p1060	1.723e+01+/-1.422e+01	1.739e+02	345.611 	7.198e+00	346.993		1.774e+01
p310/p1060	4.130e+00+/-1.042e+00	1.190e+01	347.160 	2.324e+00	346.993		4.277e+00
p761/p1060	2.454e+00+/-2.751e-01	3.291e+00	347.160 	1.626e+00	346.486		2.252e+00

Steepest Rise
------------
	Time		Slope(in log per hr)
----------------------------------------
e1  	343.7604		1235988.8587
e175	347.2431		59759.4613
p47 	345.5972		118078.9356
p112	342.5000		13199.8810
p310	343.7604		2615.9764
p761	343.7604		1559.9859
p1060	343.7604		573.5948
Two vertical red lines indicate the start and the end of the interruption. Purple hatched areas indicate that the satellite is in the radiation belt.
EPHIN Data are used to trigger science run interruptions. The trigger levels are:
| P4 | 300 | Counts/cm2 sec sr MeV |
| P41 | 10 | Counts/cm2 sec sr MeV |
| E1300 | 20 | Counts/cm2 sec sr MeV |
		Avg			Max		Time		Min		Time		Value at Interruption Started
--------------------------------------------------------------------------------------------------------------------------
p4	1.719e+03 +/- 6.211e+03		6.383e+04	342.396		4.234e+00	347.033		1.125e+02
p41	4.098e+00 +/- 5.973e+00		3.362e+01	342.394		1.000e-04	344.515		1.948e+00
e1300	1.474e+02 +/- 3.297e+02		2.045e+03	347.270		1.524e+00	346.759		2.718e+01
Two vertical red lines indicate the start and the end of the interruption. Red horizontal lines indicate SCS 107 limits. Purple hatched areas indicate that the satellite is in the radiation belt.
GOES-11 data are taken from NOAA site (http://goes.ngdc.noaa.gov).
| P1 | .8 - 4.0 | MeV protons (Counts/cm2 sec sr MeV) Uncorrected |
| P2 | 4.0 - 9.0 | MeV protons (Counts/cm2 sec sr MeV) Uncorrected |
| P5 | 40.0 - 80.0 | MeV protons (Counts/cm2 sec sr MeV) Uncorrected |
		Avg			Max		Time		Min		Time		Value at Interruption Started
--------------------------------------------------------------------------------------------------------------------------
p1	3.959e+02 +/- 1.366e+03		3.270e+04	346.733		9.270e+00	347.059		6.170e+01
p2	7.037e+01 +/- 1.218e+03		3.270e+04	346.733		3.880e-01	346.774		1.090e+01
p5	4.579e+01 +/- 1.218e+03		3.270e+04	346.733		6.750e-03	346.750		1.700e-01
Two vertical red lines indicate the start and the end of the interruption. Red horizontal lines indicate SCS 107 limits. Purple hatched areas indicate that the satellite is in the radiation belt.