| Science Run Stop: | 2012:02:27:03:24 |
| Science Run Start: | 2012:02:27:20:23 |
| Interruption: | 61.0ks |
| Triggered by: | manual |
Go to:
ACE Plot (E38/E175, P47/P112/P310/P761/P1060, Anisotopy)
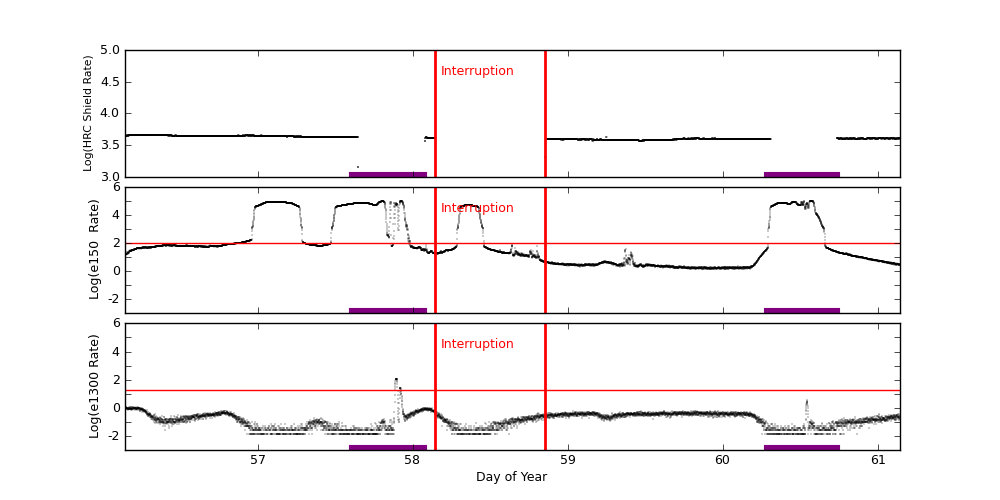
EPHIN Plot (HRC Shield Rate/E150/E1300)
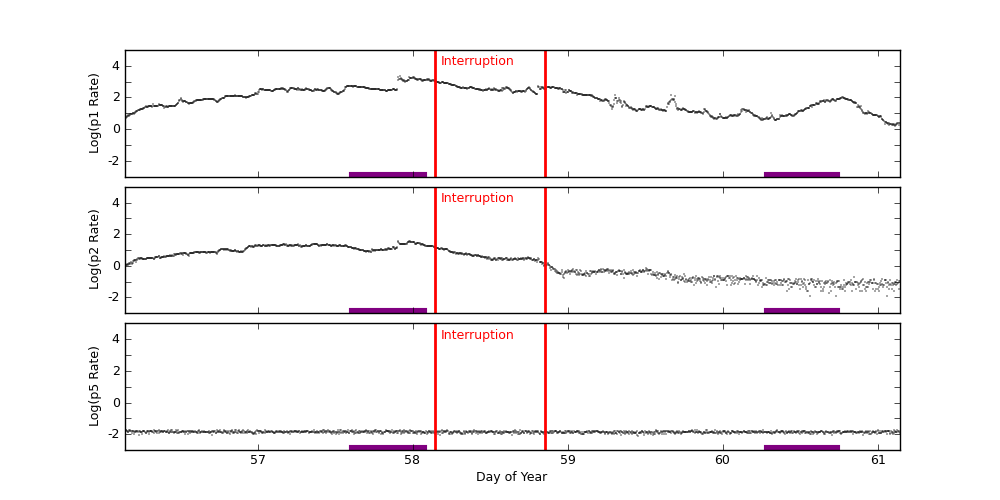
GOES-15 Plot (P1/P2/P5)
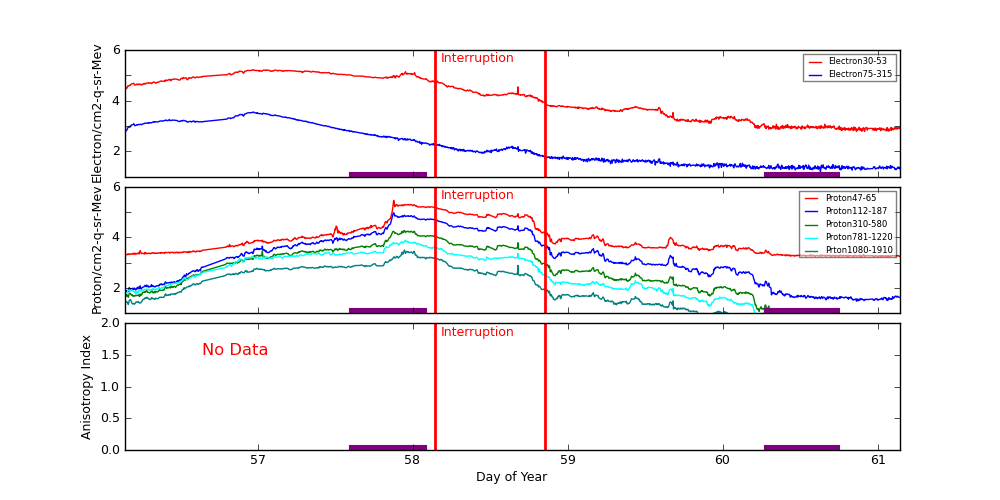
ACE radiation data are plotted around periods when science runs were interrupted. Plots start exactly 2 days before the interruption started. The top panel shows differential fluxes of electrons 38-53 and 175-315 (particles/cm2-s-ster-MeV), the middle panel shows differential fluxes of protons 47-65, 112-187, and 310-580 (particles/cm2-s-ster-MeV), and the bottom panel shows anisotropy ratio. The original data are prepared by the U.S. Dept. of Commerce, NOAA, Space Environment Center.
Data Period  (dom): 56.1417 - 61.1417
Interruption (dom): 58.1417 - 58.8493
			Avg		 Max		Time	Min		Time		Value at Interruption Started
--------------------------------------------------------------------------------------------------------------------------
e38 		4.405e+04+/-5.186e+04	1.670e+05	56.969 	6.100e+02	60.861		7.890e+02
e175		5.482e+02+/-8.307e+02	3.560e+03	56.969 	1.580e+01	60.629		2.050e+01
p47 		2.731e+04+/-4.705e+04	2.880e+05	57.875 	1.690e+03	60.972		1.770e+03
p112		9.165e+03+/-1.615e+04	9.350e+04	57.875 	3.000e+01	60.861		4.240e+01
p310		2.235e+03+/-3.615e+03	1.870e+04	57.944 	3.360e+00	60.906		6.430e+00
p761		1.068e+03+/-1.489e+03	7.660e+03	57.951 	9.150e-01	60.875		2.060e+00
p1060		3.440e+02+/-5.124e+02	3.160e+03	57.944 	2.120e-01	60.858		6.280e-01
anisotropy	0.000e+00+/-0.000e+00	0.000e+00	0.000 	1.000e+10	0.000		-1.000e+00

Hardness:
e38/e175	1.114e+02+/-8.725e+01	4.652e+02	58.010 	2.416e+01	60.354		3.849e+01
p47/p1060	7.628e+02+/-1.480e+03	8.679e+03	60.858 	1.171e+01	56.906		2.818e+03
p112/p1060	4.048e+01+/-2.930e+01	1.755e+02	60.858 	2.566e+00	56.149		6.752e+01
p310/p1060	7.518e+00+/-3.323e+00	2.085e+01	60.858 	1.666e+00	56.323		1.024e+01
p761/p1060	3.496e+00+/-9.666e-01	1.174e+01	60.708 	1.918e+00	56.542		3.280e+00

Steepest Rise
------------
	Time		Slope(in log per hr)
----------------------------------------
e1  	56.9618		189602.1364
e175	56.9618		3972.0447
p47 	57.8576		288723.2532
p112	57.8576		79080.8911
p310	57.8542		11712.1320
p761	57.6528		3168.0357
p1060	57.9271		1788.0201
Two vertical red lines indicate the start and the end of the interruption. Purple hatched areas indicate that the satellite is in the radiation belt.
EPHIN Data are used to trigger science run interruptions. The trigger levels are:
| HRC Shield Rate | NA | |
| E150 | 100 | Counts/cm2 sec sr eV |
| E1300 | 20 | Counts/cm2 sec sr eV |
		Avg			Max		Time		Min		Time		Value at Interruption Started
--------------------------------------------------------------------------------------------------------------------------
hrc	4.098e+03 +/- 3.329e+02		4.606e+03	56.254		1.188e+02	60.730		4.043e+03
e150	1.285e+04 +/- 2.594e+04		9.627e+04	60.562		1.316e+00	59.817		1.777e+01
e1300	5.964e-01 +/- 5.454e+00		1.188e+02	57.894		1.000e-04	56.956		4.951e-01
Two vertical red lines indicate the start and the end of the interruption. Red horizontal lines indicate SCS 107 limits. Purple hatched areas indicate that the satellite is in the radiation belt.
GOES-15 data are taken from NOAA site (http://goes.ngdc.noaa.gov).
| P1 | .8 - 4.0 | MeV protons (Counts/cm2 sec sr MeV) Uncorrected |
| P2 | 4.0 - 9.0 | MeV protons (Counts/cm2 sec sr MeV) Uncorrected |
| P5 | 40.0 - 80.0 | MeV protons (Counts/cm2 sec sr MeV) Uncorrected |
		Avg			Max		Time		Min		Time		Value at Interruption Started
--------------------------------------------------------------------------------------------------------------------------
p1	2.257e+02 +/- 3.234e+02		2.300e+03	57.913		1.590e+00	61.108		1.070e+03
p2	6.132e+00 +/- 7.882e+00		3.790e+01	57.976		1.210e-02	60.559		1.390e+01
p5	1.383e-02 +/- 1.815e-03		1.970e-02	58.188		8.060e-03	59.451		1.100e-02
Two vertical red lines indicate the start and the end of the interruption. Red horizontal lines indicate SCS 107 limits. Purple hatched areas indicate that the satellite is in the radiation belt.