MTA Monitoring Report 11/11/03 - 11/17/05

Archive of all weekly reports

Archive of monthly reports

Radiation

Quiet

Detrended CTI

CTI page was updated. The top panel shows an example of detrended CTI measurements from the front illuminated CCD3 Node 0. The top plot is all data points without any temperature dependency correction. The middle plot is data with the focal temperature equal or colder than -119.7 C, and the integration time longer than 7,000 sec. The bottom plot is all data with the temperature correction.

The values quoted below are temperature factor corrected ones.
Average of ACIS-I CCDs (MnKa) slope 4.365e-9 CTI/day
Detrended slope 7.684e-9 CTI/day

ACIS Warm Pixels

We display all bad pixels showed up in past, and, if any, previously unknown bad pixels appeared in the last 14 days. We also list hot pixels (defined as 1000 above the average of bias background). Warm columns 509-514 are probably due to a computational artificial effect due to boundaries.


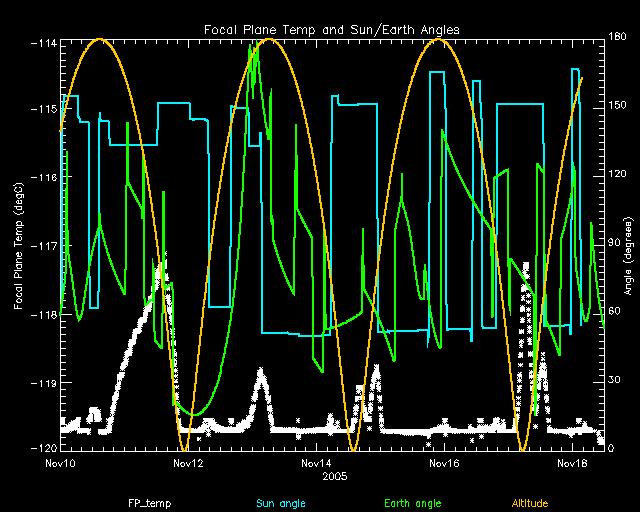
ACIS Focal Plane Temperature

SIM Movements

12 TSC moves this period
weekly average time/step 0.00131 s
mission average time/step 0.00136 s

Telemetry

IRUs


Recent Observations

ACIS faint and vfaint mode observations are again available.
OBSID DETECTOR GRATING TARGET ANALYSIS ACA
5828 ACIS-I NONE M87 OK OK
7218 ACIS-I NONE A478_OFFSET2 OK OK
7211 ACIS-I NONE M87 OK OK
5650 ACIS-S NONE SDSS J034313.76+010336.9 OK OK
7210 ACIS-I NONE M87 OK OK
7217 ACIS-I NONE A478_OFFSET2 OK OK
7212 ACIS-I NONE M87 OK OK
6143 ACIS-S HETG The Crab Nebula OK /Grat OK

Trending

This Week's focus is HRMA Thermal.

Trends last reported on Aug. 25.

Only the most interesting or representative msids are shown below. For a full listing choose the bulletted link.