Archive of all weekly reports
Archive of monthly reports
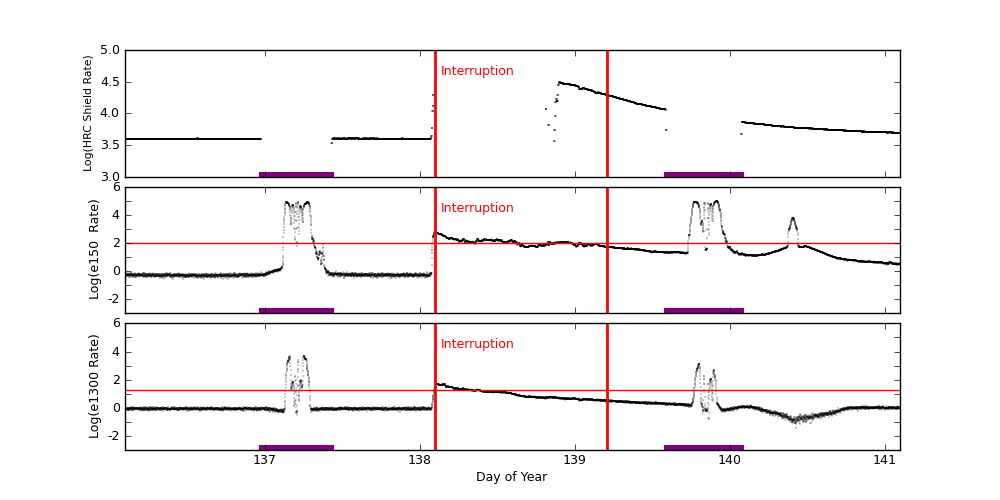
At approximately 138:0130 sunspot region 1476 produced an M7 flare
with an associated fast hard proton event. Both the E1300 and HRC
antico shield rates exceeded the Radmon thresholds and SCS107 ran at
138:02:18:14. The SCS107 run was nominal and ACIS and HRC both
reported nominal safing.
There is an associated CME visible in the LASCO C2 data, but it is not
clear to what extent it will be Earth-directed.
(from Radiation telecom summary 05/16/2012, 11:53pm.)
See more details at Radiation Event Archive.
Although we have quoted CTI values of the cleanest data (FT <= -119.7 C, int time > 7000sec), the data fills these conditions are getting rare. We quote CTI temperature factor corrected ones. The values in the parentheses are CTI based on the cleanest data.
| Average of ACIS-I CCDs (MnKa) slope: | 2.233e-5 CTI/day | (1.375e-5 CTI/day) |
|---|---|---|
| Detrended slope: | 6.886e-5 CTI/day | (7.057e-5 CTI/day) |
We display all bad pixels showed up in past, and, if any, previously unknown bad pixels appeared in the last 14 days. We also list hot pixels (defined as 1000 above the average of bias background). Warm columns 509-514 are probably due to a computational artificial effect due to boundaries.
| CCD0 | CCD1 | CCD2 | CCD3 | CCD4 | CCD5 | CCD6 | CCD7 | CCD8 | CCD9 | |
|---|---|---|---|---|---|---|---|---|---|---|
| Previously Unknown Bad Pixels | ||||||||||
| Current Warm Pixels | (117,749) (153,205) (667,782) (692,141) | (802,665) (910,239) | (335,412) | |||||||
| Flickering Warm Pixels | (427,125) | (526,66) | (703,739) (811,637) | (233,321) (233,322) (233,323) (233,324) (233,325) (233,326) (233,315) (369,376) (367,511) (352,544) (258,797) (669,577) (233,327) (233,328) (263,317) (282,385) (641,669) (1023,166) (280,313) (745,313) (109,1) (792,313) | (843,420) (884,31) (1000,214) | (199,678) | (139,109) (356,902) (326,978) (881,53) (1024,453) (1024,454) (1024,455) (1024,456) (1024,457) (1024,458) (913,165) (833,325) (197,241) (587,544) | (636,819) (40,49) (569,1016) | ||
| Current Hot Pixels | ||||||||||
| Flickering Hot Pixels | ||||||||||
| Warm column candidates | ||||||||||
| Flickering Warm Column Candidates | 509 518 | 509 | 509 | 509 514 1021 | 509 517 1021 | 509 | 509 514 1021 | 509 |
For this period, 6 peaks are observed.
| Day (DOY) | Temp (C) | Width (Days) | |
|---|---|---|---|
| 132.00 | -109.95 | 0.22 | |
| 134.29 | -117.62 | 1.61 | |
| 134.76 | -116.08 | 0.30 | |
| 135.99 | -117.77 | 0.44 | |
| 137.38 | -117.63 | 0.10 | |
| 138.10 | -118.16 | 0.22 |
Weekly focal plane temperature with sun angle, earth angle, and altitude overplotted. Sun angle is the solar array angle, that is the angle between the sun and the optical axis (+X axis). The earth angle is the angle between earth and the ACIS radiator (+Z axis). Altitude varies from 34 kkm to 128 kkm.
7 TSC moves this period
| weekly average time/step | 0.00128 s |
|---|---|
| mission average time/step | 0.00133 s |
New violations or new extrema are shown in blue cells.
| MSID | 05/11/12 | 05/12/12 | 05/13/12 | 05/14/12 | 05/15/12 | 05/16/12 | 05/17/12 | yellow limits (lower) upper | red limits (lower) upper | Units | Description |
| HRMACAV | (284.85) | (284.85) | (284.85) | (284.85) | (293.4) 294.8 | (292.8) 295.5 | TEMP | # HRMA CAVITY AVG | |||
| AFTBLKHDT | (256.52) | (260.2) 303.0 | (250.2) 308.0 | TEMP | # AFT BULKHEAD | ||||||
| MZOBACONE | (254.36) | (260.2) 303.0 | (250.2) 308.0 | CONE | # -Z SIDE OBA | ||||||
| PZOBACONE | (247.08) | (260.2) 303.0 | (250.2) 308.0 | CONE | # +Z SIDE OBA | ||||||
| AACH1T | (294.33) | (294.33) | (293.96) | (293.96) | (294.33) | (294.70) | (293.96) | (314.0) 341.0 | (264.0) 373.0 | K | #PEA1 AC HOUSING TEMPERATURE IMAGE 0 |
| OOBTHR56 | 296.51 | 296.33 | 295.98 | 295.44 | 295.62 | 295.80 | 295.35 | (281.9) 295.0 | (250.2) 308.0 | K | #RT 158: OBA CONE |
| OBSID | DETECTOR | GRATING | TARGET | ANALYSIS | ACA |
|---|---|---|---|---|---|
| 13474 | ACIS-01236 | NONE | SPT-CLJ0456-5116 | OK | OK |
| 13618 | ACIS-35678 | NONE | HD 125823 | OK | OK |
| 13848 | ACIS-56789 | HETG | Sgr A* | OK | OK |
| 13849 | ACIS-56789 | HETG | Sgr A* | OK | OK |
| 13799 | ACIS-235678 | NONE | PSR J1339-4712 | OK | OK |
| 13706 | ACIS-7 | NONE | Terzan 5 | OK | OK |
| 13999 | ACIS-01236 | NONE | RXJ 1347.5-1145 | OK | OK |
| 13311 | ACIS-678 | NONE | SDSS J1604+1645 | OK | OK |
| 12373 | ACIS-235678 | NONE | NGC 7662 | OK | OK |
| 14229 | ACIS-7 | NONE | Cassiopeia A | OK | OK |
This week's focus is Spacecraft Bus and Subsystem Trends.
Last reported on
Feb 23.
Only the most interesting or representative msids are shown below.
For a full listing choose the bulletted link.
Min/max envelopes in dark blue appear on the trending plots. The envelopes are 4th degree fits to the monthly minimum and maximum values for each MSID. The final polynomial form and binning are still being experimented with. We will soon add to the trending pages a report of the fits and predictions they give on future limit violations. The light blue curve is our original smoothing of all the data over 30 day moving boxcars. The green/yellow line is a linear fit to all the data; the break occurs at a limit change.
| MSID | MEAN | RMS | DELTA/YR | DELTA/YR/YR | UNITS | DESCRIPTION |
| TCNR_BRM | 286.97 | 5.67 | -7.883e-01 | -5.688e-02 | K | -Y/+Z PANEL CORNER PANEL TEMP (BRM) |
| TFSSBKT1 | 323.33 | 19.78 | 1.206e+00 | -3.404e-01 | K | FSS BRACKET-1 TEMP (+Y) |
| TFSSBKT2 | 317.39 | 24.92 | 4.721e-01 | -2.257e-01 | K | FSS BRACKET-2 TEMP (+Y) |
| TSCIUSF1 | 297.74 | 3.247e+01 | 5.558e-02 | -1.333e+00 | K | SC-IUS FITTING-1 TEMP |
| Previous Quarter | ||||||
| MSID | MEAN | RMS | DELTA/YR | DELTA/YR/YR | UNITS | DESCRIPTION |
| TCNR_BRM | 273.93 | 3.41 | -2.369e+01 | 1.953e+02 | K | -Y/+Z PANEL CORNER PANEL TEMP (BRM) |
| TFSSBKT1 | 331.16 | 17.66 | -8.844e+01 | 9.329e+02 | K | FSS BRACKET-1 TEMP (+Y) |
| TFSSBKT2 | 323.22 | 25.34 | -1.151e+02 | 1.238e+03 | K | FSS BRACKET-2 TEMP (+Y) |
| TSCIUSF1 | 300.74 | 3.531e+01 | -2.141e+02 | 2.433e+03 | K | SC-IUS FITTING-1 TEMP |
| MSID | MEAN | RMS | DELTA/YR | DELTA/YR/YR | UNITS | DESCRIPTION |
| ELBV | 29.67 | 0.37 | -6.858e-02 | -9.530e-03 | V | LOAD BUS VOLTAGE |
| OHRMAPWR | 60.96 | 1.98 | -1.888e-01 | -8.604e-02 | W | HRMA COMPUTED TOTAL POWER |
| OOBAPWR | 71.38 | 17.39 | -4.412e+00 | 5.040e-01 | W | OBA COMPUTED TOTAL POWER |
| Previous Quarter | ||||||
| MSID | MEAN | RMS | DELTA/YR | DELTA/YR/YR | UNITS | DESCRIPTION |
| ELBV | 29.01 | 0.16 | 1.297e+00 | 8.060e+00 | V | LOAD BUS VOLTAGE |
| OHRMAPWR | 58.84 | 1.73 | 7.581e+00 | -1.992e+02 | W | HRMA COMPUTED TOTAL POWER |
| OOBAPWR | 50.29 | 3.09 | 2.177e+01 | -2.207e+02 | W | OBA COMPUTED TOTAL POWER |
If you have any questions, please contact: swolk@head.cfa.harvard.edu
)
)
)
)
)
)
)
)
)
)
)
)
)
)