| CCD0 | CCD1 | CCD2 | CCD3 | CCD4 | CCD5 | CCD6 | CCD7 | CCD8 | CCD9 | |
|---|---|---|---|---|---|---|---|---|---|---|
| Previously Unknown Bad Pixels | ||||||||||
| Current Warm Pixels | (154,9) (143,700) | (36,614) (802,665) (910,239) | (803,225) (178,149) (526,66) (726,537) (665,25) | (680,391) (811,637) (21,95) | (670,387) | (335,412) | ||||
| Flickering Warm Pixels | (370,70) (427,125) | (104,31) | (318,53) (144,50) | (641,669) (282,385) (369,376) (233,227) (792,313) (258,797) (263,317) (233,102) (357,303) (728,340) (367,511) (669,577) (161,206) | (414,5) (884,31) (287,164) (911,50) (1000,214) | (182,474) (275,393) (675,304) (136,65) (139,109) (34,645) (881,53) (721,286) (198,699) | ||||
| Current Hot Pixels | ||||||||||
| Flickering Hot Pixels | ||||||||||
| Warm column candidates | 510 1022 512 | 512 1022 | ||||||||
| Flickering Warm column candidates |
ACIS Focal Plane Temperature
For this period, 8 peaks are observed.
| Day (DOY) | Temp (C) | Width (Days) | |
|---|---|---|---|
| 088.66 | -90.22 | 0.53 | |
| 089.44 | -108.77 | 0.93 | |
| 090.48 | -110.33 | 0.56 | |
| 091.30 | -87.93 | 0.84 | |
| 091.91 | -110.65 | 0.56 | |
| 092.42 | -111.47 | 0.48 | |
| 092.93 | -110.23 | 0.71 | |
| 093.95 | -87.81 | 1.07 |
Weekly focal plane temperature with sun angle, earth angle, and altitude overplotted. Sun angle is the solar array angle, that is the angle between the sun and the optical axis (+X axis). The earth angle is the angle between earth and the ACIS radiator (+Z axis). Altitude varies from 34 kkm to 128 kkm.

SIM Movements
7 TSC moves this period
| weekly average time/step | 0.00219 s |
|---|---|
| mission average time/step | 0.00132 s |
Telemetry
New violations or new extrema are shown in blue cells.
| MSID | 03/31/23 | 04/01/23 | 04/02/23 | 04/03/23 | 04/04/23 | 04/05/23 | 04/06/23 | yellow limits (lower) upper | red limits (lower) upper | Units | Description |
| TFTERANGE | 46.86 | 48.07 | 48.75 | 46.49 | (16.7) 37.5 |
(11.1) 45.0 |
K | TFTE VENT/RAD TEMP | |||
| TSCTSF3 | (266.97) | (266.61) | (278.15) 359.15 |
(269.15) 483.15 |
K | SC-TS FITTING -3 TEMP | |||||
| OBAAVG | 303.81 | 301.37 | 302.16 | 304.19 | 302.32 | 303.11 | (282.5) 300.0 |
(281.4) 301.0 |
K | OBA/TFTE TEMP | |
| OBACONEAVG | 309.87 | 304.77 | (282.5) 300.0 |
(281.8) 301.0 |
K | OBA CONE AVG TEMP | |||||
| MZOBACONE | 311.90 | 308.75 | 310.21 | 312.73 | 309.08 | 309.89 | (260.2) 303.0 |
(250.2) 308.0 |
CONE | -Z SIDE OBA CONE | |
| ESAMYI | (0.06) | (0.06) | (0.06) | (5.63) 27.0 |
(5.3) 33.0 |
AMP | S/A -Y CURRENT | ||||
| TCM_PA2 | (260.05) | (260.05) | (259.69) | (269.15) 348.15 |
(260.15) 413.15 |
K | RF POWER AMP-2 EXT BPL TEMP | ||||
| CTXBPWR | (0.00) | (0.00) | (0.00) | (0.00) | (0.00) | (36.12) 37.0 |
(36.0) 38.0 |
DBM | TRANSMITTER B OUTPUT POWER | ||
| AWD6TQI | (-3.47) | (-3.43) | (-3.43) | (-1.22) 1.22 |
(-3.3) 3.3 |
AMP | WHEEL 6 TORQUE CURRENT | ||||
| OBADIAGRAD | 4.56 | 4.53 | 4.60 | 4.75 | 4.49 | 4.38 | 4.55 | (-1.11) 3.5 |
(-2.78) 3.9 |
K | OBA DIAM GRAD |
| ESAPYI | (0.14) | (0.14) | (0.14) | (5.54) 27.0 |
(5.2) 33.0 |
AMP | S/A +Y CURRENT | ||||
| HRMAAVG | 309.19 | 309.12 | 309.16 | 310.08 | 309.17 | 310.32 | 309.12 | (306.0) 308.0 |
(305.0) 309.0 |
K | AVG OF HRMA METRICS |
| TCM_PA1 | (259.32) | (258.96) | (260.05) | (259.69) | (258.96) | (259.32) | (258.56) | (269.15) 348.15 |
(260.15) 413.15 |
K | RF POWER AMP-1 EXT BPL TEMP |
| AWD1TQI | (-3.39) | (-3.39) | (-1.22) 1.22 |
(-3.3) 3.3 |
AMP | WHEEL 1 TORQUE CURRENT | |||||
| TCM_TX1 | (267.70) | (267.33) | (268.06) | (267.33) | (266.97) | (267.33) | (266.61) | (283.15) 348.15 |
(269.15) 404.15 |
K | TRANSPONDER-1 EXT BPL TEMP |
| PZOBACONE | 308.18 | 308.65 | (260.2) 303.0 |
(250.2) 308.0 |
CONE | +Z SIDE OBA CONE |
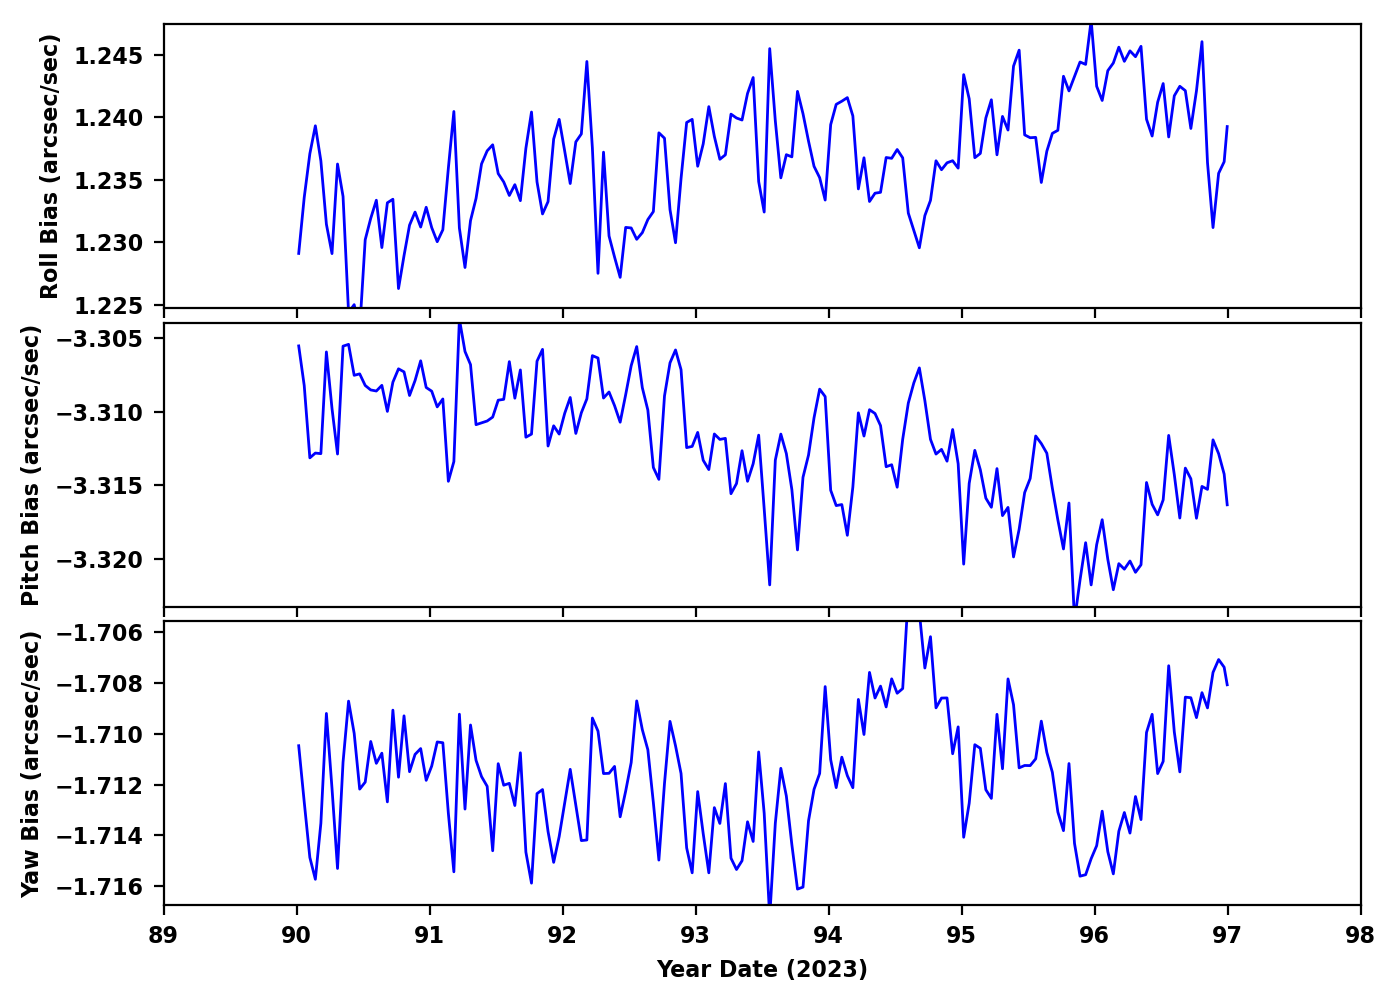
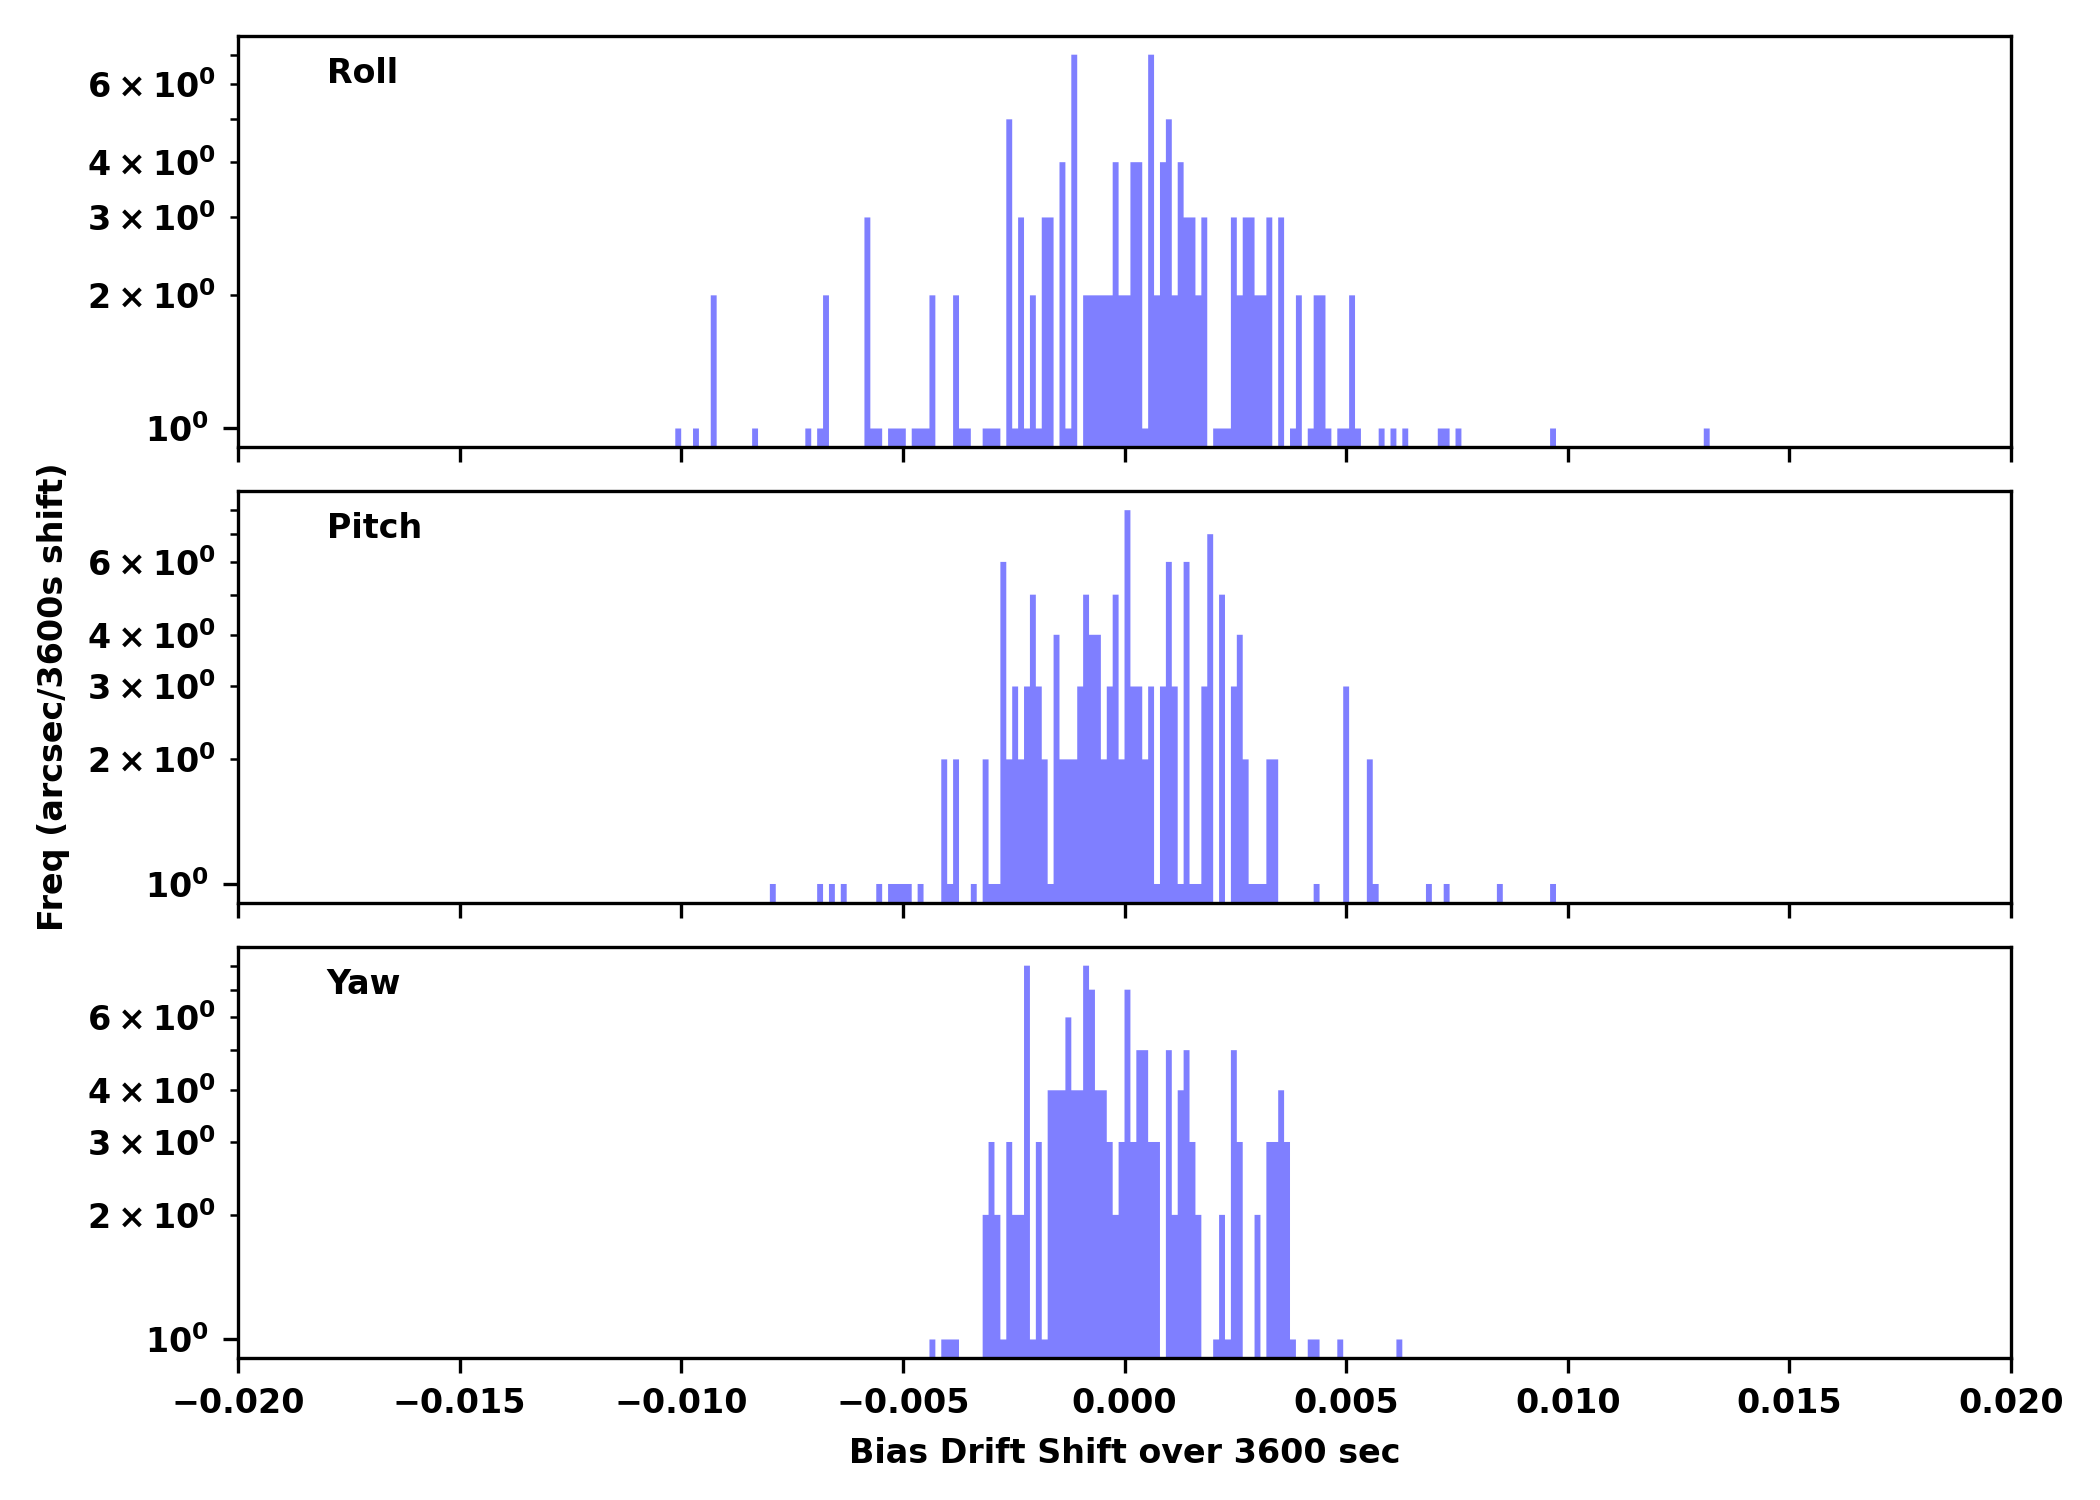
IRUs
| Gyro Bias Drift | Gyro Bias Drift Histogram |
|---|---|
|
|
Recent Observations
| OBSID | DETECTOR | GRATING | TARGET | ANALYSIS | ACA |
|---|---|---|---|---|---|
| 27362 | ACIS-0123 | NONE | NGC4254 | OK | OK |
| 27770 | ACIS-67 | NONE | ESO137-G034 | OK | OK |
| 25759 | ACIS-0123 | NONE | PSZ2 G066.41+27.03 | OK | OK |
| 27775 | ACIS-0123 | NONE | NGC4254 | OK | OK |
| 27777 | ACIS-67 | NONE | GRB230307A | OK | OK |
| 26690 | ACIS-0123 | NONE | 2MASS J18005192-3423271 | OK | OK |
| 27778 | ACIS-67 | NONE | GRB230307A | OK | OK |
| 27025 | ACIS-0123 | NONE | A1795 | OK | OK |
| 27027 | ACIS-2567 | NONE | A1795 | OK | OK |
| 27779 | ACIS-67 | NONE | GRB230307A | OK | OK |
| 27772 | ACIS-67 | NONE | PSR J1846-0258 | OK | OK |
| 27028 | ACIS-2567 | NONE | A1795 | OK | OK |
| 27776 | ACIS-0123 | NONE | PSZ2 G066.41+27.03 | OK | OK |
| 25341 | ACIS-67 | NONE | SDSSJ121027.62+174108.9 | OK | OK |
| 26751 | ACIS-367 | NONE | VCC 971 | OK | OK |
| 27781 | ACIS-67 | NONE | SDSSJ132643.62+015209.3 | OK | OK |
| 26689 | ACIS-0123 | NONE | IGR J17217-4557 | OK | OK |
| 25772 | ACIS-0123 | NONE | ESO 338-4 | OK | OK |
| 26512 | ACIS-5678 | HETG | Cen X-3 | OK/NA | OK |
| 27786 | ACIS-67 | NONE | IRAS13197m1627_s4 | OK | OK |
| 27790 | ACIS-0123 | NONE | CLJ220305.2-413757 | OK | OK |
| 27785 | ACIS-5678 | NONE | MCG-01-33-063 | OK | OK |
| 25773 | ACIS-0123 | NONE | ESO 338-4 | OK | OK |
| 25774 | ACIS-0123 | NONE | ESO 338-4 | OK | OK |
| 27787 | ACIS-0123 | NONE | UGCA 320 | OK | OK |
| 26800 | ACIS-23678 | NONE | SDSS J073913.65+461858.5 | OK | OK |
| 26749 | ACIS-23567 | NONE | VCC 567 | Missing | Missing |
Trending
This week's focus is Spacecraft Bus and Subsystem Trends
Last reported on
Jan 19.
Only the most interesting or representative msids are shown below.
For a full listing choose the bulletted link.
| MSID | Mean | RMS | Delta/Yr | Delta/Yr/Yr | Unit | Description | |
|---|---|---|---|---|---|---|---|
| eb1v | off | -0.022 | 1.579e-04 | 32.47 +/- 0.19 | -0.00 +/- 0.00 | V | BATT 1 VOLTAGE | on | -0.059 | 0.009 | 32.25 +/- 0.71 | -0.00 +/- 0.00 |
| eb2ci | off | -0.004 | 9.118e-05 | 0.34 +/- 0.07 | (3.29+/-14.87)e-4 | AMP | BATT 2 CHARGE CURRENT | on | 0.009 | 0.005 | 0.43 +/- 0.26 | -0.00 +/- 0.00 |
| eb2v | off | -0.020 | 1.691e-04 | 32.47 +/- 0.18 | -0.01 +/- 0.00 | V | BATT 2 VOLTAGE | on | -0.063 | 0.011 | 32.22 +/- 0.72 | -(4.21+/-225.70)e-5 |
| ecnv3v | -0.001 | 2.060e-05 | 15.30 +/- 0.02 | -(7.00+/-6.74)e-5 | V | CONV 3 +15V OUTPUT | |
| eepa5v | -3.983e-04 | 2.507e-04 | 5.23 +/- 0.17 | (2.17+/-0.25)e-10 | V | +5V RCTU_EP A |
| MSID | Mean | RMS | Delta/Yr | Delta/Yr/Yr | Unit | Description | |
|---|---|---|---|---|---|---|---|
| tape2pst | 0.583 | 0.002 | (2.89+/-0.04)e2 | 0.04 +/- 0.03 | K | PEA-2 POWER SUPPLY TEMP | |
| tapea1t | 0.507 | 0.002 | (3.01+/-0.04)e2 | 0.07 +/- 0.03 | K | PEA-1 CASE TEMP | |
| tcylaft1 | 1.811 | 0.007 | (3.02+/-0.14)e2 | 0.13 +/- 0.14 | K | CNT CYL TEMP:16-IN FWD OF SC-TS FIT-1 | |
| tpc_ese | 1.178 | 0.008 | (2.87+/-0.09)e2 | 0.04 +/- 0.21 | K | ESE TEMP | |
| tsamyt | on | -0.138 | 0.049 | (3.19+/-0.03)e2 | -0.07 +/- 0.08 | K | -Y WING SOLAR ARRAY TEMP | off | 0.034 | 0.003 | (3.19+/-0.02)e2 | -0.01 +/- 0.03 |
| tsapyt | on | -0.106 | 0.048 | (3.18+/-0.03)e2 | -0.06 +/- 0.08 | K | +Y WING SOLAR ARRAY TEMP | off | 0.062 | 0.003 | (3.19+/-0.02)e2 | 0.01 +/- 0.03 |
| MSID | Mean | RMS | Delta/Yr | Delta/Yr/Yr | Unit | Description | |
|---|---|---|---|---|---|---|---|
| tatecdrt | 0.592 | 0.002 | (2.89+/-0.04)e2 | 0.06 +/- 0.03 | K | TEC DRIVER RDNT TEMP | |
| trspmtpc | 1.469 | 0.007 | (2.95+/-0.11)e2 | -0.06 +/- 0.18 | K | RAD SHR PNL TEMP:TTWN MUPS AND PCAD | |
| tsctsf1 | 1.771 | 0.006 | (3.00+/-0.13)e2 | 0.11 +/- 0.11 | K | SC-TS FITTING -1 TEMP | |
| tsctsf2 | 0.772 | 0.003 | (2.78+/-0.06)e2 | 0.02 +/- 0.06 | K | SC-TS FITTING -2 TEMP |
If you have any questions, please contact: swolk@head.cfa.harvard.edu