| Science Run Stop: | 2005:08:02:01:16 |
| Science Run Start: | 2005:08:03:18:00 |
| Interruption: | 146.0ks |
| Triggered by: | manual |
Go to:
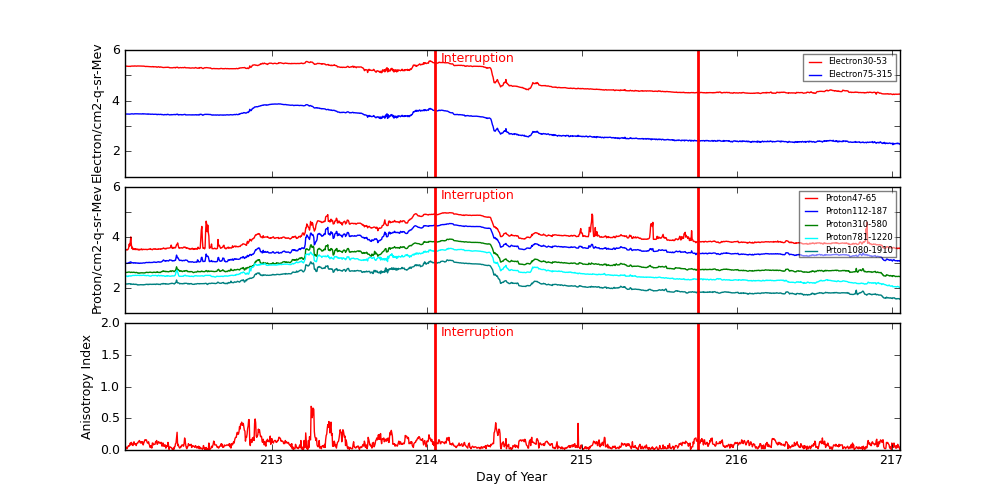
ACE Plot (E38/E175, P47/P112/P310/P761/P1060, Anisotopy)
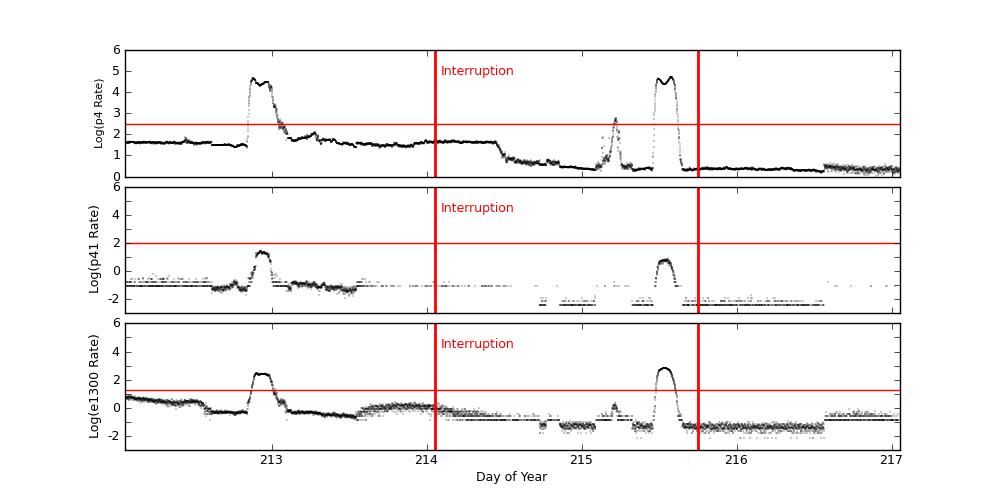
EPHIN Plot (P4/P41/E1300)
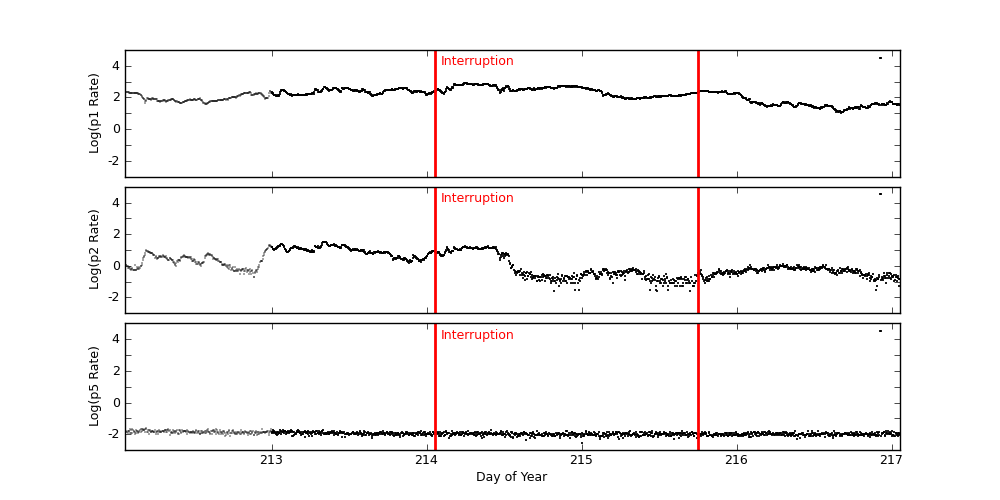
GOES-11 Plot (P1/P2/P5)
ACE radiation data are plotted around periods when science runs were interrupted. Plots start exactly 2 days before the interruption started. The top panel shows differential fluxes of electrons 38-53 and 175-315 (particles/cm2-s-ster-MeV), the middle panel shows differential fluxes of protons 47-65, 112-187, and 310-580 (particles/cm2-s-ster-MeV), and the bottom panel shows anisotropy ratio. The original data are prepared by the U.S. Dept. of Commerce, NOAA, Space Environment Center.
Data Period  (dom): 212.0528 - 217.0528
Interruption (dom): 214.0528 - 215.7500
			Avg		 Max		Time	Min		Time		Value at Interruption Started
--------------------------------------------------------------------------------------------------------------------------
e38 		1.228e+05+/-1.081e+05	3.700e+05	214.024 	1.740e+04	217.004		1.800e+04
e175		1.907e+03+/-1.963e+03	7.480e+03	213.045 	1.820e+02	217.007		1.900e+02
p47 		1.945e+04+/-2.305e+04	9.430e+04	214.146 	3.160e+03	212.146		3.630e+03
p112		6.565e+03+/-8.259e+03	3.520e+04	214.149 	9.360e+02	212.066		1.150e+03
p310		1.626e+03+/-1.934e+03	8.520e+03	214.146 	2.810e+02	217.024		2.810e+02
p761		7.869e+02+/-8.746e+02	3.700e+03	214.139 	1.040e+02	217.052		1.040e+02
p1060		2.714e+02+/-2.895e+02	1.280e+03	214.132 	3.590e+01	217.052		3.590e+01
anisotropy	9.855e-02+/-7.975e-02	6.900e-01	213.254 	1.000e-02	212.337		1.000e-02

Hardness:
e38/e175	7.529e+01+/-1.331e+01	1.088e+02	216.684 	3.910e+01	213.031		9.474e+01
p47/p1060	8.086e+01+/-5.059e+01	7.624e+02	215.066 	1.931e+01	213.160		1.011e+02
p112/p1060	2.581e+01+/-1.092e+01	4.862e+01	215.066 	6.445e+00	213.160		3.203e+01
p310/p1060	6.314e+00+/-2.005e+00	8.931e+00	215.222 	2.692e+00	213.021		7.827e+00
p761/p1060	2.894e+00+/-4.965e-01	4.299e+00	214.684 	1.537e+00	212.851		2.897e+00

Steepest Rise
------------
	Time		Slope(in log per hr)
----------------------------------------
e1  	213.9062		118801.3386
e175	212.8715		2304.0260
p47 	215.0486		86760.9776
p112	213.3438		16200.1825
p310	213.2326		3576.0403
p761	213.2326		1488.0168
p1060	213.2326		609.6069
Two vertical red lines indicate the start and the end of the interruption. Purple hatched areas indicate that the satellite is in the radiation belt.
EPHIN Data are used to trigger science run interruptions. The trigger levels are:
| P4 | 300 | Counts/cm2 sec sr MeV |
| P41 | 10 | Counts/cm2 sec sr MeV |
| E1300 | 20 | Counts/cm2 sec sr MeV |
		Avg			Max		Time		Min		Time		Value at Interruption Started
--------------------------------------------------------------------------------------------------------------------------
p4	1.621e+03 +/- 7.063e+03		5.169e+04	215.576		1.101e+00	216.900		5.403e+01
p41	4.324e-01 +/- 2.501e+00		2.837e+01	212.930		1.000e-04	211.856		1.000e-04
e1300	1.552e+01 +/- 7.689e+01		6.667e+02	215.535		1.000e-04	213.552		1.143e+00
Two vertical red lines indicate the start and the end of the interruption. Red horizontal lines indicate SCS 107 limits. Purple hatched areas indicate that the satellite is in the radiation belt.
GOES-11 data are taken from NOAA site (http://goes.ngdc.noaa.gov).
| P1 | .8 - 4.0 | MeV protons (Counts/cm2 sec sr MeV) Uncorrected |
| P2 | 4.0 - 9.0 | MeV protons (Counts/cm2 sec sr MeV) Uncorrected |
| P5 | 40.0 - 80.0 | MeV protons (Counts/cm2 sec sr MeV) Uncorrected |
		Avg			Max		Time		Min		Time		Value at Interruption Started
--------------------------------------------------------------------------------------------------------------------------
p1	2.735e+02 +/- 1.324e+03		3.270e+04	216.924		1.050e+01	216.670		2.650e+02
p2	5.775e+01 +/- 1.323e+03		3.270e+04	216.924		2.580e-02	214.819		8.220e+00
p5	5.351e+01 +/- 1.322e+03		3.270e+04	216.924		2.940e-03	215.003		1.090e-02
Two vertical red lines indicate the start and the end of the interruption. Red horizontal lines indicate SCS 107 limits. Purple hatched areas indicate that the satellite is in the radiation belt.