| Science Run Stop: | 2011:06:07:15:23 |
| Science Run Start: | 2011:06:08:12:50 |
| Interruption: | 77.0ks |
| Triggered by: | auto |
Go to:
ACE Plot (E38/E175, P47/P112/P310/P761/P1060, Anisotopy)
EPHIN Plot (HRC Shield Rate/E150/E1300)
GOES-15 Plot (P1/P2/P5)
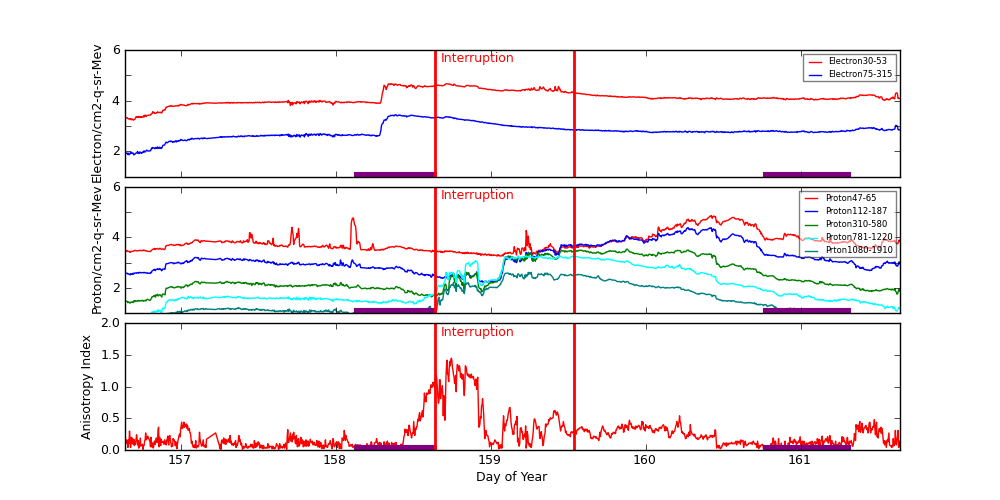
ACE radiation data are plotted around periods when science runs were interrupted. Plots start exactly 2 days before the interruption started. The top panel shows differential fluxes of electrons 38-53 and 175-315 (particles/cm2-s-ster-MeV), the middle panel shows differential fluxes of protons 47-65, 112-187, and 310-580 (particles/cm2-s-ster-MeV), and the bottom panel shows anisotropy ratio. The original data are prepared by the U.S. Dept. of Commerce, NOAA, Space Environment Center.
Data Period  (dom): 156.6410 - 161.6410
Interruption (dom): 158.6410 - 159.5347
			Avg		 Max		Time	Min		Time		Value at Interruption Started
--------------------------------------------------------------------------------------------------------------------------
e38 		1.620e+04+/-1.063e+04	4.680e+04	158.358 	1.690e+03	156.694		1.230e+04
e175		7.769e+02+/-5.848e+02	2.780e+03	158.389 	7.140e+01	156.698		7.030e+02
p47 		1.021e+04+/-1.318e+04	7.250e+04	160.424 	1.830e+03	159.062		6.780e+03
p112		3.384e+03+/-4.824e+03	2.400e+04	160.274 	1.700e+02	158.948		8.970e+02
p310		7.687e+02+/-9.978e+02	3.410e+03	159.879 	2.510e+01	156.674		7.510e+01
p761		3.763e+02+/-5.473e+02	1.830e+03	159.177 	4.340e+00	156.681		1.530e+01
p1060		7.370e+01+/-1.031e+02	4.160e+02	159.243 	9.980e-01	156.677		4.920e+00
anisotropy	2.544e-01+/-2.706e-01	1.450e+00	158.746 	1.000e-02	156.757		1.400e-01

Hardness:
e38/e175	2.173e+01+/-3.908e+00	4.643e+01	159.417 	1.137e+01	158.295		1.750e+01
p47/p1060	5.386e+02+/-6.028e+02	5.815e+03	158.108 	5.944e+00	159.090		1.378e+03
p112/p1060	1.017e+02+/-9.353e+01	4.482e+02	160.424 	1.586e+00	159.059		1.823e+02
p310/p1060	1.310e+01+/-7.698e+00	4.068e+01	160.424 	1.281e+00	158.962		1.526e+01
p761/p1060	4.188e+00+/-1.420e+00	1.236e+01	158.917 	1.676e+00	158.990		3.110e+00

Steepest Rise
------------
	Time		Slope(in log per hr)
----------------------------------------
e1  	158.2951		37875.3000
e175	158.2986		1519.2256
p47 	158.0972		64163.2863
p112	160.2500		11119.1394
p310	159.4375		1978.0364
p761	159.0764		1635.0987
p1060	159.0764		289.0976
Two vertical red lines indicate the start and the end of the interruption. Purple hatched areas indicate that the satellite is in the radiation belt.
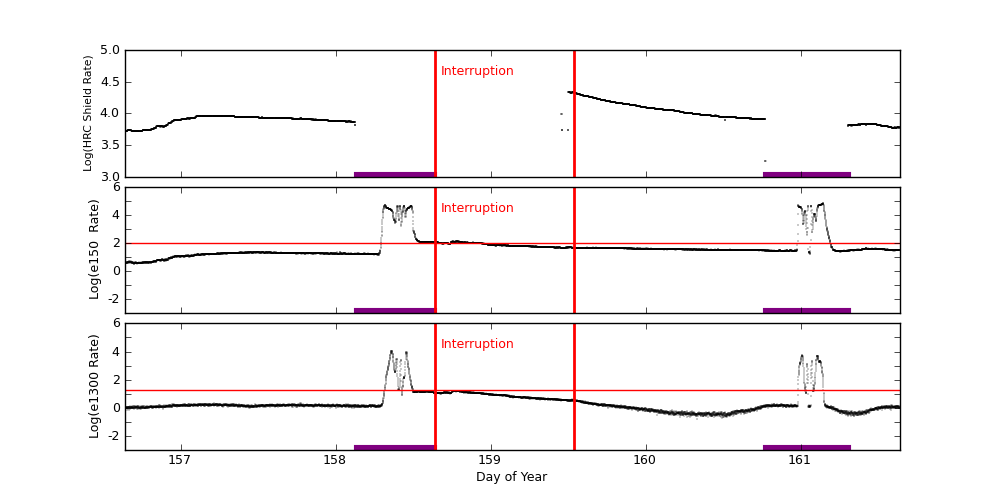
EPHIN Data are used to trigger science run interruptions. The trigger levels are:
| HRC Shield Rate | NA | |
| E150 | 100 | Counts/cm2 sec sr eV |
| E1300 | 20 | Counts/cm2 sec sr eV |
		Avg			Max		Time		Min		Time		Value at Interruption Started
--------------------------------------------------------------------------------------------------------------------------
hrc	hrc	9.150e+03 +/- 3.537e+03		2.168e+04	159.501		1.881e+02	159.449		NA
e150	1.742e+03 +/- 7.570e+03		6.447e+04	161.144		2.580e+00	156.499		1.134e+02
e1300	1.023e+02 +/- 6.982e+02		1.083e+04	158.361		1.563e-01	160.331		1.175e+01
Two vertical red lines indicate the start and the end of the interruption. Red horizontal lines indicate SCS 107 limits. Purple hatched areas indicate that the satellite is in the radiation belt.
GOES-15 data are taken from NOAA site (http://goes.ngdc.noaa.gov).
| P1 | .8 - 4.0 | MeV protons (Counts/cm2 sec sr MeV) Uncorrected |
| P2 | 4.0 - 9.0 | MeV protons (Counts/cm2 sec sr MeV) Uncorrected |
| P5 | 40.0 - 80.0 | MeV protons (Counts/cm2 sec sr MeV) Uncorrected |
		Avg			Max		Time		Min		Time		Value at Interruption Started
--------------------------------------------------------------------------------------------------------------------------
p1	5.070e+01 +/- 6.977e+01		3.440e+02	159.231		1.750e+00	156.656		9.860e+00
p2	2.433e+00 +/- 3.266e+00		1.690e+01	158.906		1.090e-01	156.750		4.180e+00
p5	6.672e-02 +/- 8.430e-02		4.620e-01	158.424		1.320e-02	156.663		2.390e-01
Two vertical red lines indicate the start and the end of the interruption. Red horizontal lines indicate SCS 107 limits. Purple hatched areas indicate that the satellite is in the radiation belt.
