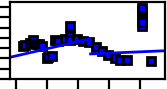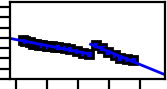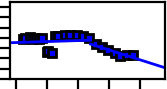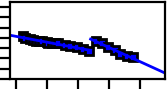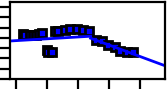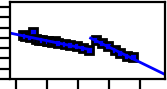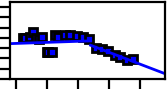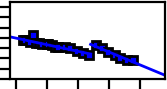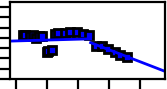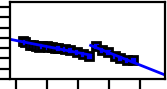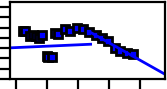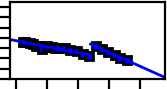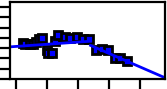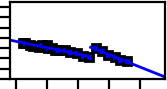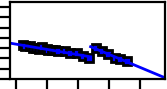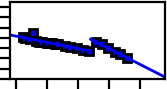
AR Lac is annually observed at the same 21 spots on Y/Z surface of HRC I and HRC S. Ths page presents the trends of Scaled SAMP and PI from year 2000 to the present.
Since AR Lac is a point source, the center part is defined as a 400 pixel radius area around the source position. The unit is counts/sec (the background counts is also that of the 400 pixel radius area and counts/sec/pix unit is used.)
The Scaled Sum Amp is defined by:
For the detail discussion about the Scaled Sum Amp, please see: Sumamps Gain Maps (J. Posson-Brown, V. Kashyap, 2009).
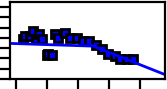
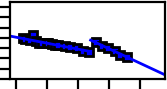
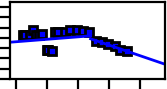
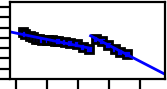
Since there is a discontinuity around year 2012 in Hrc S data, two lines are fitted before and after year 2012 for both Hrc I and Hrc S. In the tables below, the top value is the slope before year 2012, and the bottom one is that of after year 2012.
| Go to HRC I Sky Plot | Go to HRC I Det Plot | Go to HRC I Y/Z Offset Plane | Go to HRC I Table |
| Go to HRC S Sky Plot | Go to HRC S Det Plot | Go to HRC S Y/Z Offset Plane | Go to HRC S Table |
The following plot shows the locations of all observations in sky coordinates. The markers and the colors indicate the location of the observation in Y/Z offset sarface. If you hover the mouse over the marker, it will display the distribution of samp data.
If you like to see a detail, click the magnifier icon at the bottom left, and select the area you want to see. Then click the cross icon before hover the mouse. If you like to go back to the entier view, click the house icon.
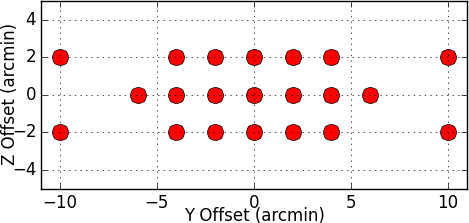
The following plot is similar to the above, but shows the locations of all observations in det coordinates.
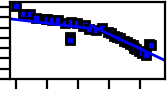
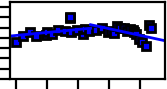
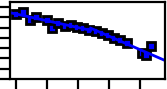
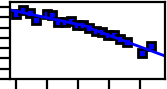
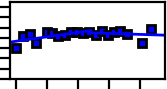
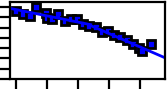
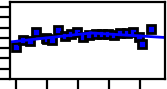
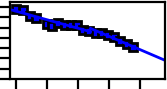
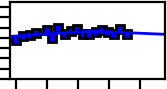
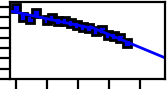
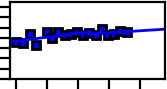
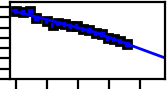
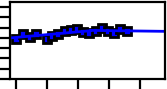
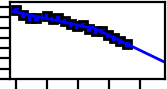
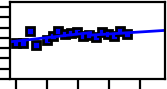
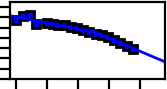
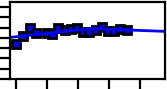
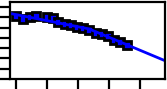
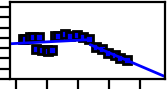
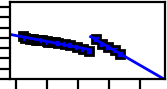
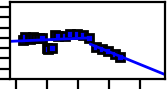
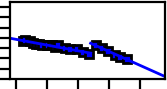
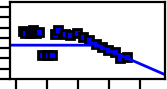
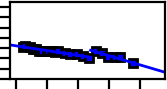
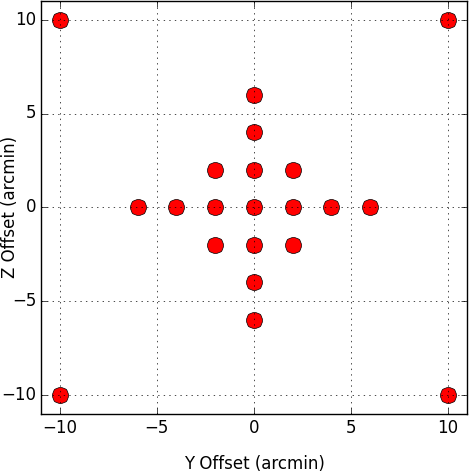
The following plot shows 21 Y/Z Offset coordinates which all observations fall in. If you click the marker on the location, it will open the trend page of the location. The left plot will open the scaled samp trend and the righ plot will open the PI trend page.
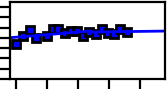
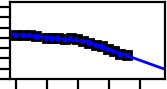
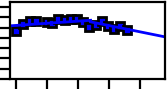
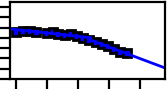
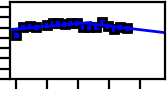
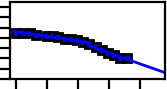
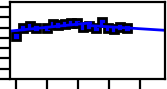
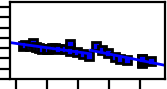
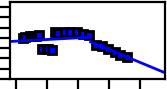
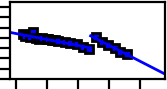
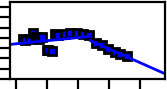
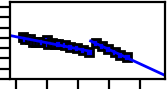
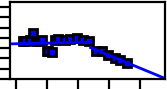
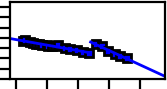
| Scaled Samp | PI |
|---|---|
|
|
|
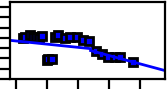
Or click a thumbnail plot in the table below to go to the trend page.
The following plot shows the locations of all observations in sky coordinates. The markers and the colors indicate the location of the observation in Y/Z offset sarface. If you hover the mouse over the marker, it will display the distribution of samp data.
If you like to see a detail, click the magnifier icon at the bottom left, and select the area you want to see. Then click the cross icon before hover the mouse. If you like to go back to the entier view, click the house icon.
The following plot is similar to the above, but shows the locations of all observations in det coordinates.
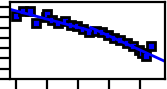
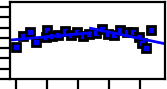
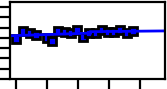
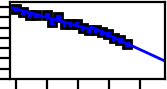
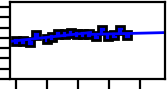
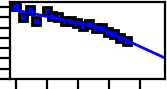
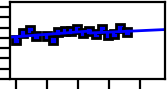
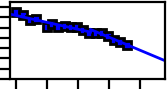
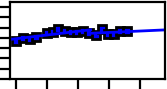
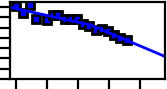
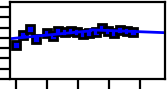
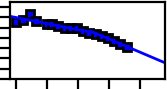
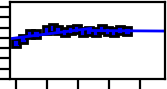
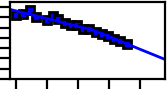
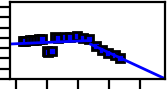
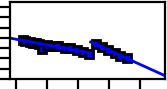
The following plot shows 21 Y/Z Offset coordinates which all observations fall in. If you click the marker on the location, it will open the trend page of the location. The left plot will open the scaled samp trend and the righ plot will open the PI trend page.
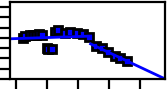
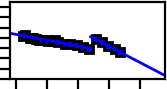
| Scaled Samp | PI |
|---|---|
 |
|
Or click a thumbnail plot in the table below to go to the trend page.
Last modified: Jul 18, 2025.
If you have any questions, please contact swolk@cfa.harvard.edu