

|
|
|
The most recent products are:
The following is a map of the relative QE response across the
detector. It is a 5x5 boxcar smoothed pixel-by-pixel median of six
normalized maps, each
made at a different energy band (individual energy maps and
more details of how this map was made are available). In this map,
a value of one means the QE is the same as in the on axis model.
HRC-I
| HRC-I Flat Field |
|---|
 Median Relative QE v1.1 (FITS file) |
An analysis of the results from the ground calibration at the XRCF is also available.
The nominal flat field map shown above suggests that at energies above approximately 183 eV, the quantum efficiency of the HRC-I is uniform across the detector to within +/- 10% peak to peak, independent of energy. However, observations of HZ 43 show that at +10 arcmin off-axis there is a significant deviation for the nominal QEU at energies below 200 eV. A memo describing a study of the QE uniformity of the HRC-I at low energies can be found here. This work was also the subject of a presentation at the Chandra Calibration Workshop in Nov 02.
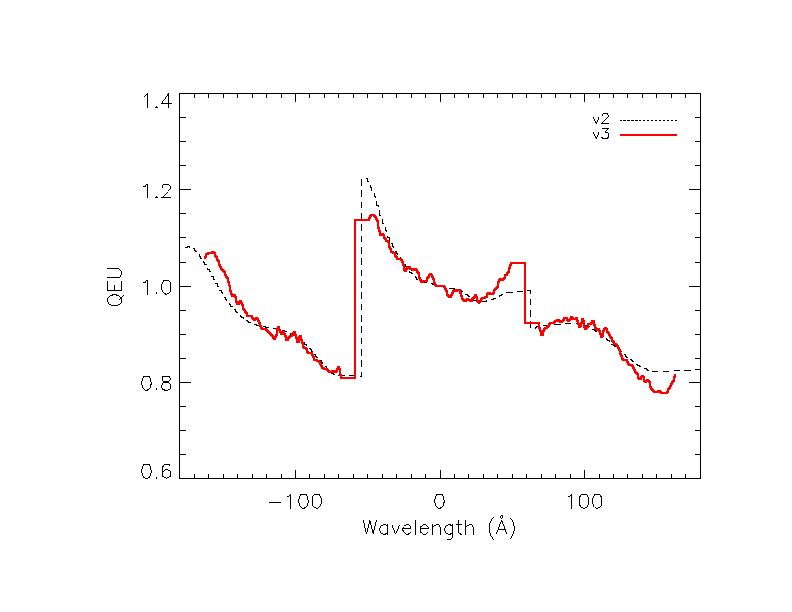
The HRC-S QE Uniformity map has complex structure due to the varying thicknesses of the HRC-S UV/ion shield. The UV/ion shield transmission is described by 4 different models. The regions defined by the UV/ion shield in combination with the 3 segments of the HRC-S lead to 8 regions required to describe the HRC-S QE Uniformity model. The QEU model is further compounded by the fact that the HRC-S QEU has energy dependence -- each of the 8 regions must be parameterized by 2 spatial dimensions and 1 energy dimension. Thus, the HRC-S QE Uniformity FITS file which comes with the CIAO CALDB (available here) contains all 8 data cubes -- QEU(x,y,E).
To illustrate the spatial structure of the HRC-S QE along the dispersion axis, we show below the modeled QEU for a rectangular strip located within the nominal extraction region of the LETG. This line is representative of a transection of the QEU data cube, for which wavelength is paired with LETG dispersion location unique to photon energy:
Comments to CxcCal@cfa.harvard.edu
Last modified: 09/27/12
|
The Chandra X-Ray
Center (CXC) is operated for NASA by the Smithsonian Astrophysical Observatory. 60 Garden Street, Cambridge, MA 02138 USA. Email: cxcweb@head.cfa.harvard.edu Smithsonian Institution, Copyright © 1998-2004. All rights reserved. |