HETG: 25 Years of Dispersion
H. M. Günther, Sean Gunderson, and Ioanna Psaradaki for the HETG team
Current status
The HETG continues to perform nominally with no signs of aging, and demand from proposers remains strong. For Cycle 25, 76 HETG observations of 18 unique targets are planned for a total of 1.8 Ms; 60 of those observations have been performed successfully as of May 2024. Furthermore, the first TOO observation of cycle 25—a bright stellar mass black hole in a windy state (Swift J1727.8-1613, PI: Miller)—was performed in October 2023.
HETG use over time
Up to now, the HETG has observed about 400 unique objects, many of them more than once. The exact number is a bit hard to count, as some HETG pointings are set with the aimpoint deliberately placed in empty space to get spectra from two (or more) sources in the field of view. In other cases, the HETG might look at separate targets in separate pointings so close to each other that they somewhat—but not entirely—overlap. Six objects have accumulated more than 1 Ms of HETG data, ranging from stars to galaxies: η Car, HD 37022 (also known as θ1 Ori C, the center of the Orion nebula cluster), NGC 3783, NHC 4041, Sgr A*, and SN 1987a. Sgr A*, in particular, has reached almost 3 Ms of exposure time. Over the life of the mission, the average length of an individual HETG observation has been decreasing as many HETG observations are broken up into different ObsIDs for scheduling reasons. However, for many sources it is their time variability that really makes them interesting, and repeat observations allow us to look into changes over time for a wide variety of sources with more than one ObsID.
You can teach an old dog new tricks
Over time, the HETG instrument team and Chandra observers have found new ways to learn more from HETG observations and use the instrument in creative ways to overcome limits on brightness, ACIS contamination, source confusion, and resolving power.
HETG/HRC
In the 2010’s, the contamination on ACIS increased so much that the HETG signal at wavelengths longer than 15 Å essentially disappeared; today even the Ne IX triplet (~12 Å, 1 keV) is difficult to observe. The HETG team thus experimented with using the HRC as a detector. As an added twist, we tested with HRC-I, not HRC-S, because of its lower background (for further details, see the HETG update in Issue 25). Unfortunately, the current temperature constraints that limit the use of the HRC mean that this option has not been used much in practice.
Crowded fields
Since the HETG is slitless, every source in the ACIS-S field with sufficient flux will cast its own HETG-characteristic X-shaped pattern on the CCDs. This makes reducing observations of complicated fields like supernova remnants or crowded regions like young stellar clusters challenging. In such fields, one must account for scenarios such as two sources’ dispersed spectra overlapping or a 0th order point source landing on a dispersed spectrum of interest (both of these scenarios can be seen in Figure 2). In some cases, the CCD energy resolution helps with order sorting; we know from the grating equation which wavelengths are expected at which detector positions. If we are lucky, the wavelengths of two crossing arms are sufficiently far apart that the ACIS CCD energy resolution can separate them. If not, we cannot discern which source contributes how many photons in the overlap region, and we need to exclude this part of the spectrum from spectral fitting. HETG team member D. Principe has developed software to work out geometric relations to identify and mask spectral overlap, which has been instrumental in observations of the Orion Nebula Cluster (ONC) to extract HETG spectra from the more than 40 sources in each of the ONC observations (Schulz et al. 2024).
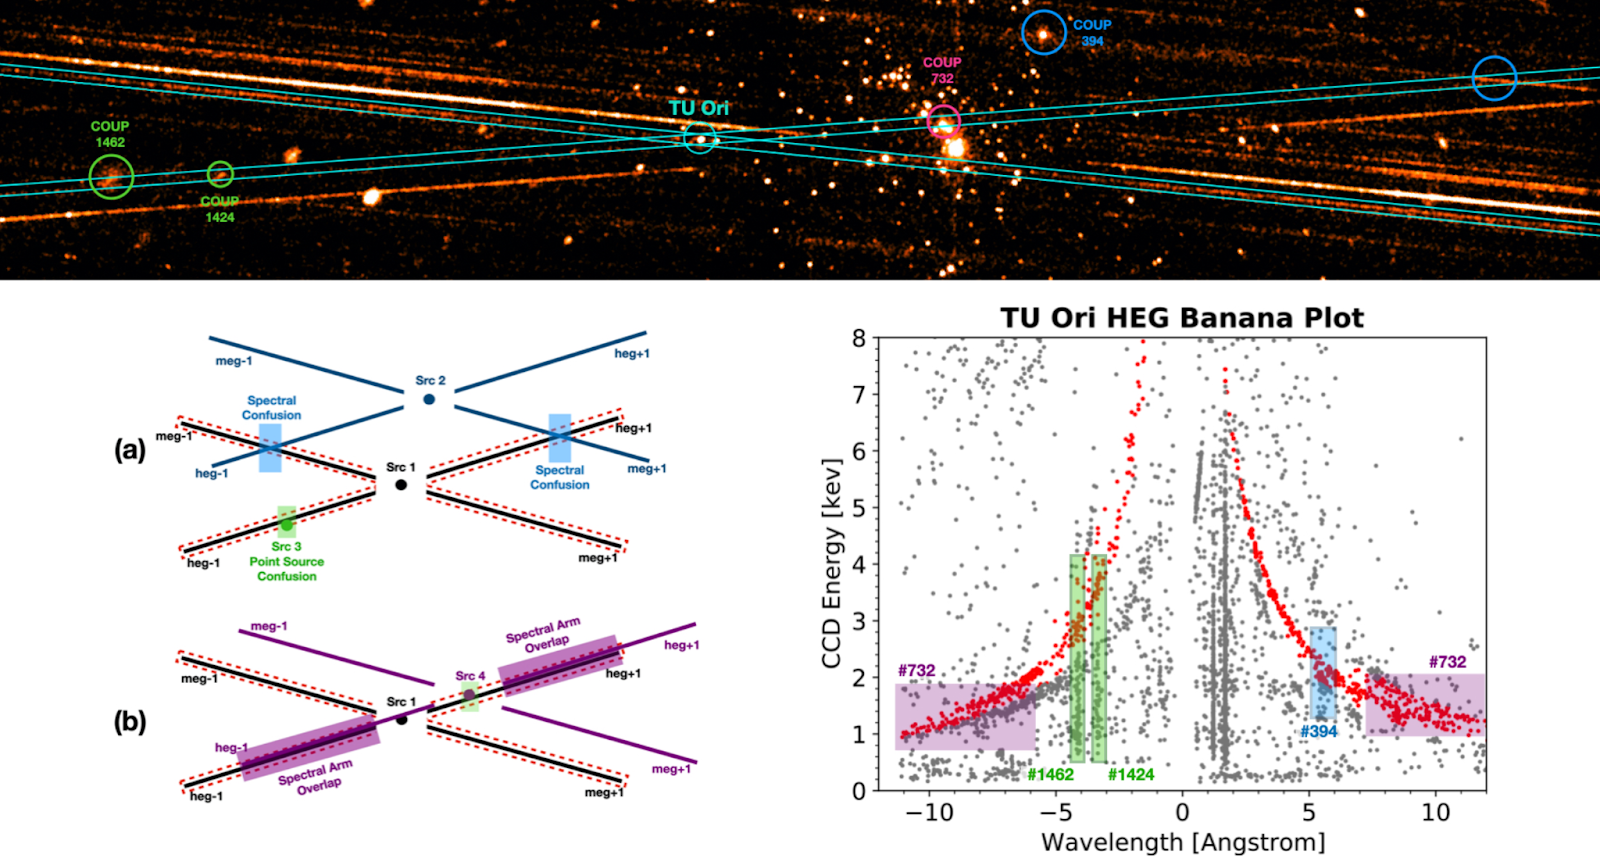
Figure 2: Top: An HETG observation of the star-forming Orion Nebula Cluster, a region with more than 1,600 pre-main sequence X-ray emitting stars. The dispersed spectrum of TU Ori is displayed (cyan rectangles) with sources of confusion highlighted with circles (green: point sources overlapping the HEG–1 arm; blue: an MEG arm from COUP 394 overlaps the HEG arm from TU Ori; magenta: COUP 732 is dispersed in the same direction as TU Ori and the entire spectral arm overlaps). Left: An illustration (not to scale) demonstrating (a) a point source (green) and a spectral arm (blue) confusing a small part of the target spectrum and (b) a situation where entire spectral arms overlap (magenta). The black X labeled Src 1 shows the arm locations for HEG and MEG for the target source, while the red dashed box encloses the extraction region. Right: ACIS order sorting banana plot showing confused events from different sources in the field erroneously being assigned to the spectra of TU Ori. Red dots indicate events that standard CIAO processing assigns to the extracted source (TU Ori) while other events, whose CCD-resolved energy do not match the expected wavelength of TU Ori, are not included in the standard CIAO source extraction. Colored numbers represent the COUP number of the source causing confusion for this case. Examples where standard CIAO processing has the potential to erroneously include events from other sources in the extracted spectrum of TU Ori are shown as red dots within the colored boxes. This figure is from Schulz et al. (2024).
Sometimes less is more
For bright sources, Continuous Clocking (CC) Mode can reduce the impacts of pileup, but it comes at the cost of requiring extra care in separating MEG and HEG spectra. Yet even in CC Mode, stellar mass black holes in outburst can be so bright that they saturate the telemetry. V404 Cygni in outburst is one such source (King et al. 2005); to mitigate both problems, the source was placed just at the edge of ACIS-S so that only two arms (one MEG and one HEG arm) fall on the ACIS-S chips. Nevertheless, telemetry saturation still led to chips dropping out during the observation. The same strategy has been employed for more recent observations of very bright sources.
Higher diffraction orders
When sources are bright, observers can also look at higher diffraction orders. Because those higher orders are located further away from the zeroth order, they offer a better spectral resolving power. Suryanarayanan et al. (2022) analyzed the Fe K spectrum of Cygnus X-3, a high mass binary; they aimed to separate a plethora of separate Fe lines, which they interpret as resonantly scattered emission from inner shells. While the interpretation is complicated—as is appropriate for such a complicated binary system—it does show the value of pushing to better spectral resolution, which we can do by using the higher orders of the HETG.
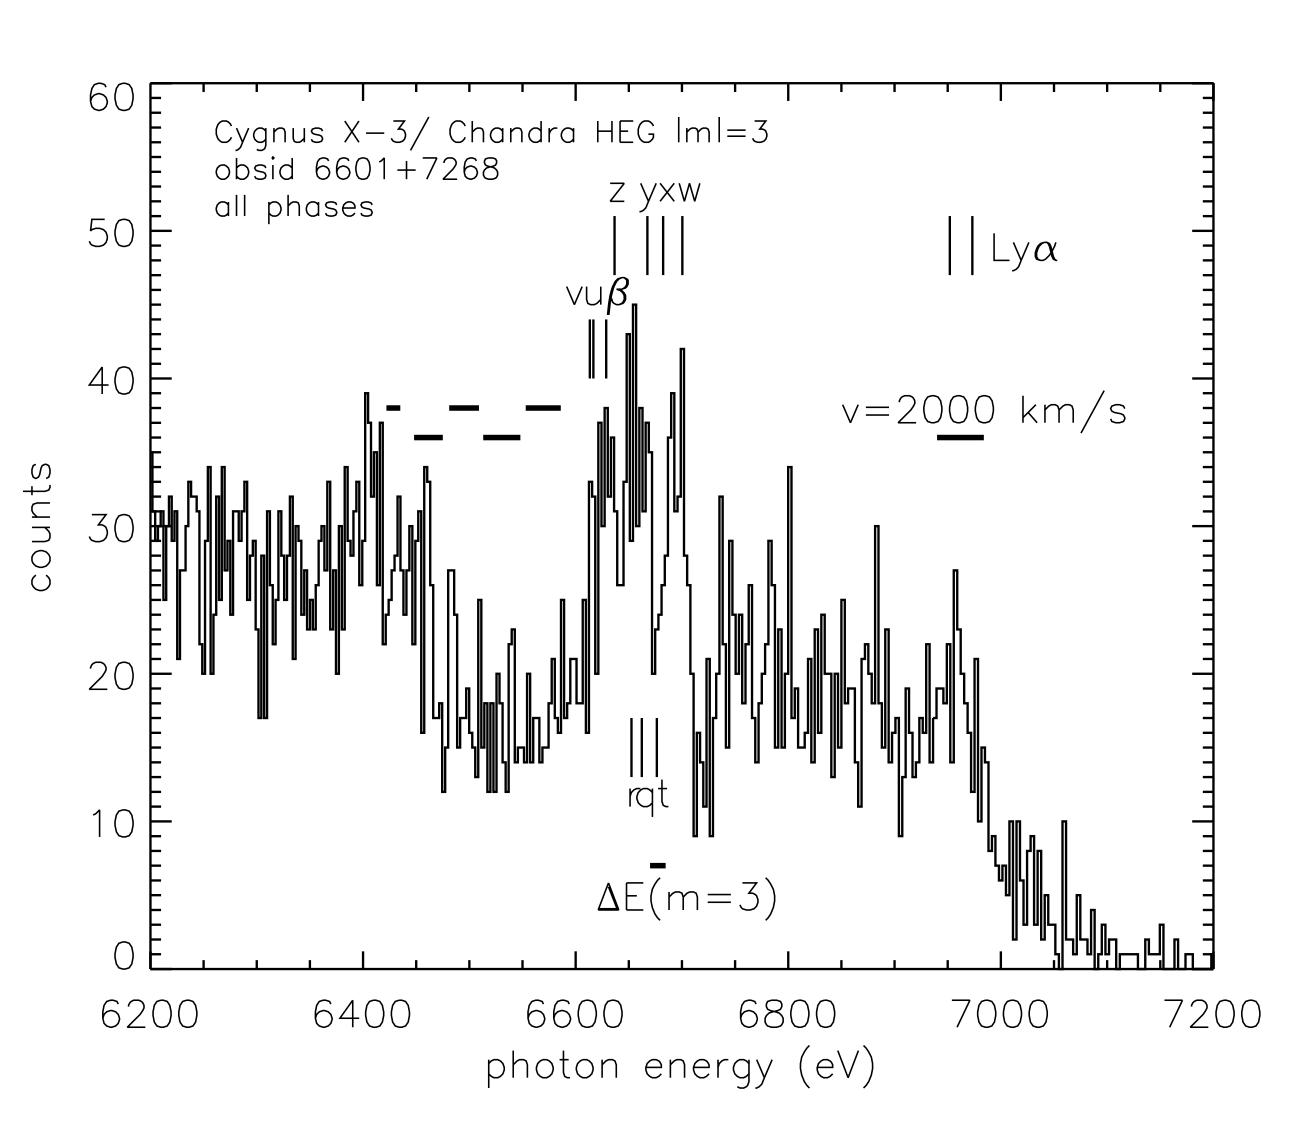
Figure 3: Third-order HETG spectrum from Cygnus X-3. The approximate resolution of 15 eV at 6.7 keV is indicated, as are the position of several spectral features. This figure is from Suryanarayanan et al. (2022).
What have we learned in 25 years of grating observations?
Chandra/HETG data has been used in about 1200 refereed papers so far, and it is impossible to review the breadth and depth of all fields studied in a single newsletter article. Nevertheless, in addition to star-forming regions and galactic binaries discussed above, we want to highlight just a few examples that have seen consistent interest in the last 25 years and show how far we have come.
Capella and stellar coronae
The chromospherically active binary star Capella has been observed regularly since the launch of Chandra because it is used as a calibration source for the HETG and LETG. It can also serve here as a prime example of how much we’ve learned about stellar coronae in the past two and a half decades of grating observations. In the early days, observers were overwhelmed with the wealth of emission lines suddenly available to them and quickly started to use them to benchmark and improve the atomic data for the complex Fe lines in the Capella spectrum (Behar et al. 2001). Before Chandra, coronae were described with two or three plasma temperature components at best, but with the HETG—as well as Chandra/LETG and XMM/RGS—it was suddenly possible to determine detailed distributions of temperatures from the large number of separate emission lines (Gu et al. 2006).
As the archive grew over time, studies of temporal variability became possible. With the exceptional calibrations and spectral resolving power, such studies for Capella also included measuring the change in line position over time. Combining measured line shifts with known orbits of the Capella components shows that the X-ray emission is dominated by the G8 III giant while the hotter G1III seems to be much fainter in X-rays (Ishibashi et al. 2006). Studies of line kinematics (e.g., Bozzo et al. 2023) as well as the work on Fe emission line benchmarking (see Gu et al. 2022 for a recent example) continue to this day.
Massive stars
Over the last 25 years, Chandra's HETG has deepened our understanding of the winds of O, B, and Wolf–Rayet stars. The first observations of O stars confirmed that X-rays are produced by shocks distributed through the wind (Waldron & Cassinelli 2001; Cassinelli et al. 2001). Later observations were then used to calculate clumping-independent mass-loss rates, which were found to be up to an order of magnitude less than those calculated from theory and using longer wavelengths (Cohen et al. 2014). The wealth of observations made with the HETG on these hot stars has also brought into context the similarities in the shock generation between these stars (Cohen et al. 2014; Gayley 2016)
More recently, dielectronic satellite lines were found for the first time in a hot star’s X-ray spectra (Gunderson et al. 2023), although almost 1 Ms of observation time on ζ Puppis was needed to see them. These lines can be used to probe the plasma conditions of the shocks while staying independent of elemental abundances. Gunderson et al. (2023) used the dependence of these lines on the temperature distribution to test the assumption that hot star wind shocks reach collisional ionization equilibrium. Their test confirmed collisional ionization equilibrium as the valid plasma state, opening new spectral analysis avenues in other hot stars.
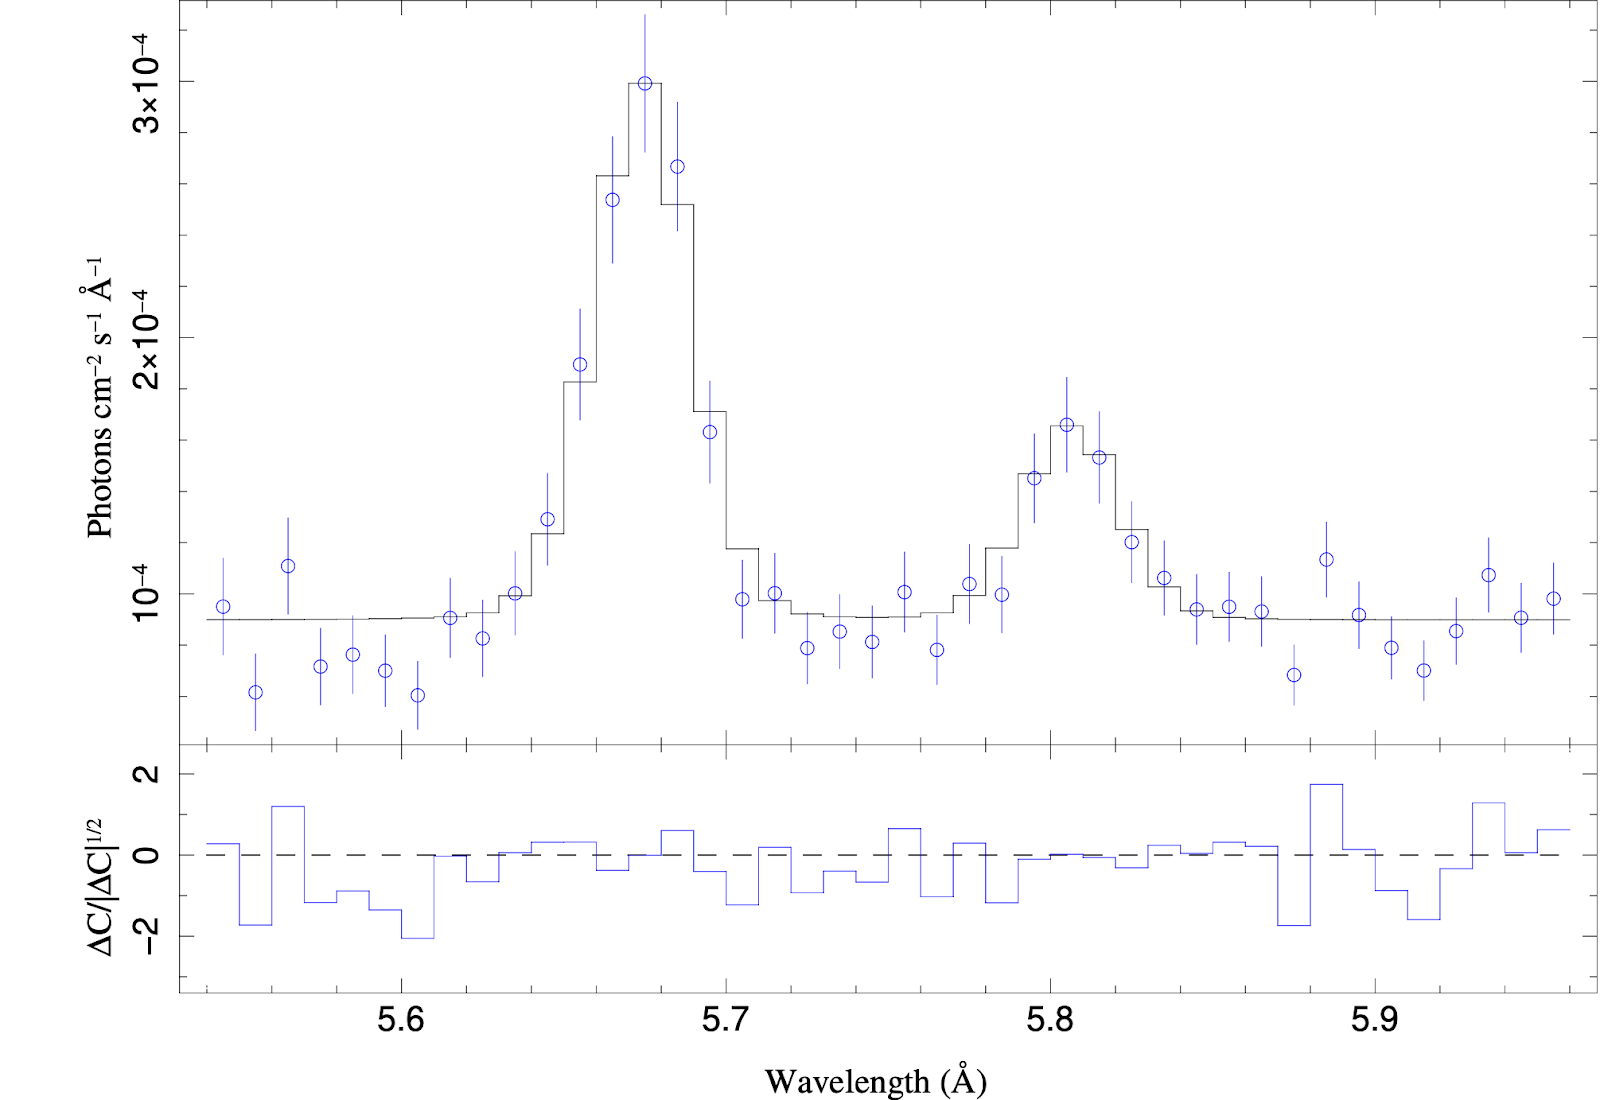
Figure 4: Si XIII He Lyman Β and associated DR satellite line in the HEG+MEG spectrum of ζ Puppis. A two Gaussian model fit is applied to the data, which consist of 813 ks of observations from Cycle 19. This figure, which is from Gunderson et al. (2023), shows HEG+MEG data plotted on the MEG grid.
Dust in the universe
Over the last 25 years, using measurements of absorption of X-rays from bright sources the high-resolution X-ray spectrometers aboard Chandra have yielded remarkable findings in the study of the interstellar medium and dust mineralogy. During the early years of Chandra's operation, numerous studies explored X-ray photoabsorption edges and features arising from the ISM in the Milky Way. Schulz et al. (2002) examined the first high-resolution X-ray spectrum of Cygnus X-2 with HETGS, focusing on the structure of the O K, Ne K, Mg K, and Si K edges. Later, Juett et al. (2004) conducted a detailed examination of the oxygen K-shell interstellar absorption edge in seven X-ray binaries, identifying various absorption lines from neutral, singly ionized, and doubly ionized oxygen. Lee et al. (2002) reported the detection of the first astrophysical signature of X-ray absorption fine structure in the photoelectric edge of Si, which was attributed to material in dust grains. Finally, Ueda et al. (2005) studied the ISM towards three Galactic X-ray binaries—GX 13+1, GX 5-1, and GX 340+0—detecting X-ray Absorption Fine Structures (XAFS) of dust around the Si K-edge. These studies paved the way for studies on dust grain chemistry using the X-ray band.
In more recent years with Chandra a plethora of studies have focused on X-ray binaries, with an emphasis on exploring the chemical enrichment of our Galaxy. Costantini et al. (2012) investigated the joint Chandra and XMM-Newton high-resolution X-ray spectrum of 4U 1820-30 in the O K and Fe L edges, utilizing dust grain models to find slight over- and under-abundances of oxygen and iron, respectively. Additionally, studies by Zeegers et al (2019), Rogantini et al. (2019), and Psaradaki et al. (2023) analyzed the Si K, Mg K, and Fe L edges in HETGS spectra of various X-ray sources along the Galactic plane, employing an up-to-date dust extinction model computed from laboratory data. These authors revealed insights into the chemistry, crystallinity, and size distribution of dust grains in both dense and diffuse regions of the ISM, highlighting the efficacy of high-resolution X-ray spectroscopy in studying interstellar dust mineralogy.
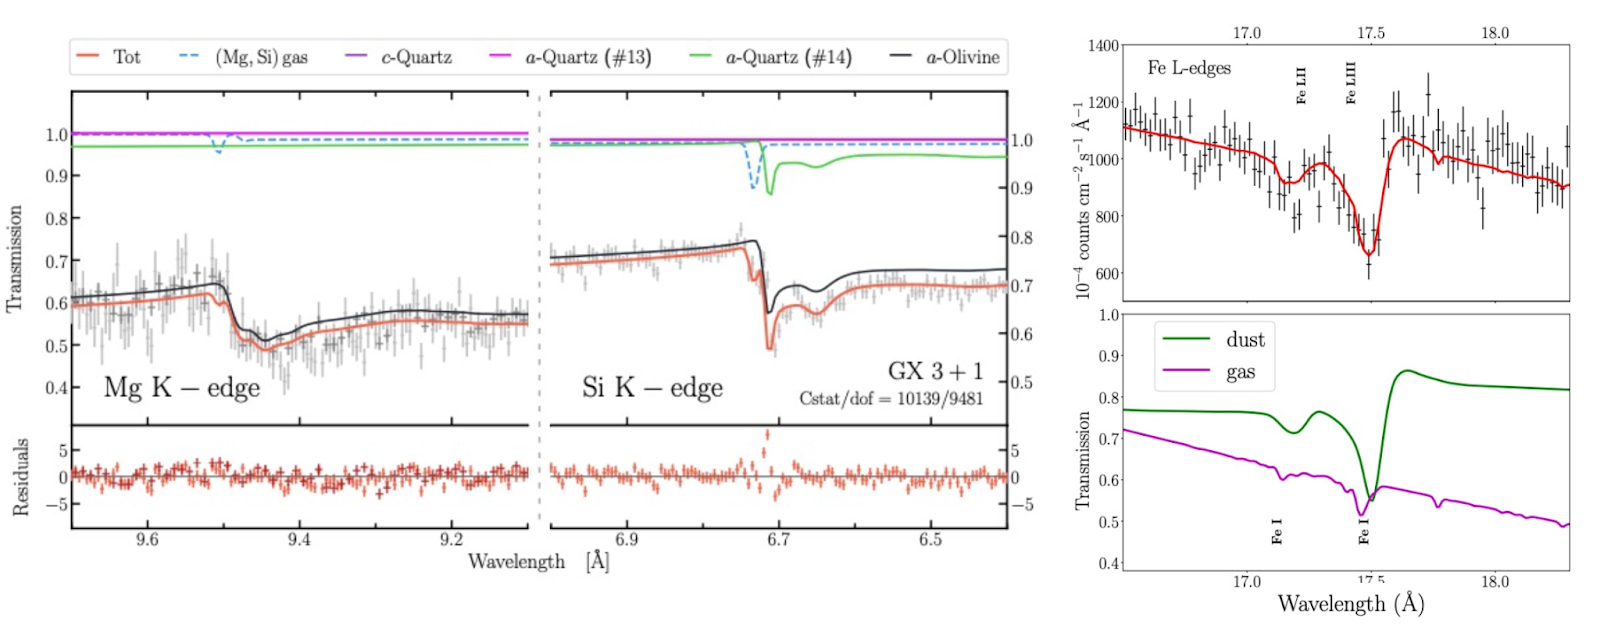
Figure 5: Left: Chandra/HETGS data and best fit in the Mg K and Si K-edges from Rogantini et al. (2020). Right: Best fit in the O K and Fe L-edges for SWIFT J1910.2–0546 and the relative transmission for the gas and dust components (Psaradaki et al. 2023).
Look into the future
The HETG has performed exceptionally well over the last 25 years with only one small hiccup: a few years ago there was a small scare about the grating insertion mechanism, which, by folding the HETG in and out behind the mirrors, enables Chandra observers to observe with or without the HETG. For a few weeks it seemed that the gratings assembly was not moving enough, but engineers quickly traced that back to be a minor problem with a sensor that measures rotation—the rotation itself is fine. Otherwise, the gratings are stable in space and the facets and holders are not bothered by radiation or increasing temperatures on Chandra. There is nothing that prevents the HETG from operating exceptionally well for the next 25 years, so long as the rest of the satellite stays up and running. In particular, the HETG can deal just fine with increased focal plane temperatures; since the wavelength solution comes from the grating equation and not the CCD resolution, HETG observations can be done at higher focal plane temperatures than imaging observations. This provides better flexibility and observing efficiency for scheduling observations.

Figure 6: Reactive Ion etch plasma tool at MIT’s Space nanotechnology laboratory (ca. 1995).
All that glitters
Yet, as they say, “Nach dem Spiel ist vor dem Spiel ” (after the game is before the game). While the HETG is quietly and efficiently working in orbit, the team that invented and built the grating facets for the HETG has been hard at work back on Earth to improve their technology and invent the next big thing: critical angle transmission (CAT) gratings. Those grating bars are etched from silicon wafers (the HETG uses gold) at very high aspect ratios. CAT gratings are mounted such that X-rays hit the grating bar sidewalls at a small incidence angle and “bounce off” to one side. That geometry diffracts most rays into high orders on one side. CAT gratings can reach a resolving power > 10,000 and efficiencies > 20% in the soft X-rays (Heilmann et al. 2022).
These gratings will be used in the upcoming RedSOX rocket mission (an under construction X-ray polarimetry mission with 5 minutes of flight time) and are planned for the proposed Arcus probe mission and Lynx flagship mission to power a worthy successor of the HETG. However, even in the best of cases, these won’t launch any time soon—so long live the HETG!
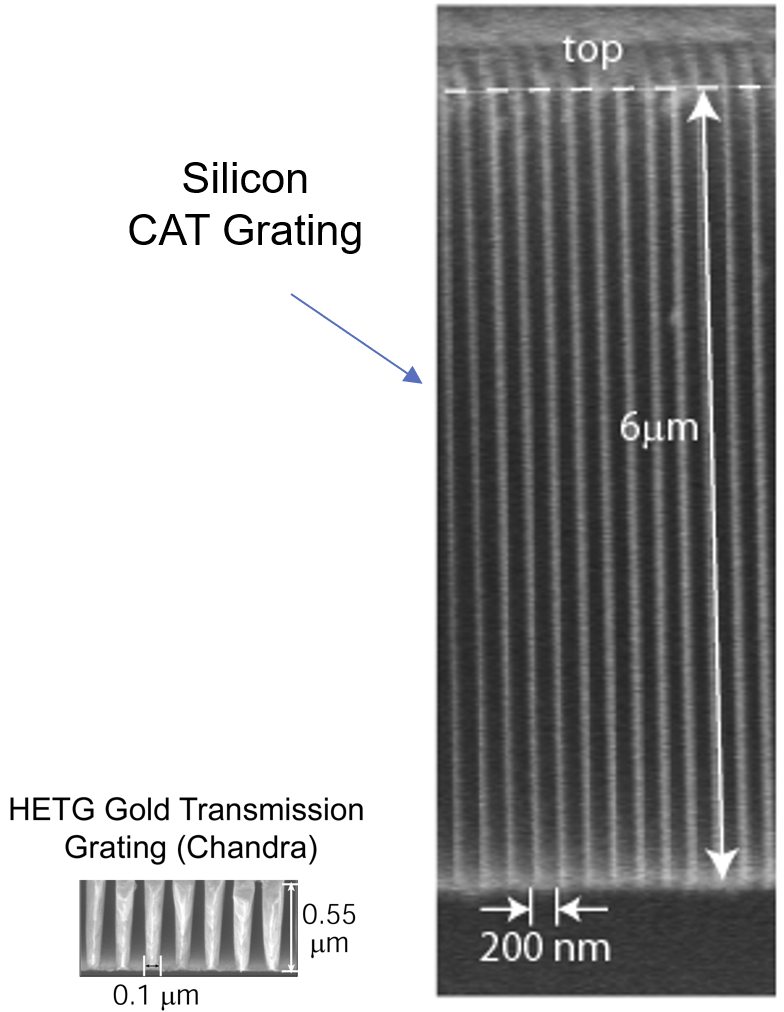
Figure 7: Scanning electron microscope images of cleaved cross sections of a Chandra/HETG grating on the left and a modern CAT grating on the right (MIT Space Nanotechnology Laboratory). Note the high aspect ratio and smooth surfaces of the CAT gratings, made possible through continuous improvement of the processes that were used to make the HETG gratings.
References
- Behar, E., Sako, M., & Kahn, S. M. 2001, ApJ, 563, 497.
- Bozzo, E., Huenemoerder, D. P., Produit, N., et al. 2023, MNRAS, 522, L66.
- Cassinelli, J. P., Miller, N. A., Waldron, W. L., MacFarlane, J. J., & Cohen, D. H. 2001, ApJL, 554, L55.
- Cohen, D. H., Li, Z., Gayley, K. G., et al. 2014, MNRAS, 444, 3729.
- Costantini, E., Pinto, C., Kaastra, J. S., et al. 2012, A&A, 539, A32.
- Gayley, K. G. 2016, AdSpR, 58, 719.
- Gu, L., Shah, C., Mao, J., et al. 2022, A&A, 664, A62.
- Gu, M. F., Gupta, R., Peterson, J. R., Sako, M., & Kahn, S. M. 2006, ApJ, 649, 979.
- Gunderson, S. J., Gayley, K. G., & Huenemoerder, D. P. 2023, MNRAS, 522, 2739.
- Günther, H. M. 2018, ChNew, 25, 14.
- Heilmann, R. K., Bruccoleri, A. R., Burwitz, V., et al. 2022, ApJ, 934, 171.
- Ishibashi, K., Dewey, D., Huenemoerder, D. P., & Testa, P. 2006, ApJL, 644, L117.
- Juett, A. M., Schulz, N. S., & Chakrabarty, D. 2004, ApJ, 612, 308.
- King, A. L., Miller, J. M., Raymond, J., Reynolds, M. T., & Morningstar, W. 2015, ApJL, 813, L37.
- Lee, J. C., Reynolds, C. S., Remillard, R., et al. 2002, ApJ, 567, 1102.
- Psaradaki, I., Costantini, E., Rogantini, D., et al. 2023, A&A, 670, A30.
- Rogantini, D., Costantini, E., Zeegers, S. T., et al. 2020, A&A, 641, A149.
- Schulz, N. S., Cui, W., Canizares, C. R., et al. 2002, ApJ, 565, 1141.
- Schulz, N. S., Huenemoerder, D. P., Principe, D. A., et al. 2024, arXiv, arXiv:2404.19676.
- Suryanarayanan, A., Paerels, F., & Leutenegger, M. 2022, arXiv, arXiv:2212.04165.
- Ueda, Y., Mitsuda, K., Murakami, H., & Matsushita, K. 2005, ApJ, 620, 274.
- Waldron, W. L., & Cassinelli, J. P. 2001, ApJL, 548, L45.
- Zeegers, S. T., Costantini, E., Rogantini, D., et al. 2019, A&A, 627, A16.