Cycle 27 Peer Review
Rodolfo Montez Jr. and the Chandra Director’s Office
This year's annual Call for Proposals, released on December 19, 2024, featured significant changes to the review procedure. Instead of holding a review of up to 100 reviewers in 13 topical panels, all proposals were subject to a distributed peer review. In Chandra's distributed peer review (DPR), all proposing teams were asked to nominate a designated reviewer (DR) who would be responsible for reviewing up to 16 proposals via the CXC's new Chandra Distributed Review Software (CDRS). TOO, Large, and Very Large proposals underwent panel review in two TOO panels and one big project panel, in addition to the DPR review. As a result, 233 DRs participated in the review and 24 panelists in the panel review. A total of 299 proposals were submitted to the Cycle 27 CfP requesting over 66 Ms of observing time and resulting in an oversubscription factor of 5x by time. One additional change to the Call for Proposals was the lack of Archive and Theory proposals in the solicitation, which typically contribute 75–100 additional proposals in any given cycle.
General Cycle 27 Proposal Statistics
Cycle 27 proposal statistics can be found in Figures 1–3 and on the CXC website.
The total amount of time allocated in Cycle 27 was 14.6 Ms. Of that, 3.4 Ms were awarded to 7 LPs and 2 Ms were awarded to 2 Very Large Proposals (VLPs), a category of proposal requiring at least 1 Ms of observing time.
The Cycle 28 Call for Proposals (CfP) will be released on December 18, 2025 and the proposal deadline is March 18, 2026.
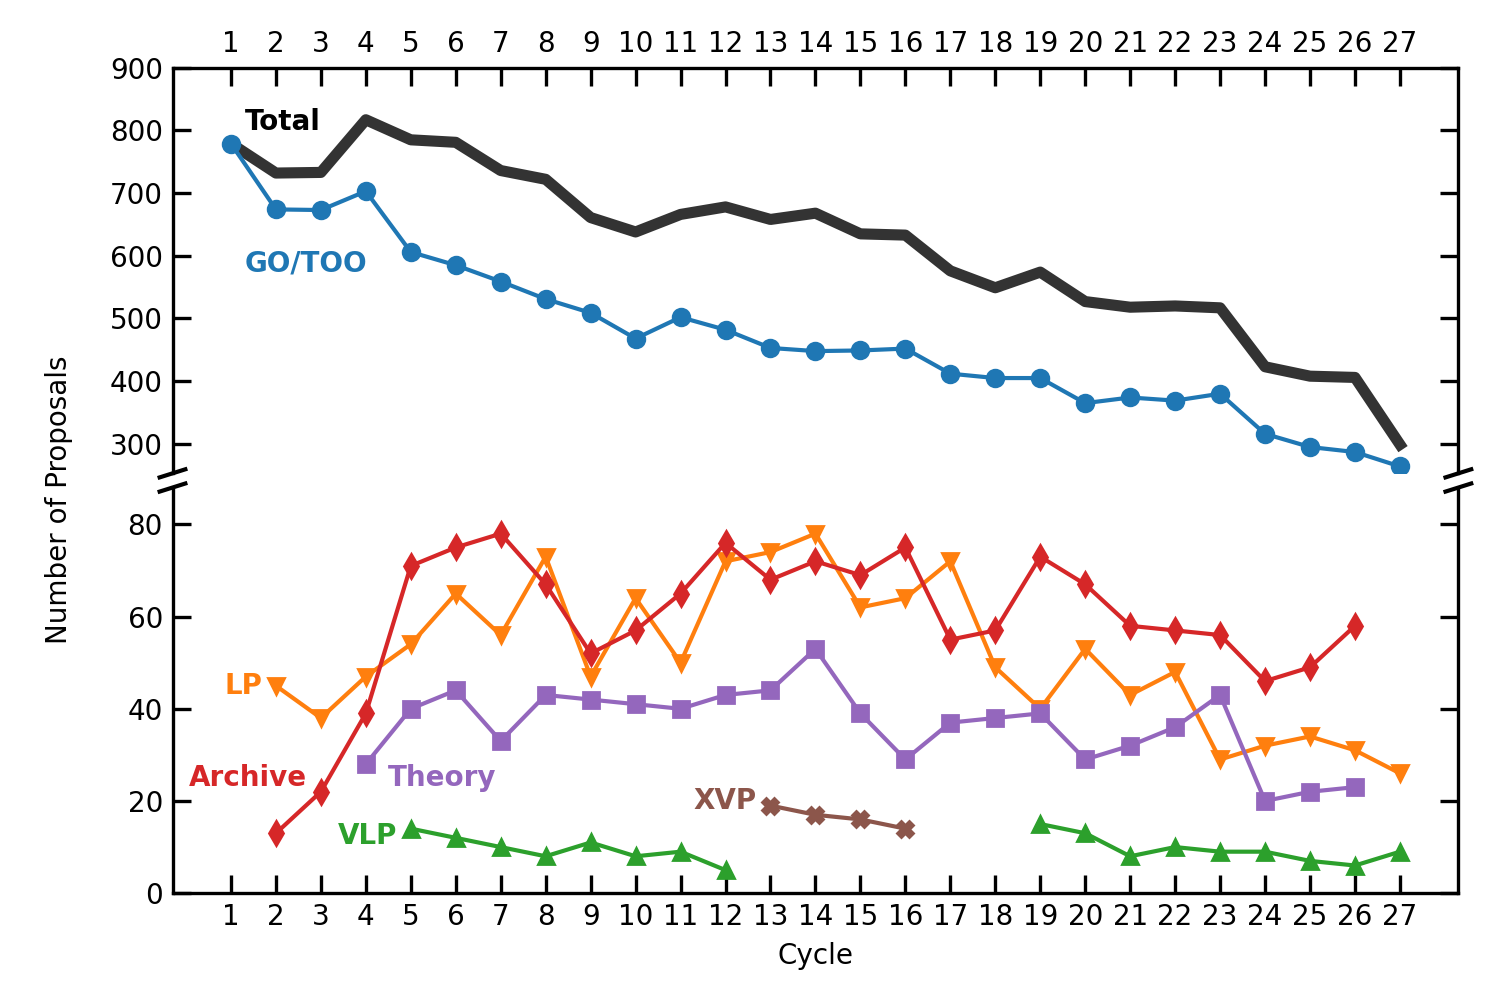
Figure 1: The number of proposals submitted in each proposal category (e.g., GO, LP, Archive) as a function of cycle. The y-axis is broken to indicate the entire range. Since more proposal categories have become available in each cycle, the number classified as GO has decreased as others increased, while Cycle 27 did not include Archive or Theory proposals.
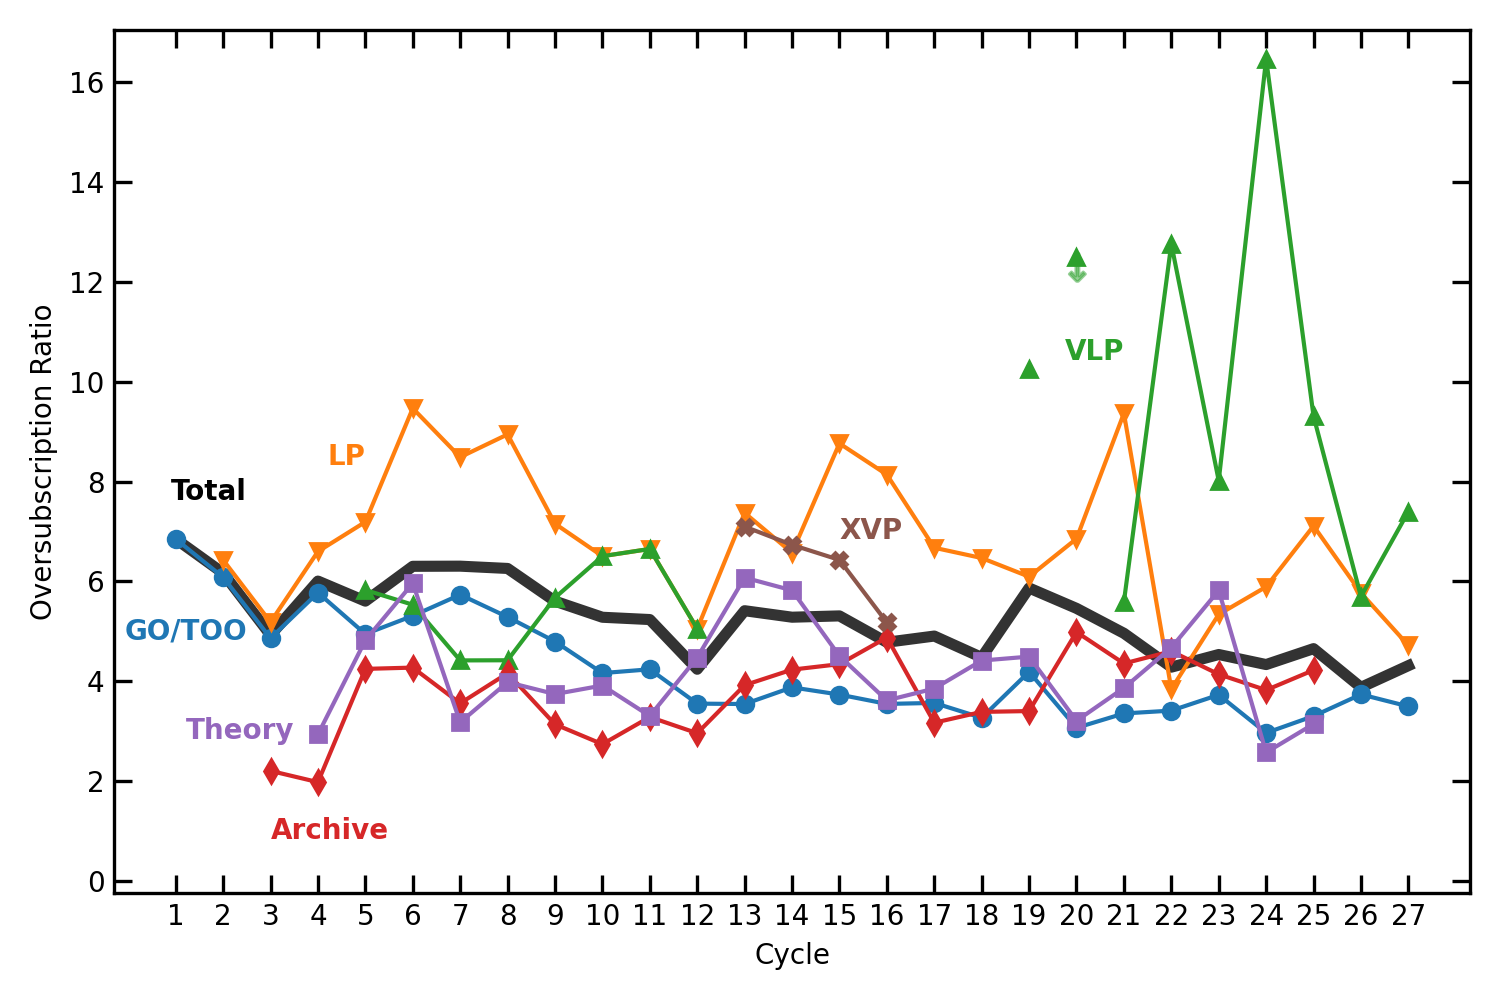
Figure 2: The effective oversubscription ratio (in terms of observing time or money available) for each proposal category as a function of cycle. Total oversubscription ratio is shown as the black solid line. Note that some of the fluctuations are due to small number statistics (e.g., Theory proposals).
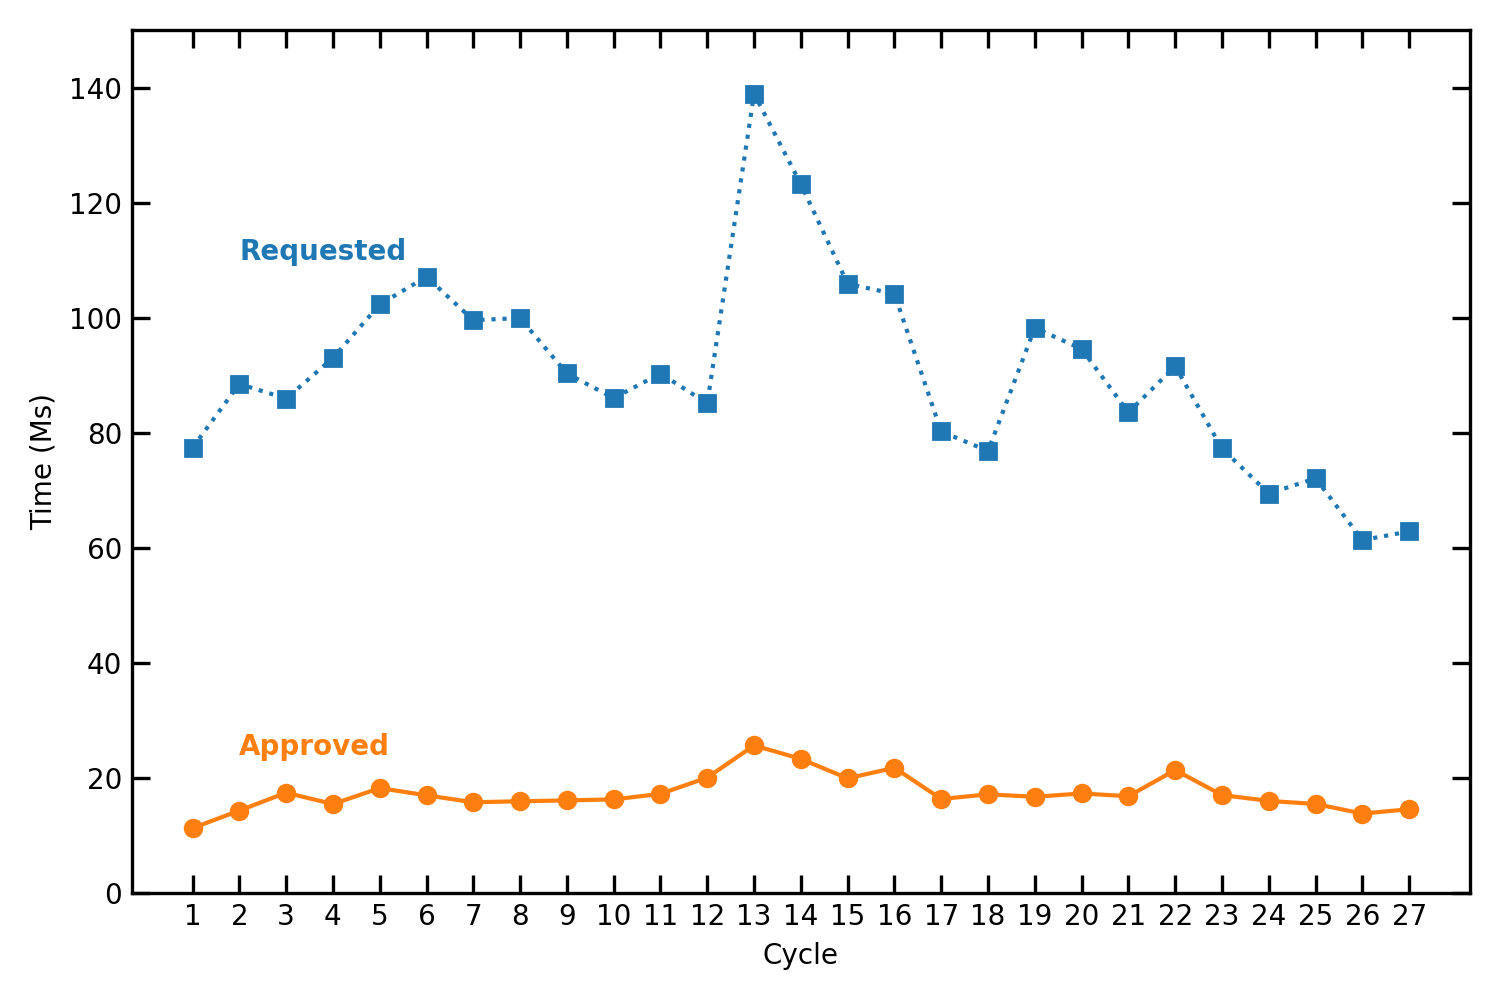
Figure 3: The requested and approved time as a function of cycle in Ms including allowance for the probability of triggering each TOO. The available time increased both over the first three cycles and in Cycle 5 with the introduction of Very Large Projects (VLPs). A clear spike in the requested time is seen in Cycles 13–16 in response to the calls for X-ray Visionary Projects (XVPs). Additional increases in awarded time are due to the increases in observing efficiency.