
The ends of each of the three HRC-S segments are regions of high event density. The current CALDB badpix map excludes data from three of the six plate ends because the CsI photocathode coating doesn't extend that far, but Level 2 event files include data from the other three plate ends on the grounds that these data might somehow be useful, e.g., with careful background subtraction. In practice, however, Chandra observers always discard or ignore these data.
This analysis aims to determine whether the plate-edge data
have any practical use. The conclusion is that they do not, because
of degraded event position accuracy and/or anomalous
pulse height and other data. Suggestions for badpix modifications
are provided.
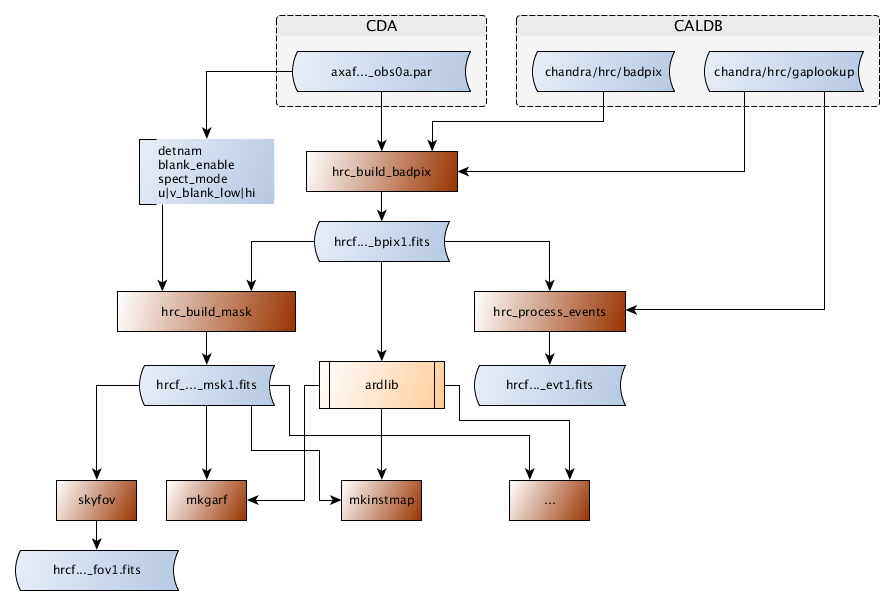
The badpix file (current version from Aug 2004 in $CALDB/data/chandra/hrc/badpix/hrcsD1999-07-22badpixN0003.fits) lists detector regions, in RAW coordinates, that contain bad data because of hotspots, lack of CsI photocathode coating, or other issues. A few small regions only apply after certain dates. hrc_build_badpix uses the badpix file to make an observation-specific bpix (hrcf*bpix.fits) file in degapped CHIP coordinates that accounts for any time-dependent badpix regions. The bpix file is used by hrc_process_events to set bit 17 in the status field. Status-bit filtering, along with GTI filtering, is used when creating evt2 files.
The bpix file is also used by hrc_build_mask
(not part of standard CIAO; only in internal DS release)
to create a mask file (hrcf*_msk1.fits) which is used by
skyfov to create the hrcf*fov1.fits field-of-view file.
The msk file is also required by mkarf/mkgarf (and the
mktgresp script containing mkgarf) in cases
where the HRC-S is run in a windowed configuration
such as the standard 6-tap-wide spectroscopy configuration
or for NIL-mode observations,
and by mkinstmap, which is a step required to make exposure maps.
Data for this work come from two sources: a merged set of 48 HRC-S observations
ranging from 100 ks to 200 ks long, and a set of 14 off-axis HZ43
observations that place the source near the gaps between plates.
To keep the file size manageable, only events near the plate gaps
were included in the merged data.
(3 of the 48 observations were collected soon after the
2012
high voltage change so gain calibration should still be fine.)
The merged data are dominated by
background events from charged particles (cosmic rays, internal radioactivity,
solar protons, etc.), although dispersed spectra can be seen in some areas.
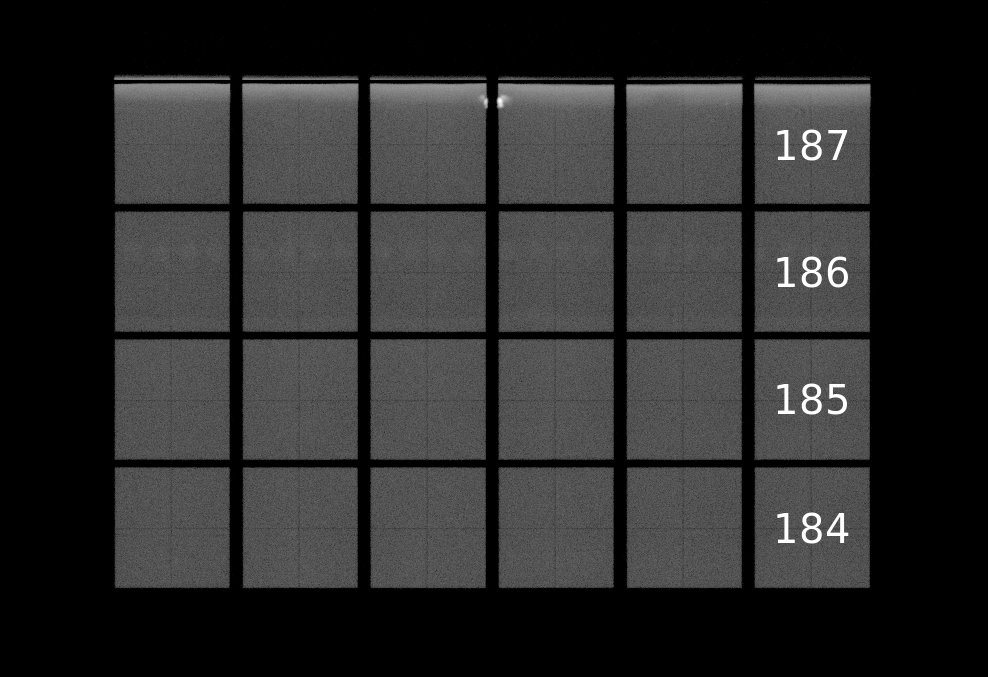
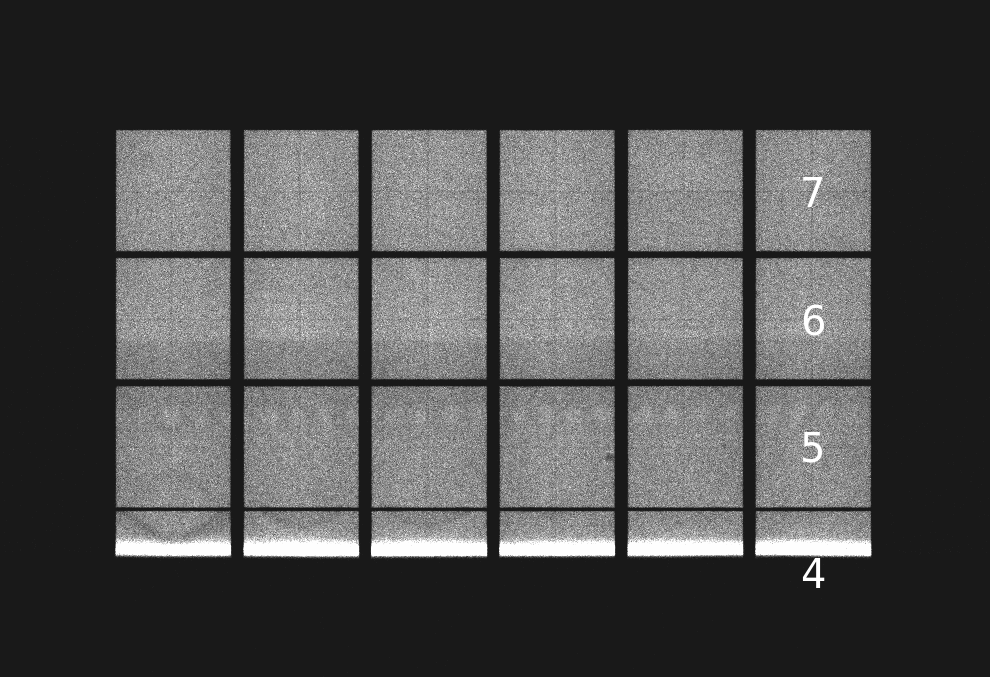
Fig. 1 also shows a RAW image of the evt2 data, along with an overlay of
the outer boundaries of the standard LETG/HRC-S background extraction regions,
which are together 10 times as wide as the spectral extraction region.
This illustrates that the spectral background regions cover several taps
in the cross dispersion (RAWX, CRSU) direction, so background nonuniformity
on tap scales matters for background subtraction.

|

|
| Figure 1:
(Top) Plate layout in RAW coordinates (only showing data near plate ends),
with green square denoting dithered 0th order.
(Bottom) Green lines mark limits of LETG/HRC-S spectrum background regions. Dither adds another 304 pixels (1.2 taps). Total data extraction region width is a little less than 3 taps at the plate gaps and about 5 taps at the outer ends. |
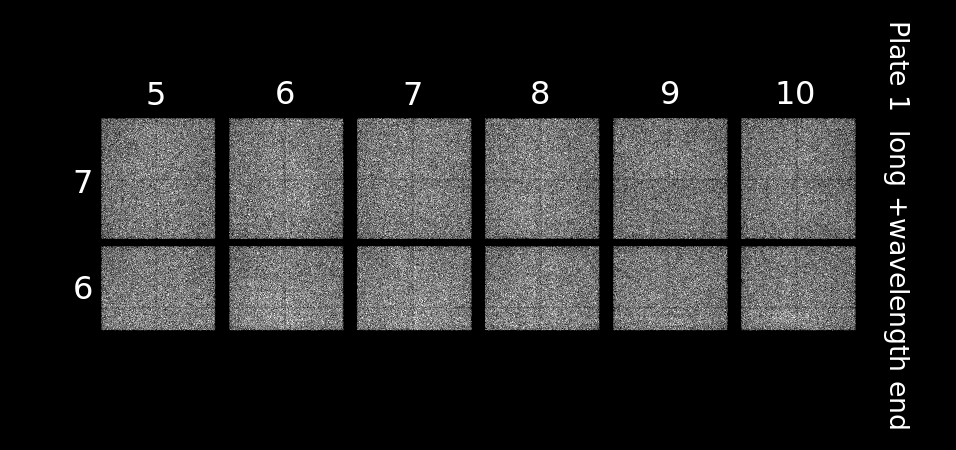
Figs. 2 and 3 show, respectively, images of the HZ43 data in SKY
and RAW coordinates. Most of the 14 observations were about 1.3 ks long,
covering a little more than one full dither cycle; ObsID 15451 was
only 1.0 ks.
Most observations have ~150,000 cts in the source;
ObsID 15453 straddled one plate gap and ObsIDs 15459 and 15460 dithered
into the other.
Telemetry was almost always saturated and background
generally contributes <0.1% of the events in the source
regions. Note that the source rate is higher than on-axis because
the Al coating on the UV/ion shield varies in thickness; in these
observations, the source
falls outside the thicker coating of the "T" that covers all of taps
CRSV~89 to 107, and elsewhere above the top half of CRSU=10.

|

|
| Figure 2: The 14 off-axis HZ43 observations
in SKY coordinates. From left to right, ObsIDs 15451-58 and 15459-464. | Figure 3: In RAW coordinates. |
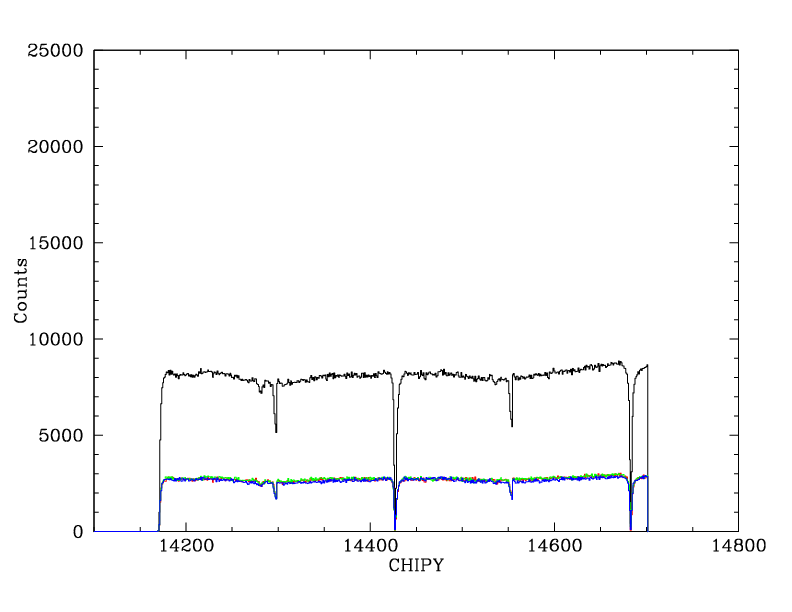
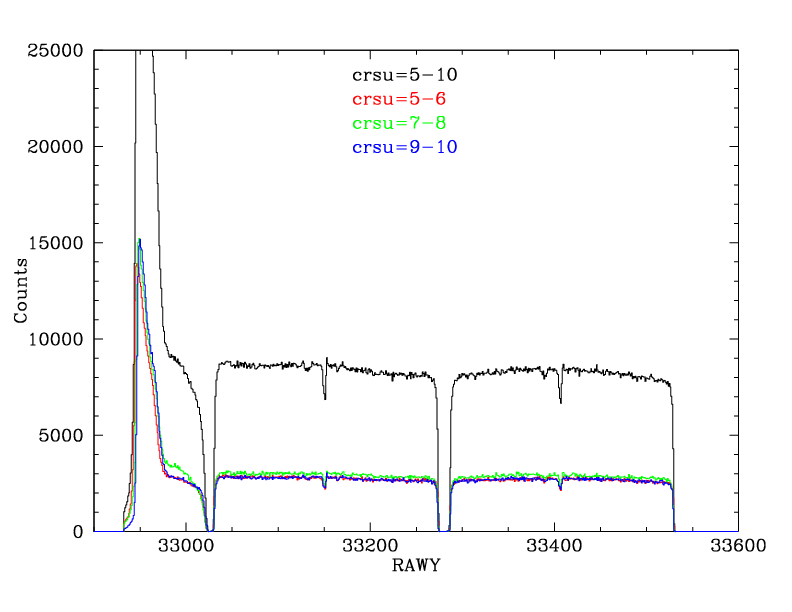
Fig. 4 shows details of event distributions in the 48-observation background-dominated merged data at each plate end. Note the following:
| evt2 minus badpix filtering | evt2 | evt2 RAWY profiles | evt2 CHIPY profiles | near-evt2 events with only bit29 flagged |
|---|---|---|---|---|
| 
| 
| 
| 
|
| Virtually same as evt2 | 
| 
| 
| 
|
| Virtually same as evt2 | 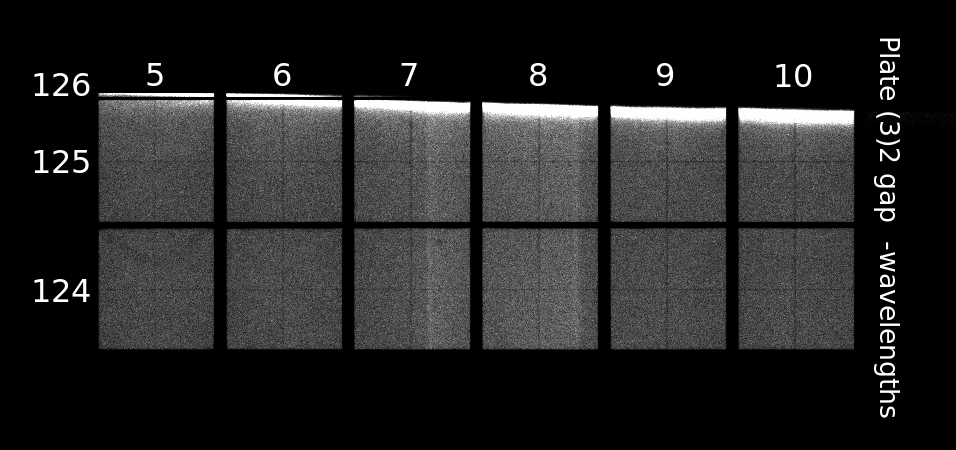
| 
| 
| 
|
| Virtually same as evt2 | 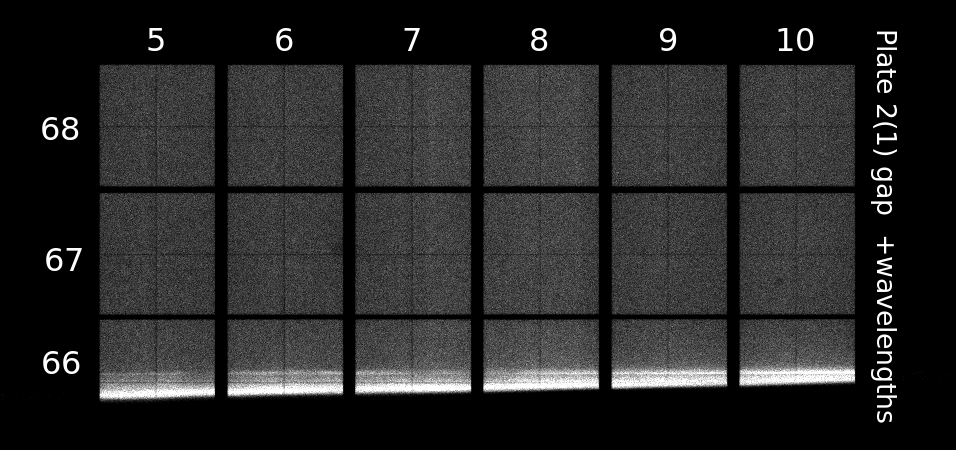
| 
| 
| 
|

| 
| 
| 
| 
|
| 
| 
| 
| 
|
| Figure 4:
(Left two) Evt2 images without and with badpix filtering.
(Middle two) Corresponding evt2 RAWY and CHIPY distributions. (Right) RAWY profiles of events removed from evt2 file that were flagged as bad only by status bit 29 (V amp saturation). | ||||
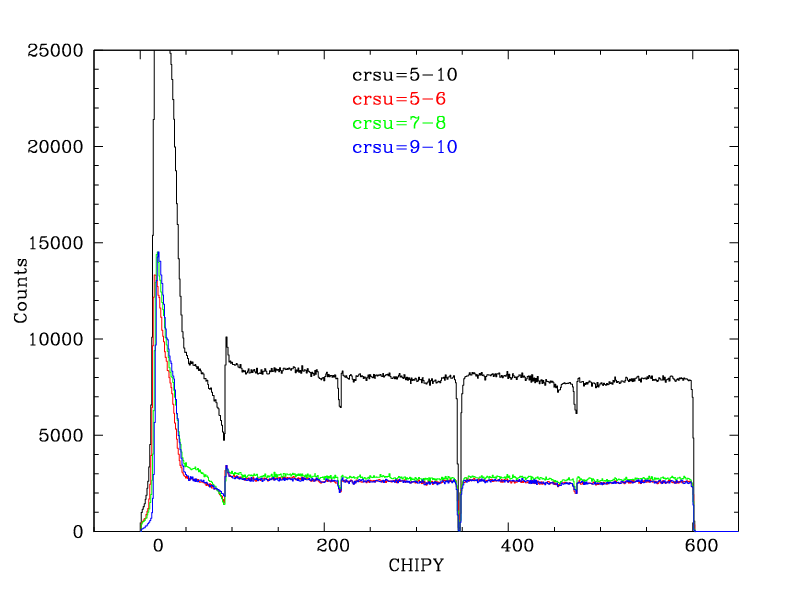
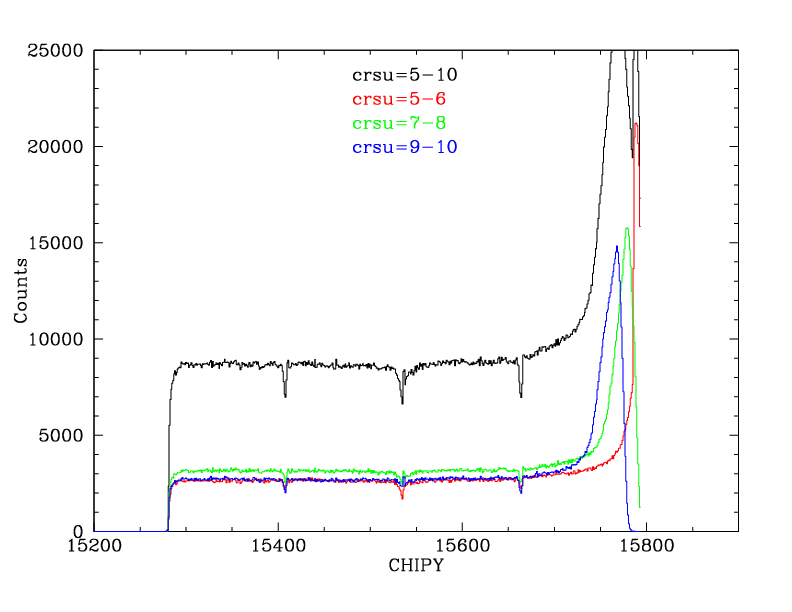
It's not clear from the merged background-dominated data if the high-count areas at the plate ends are from higher background emission or because events that are uniformly distributed in real space are being crammed together in pixel space because of imperfect position readout. Data from the off-axis HZ43 observations can resolve this question. Below, we examine X-ray events on the inner edge of plate 3 (CRSV=128:129) from ObsID 15460.
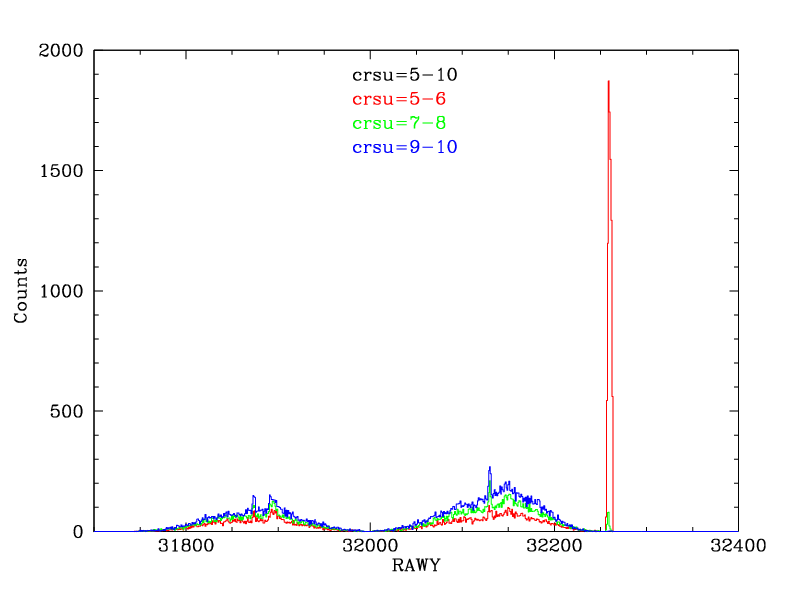
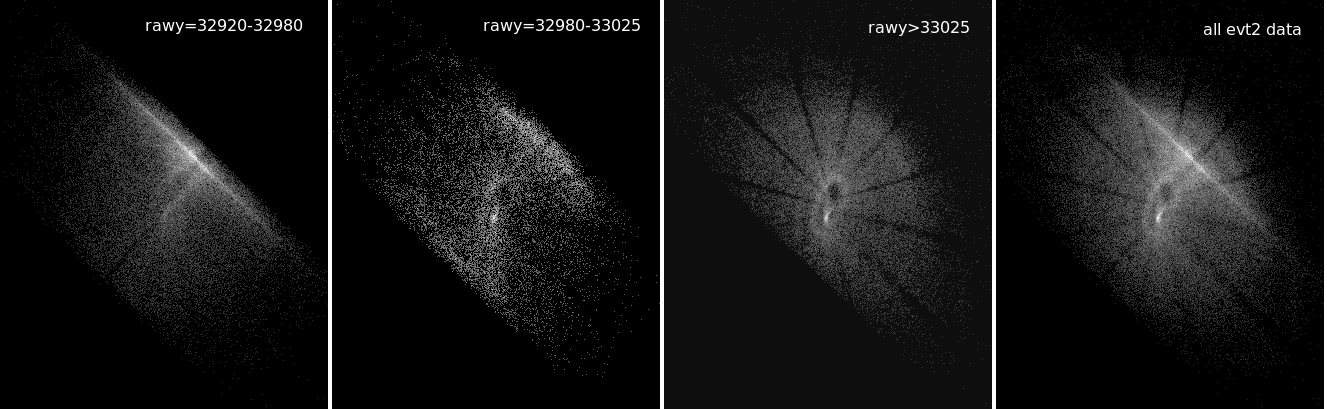
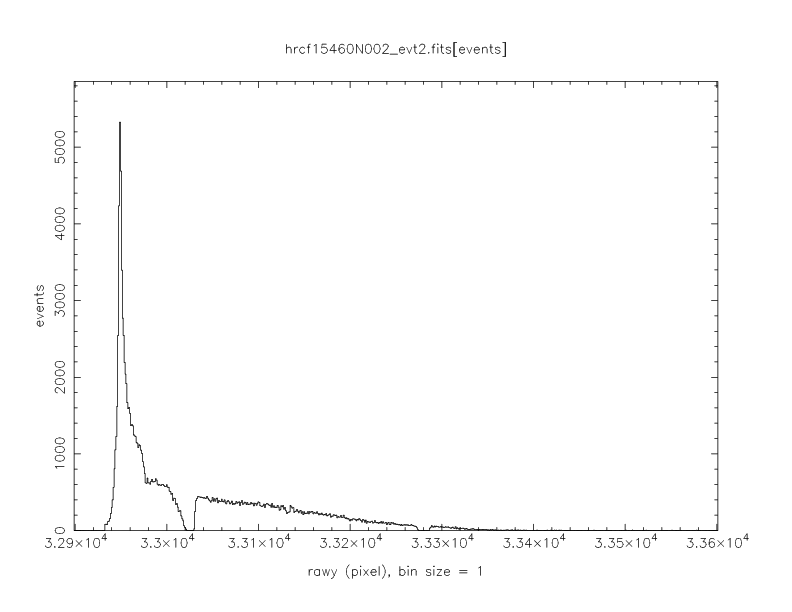
Fig. 5/left shows SKY images of that observation using data from various ranges of RAWY. The nonphysical bright streak seen in the full image comes from events at the edge of the plate (RAWY=32920:32980). Note that the streak does not extend uniformly across the detector. Fig. 5/right shows the RAWY profile, which is very similar to the profile for background-dominated data near the plate edge, indicating that the high-rate areas on the plate edge are caused by bunching up of events along the RAWY axis.
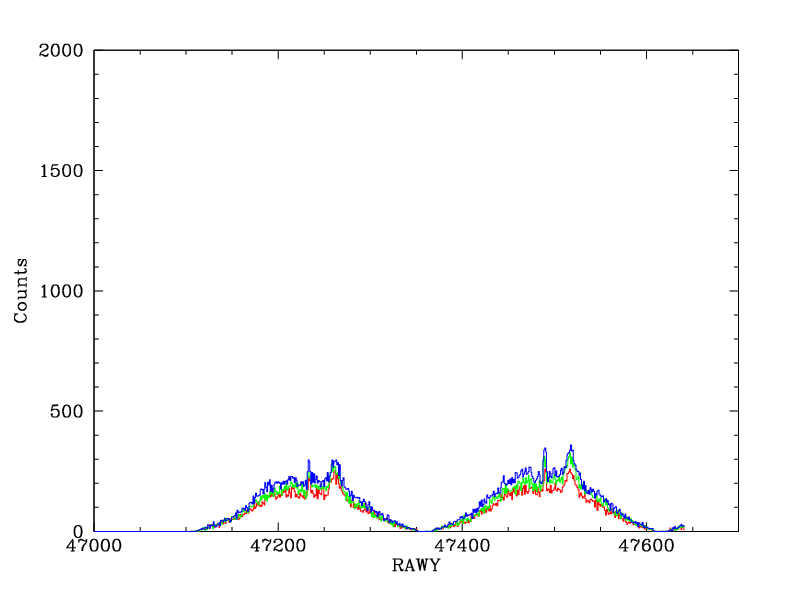
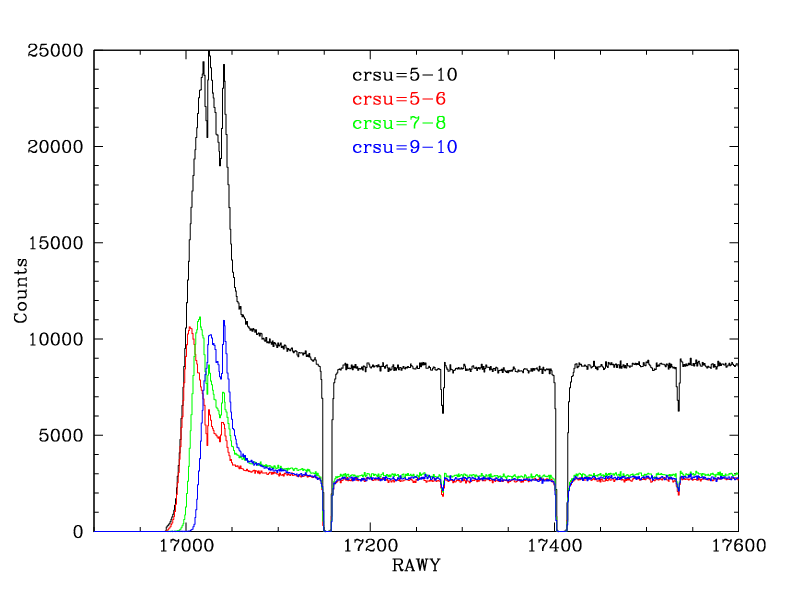
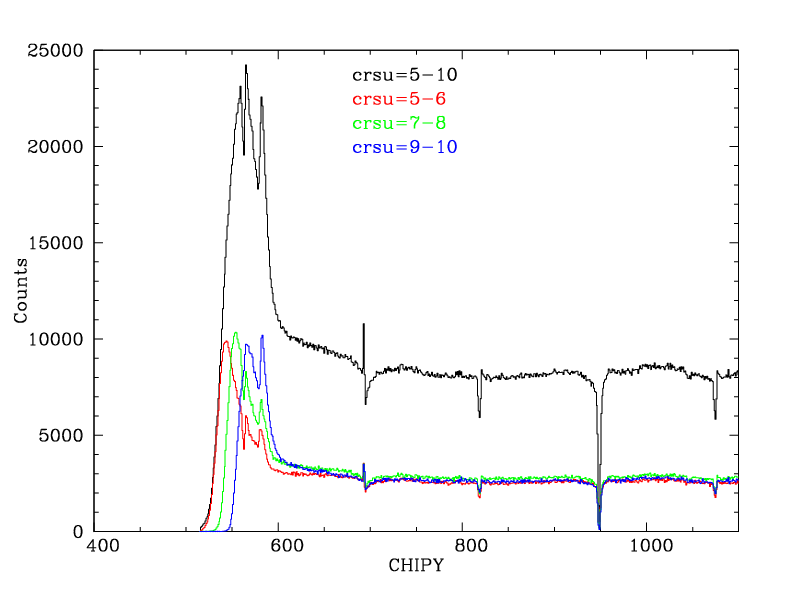
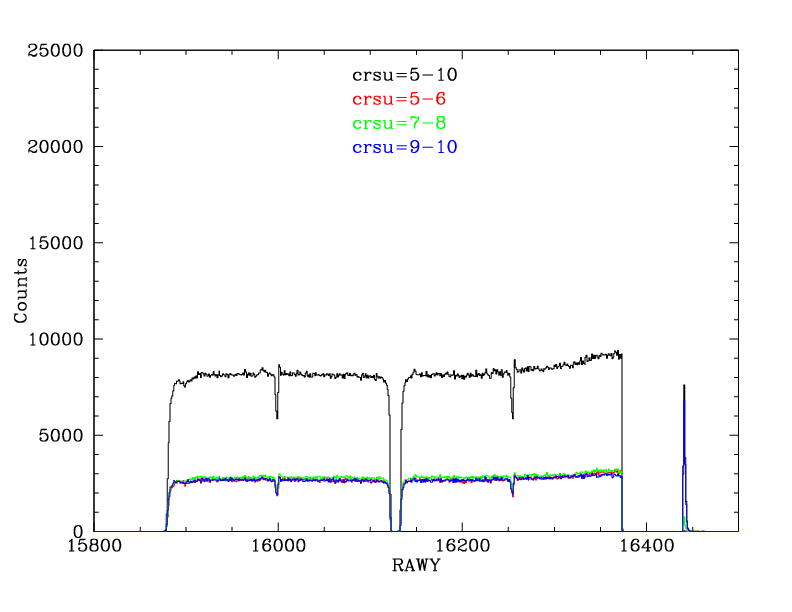
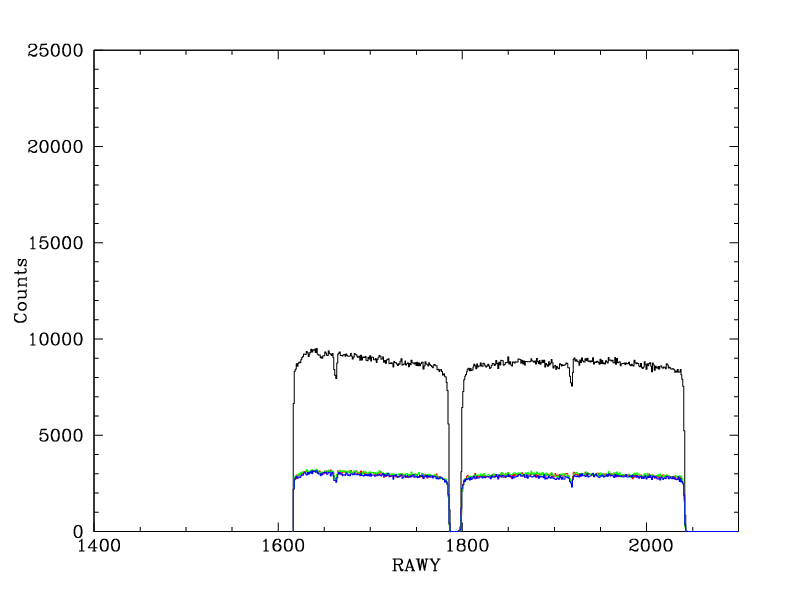
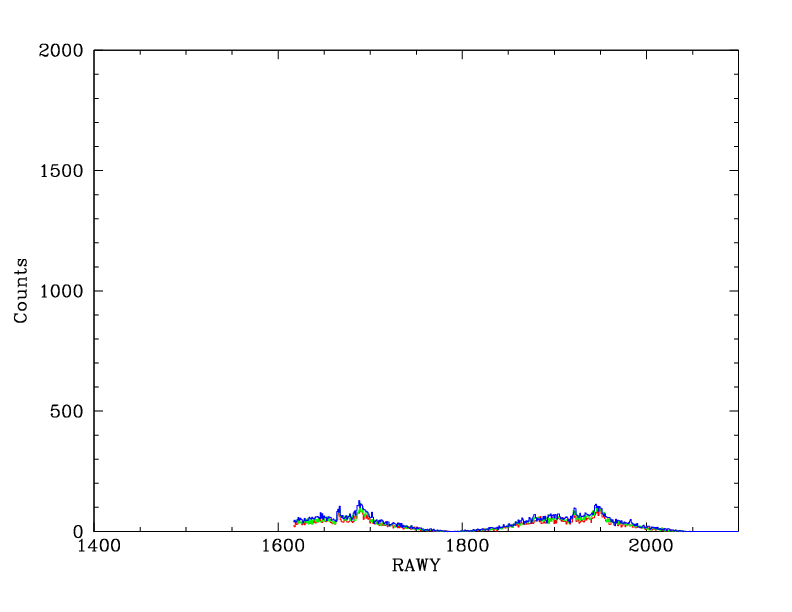
Fig. 6 shows the RAWX profile of the 48-observation merged data in the range RAWY=32970:32979 where background-dominated edge emission is high. Fig. 7 shows the same thing but for the X-ray dominated events of ObsID 15460. The merged data profile is roughly flat, with the largest deviations caused by dispersed spectra events in the center taps. The HZ43 profile, however, is clearly nonuniform, again showing that the edge events are coming from X-rays as the source dithers on the detector, not from background, and bunching up in RAWY.
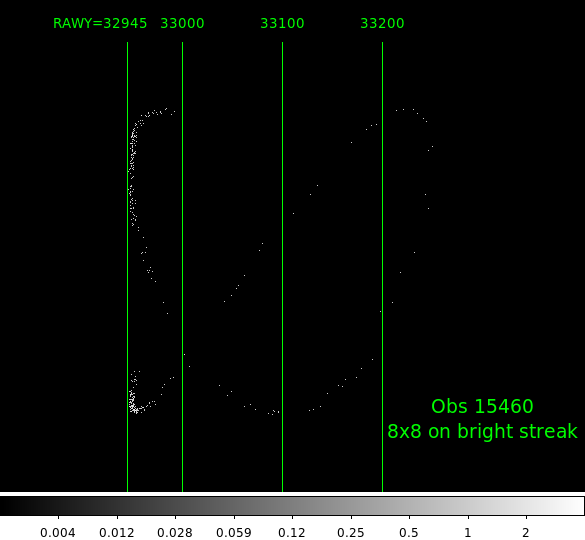
Further evidence is provided by extracting data from a particularly bright knot (8×8 pixels) of the streak in Fig. 5 and then displaying those events in CHIP coordinates (Fig. 8). As can be seen, the edge of the dither pattern (corresponding to events at the very edge of the plate) is flattened.
The conclusion is that the high-count areas on the plate edges arise
from incorrect determinations of event positions, with events from
a physical area several pixels wide being crammed into
a single RAWX pixel. In principle, more accurate event positions could be
calculated when converting from RAW to CHIP coordinates via the degap
map but this would require a very high-order polynomial and the
lost position resolution cannot be recovered. The slanted high-count
edges for CRSV=66 and 125 also indicate that a 2-dimensional degap
map would be required.
|
|
| Figure 5: (Left 4 panels) ObsID 15460 SKY images using various RAWY ranges. (Right) RAWY profile. | |

|

|
|
| Figure 6: RAWX profile from background-dominated merged data in a RAWY slice near a plate edge (CRSV=128). | Figure 7: RAWX profile for the same RAWY range as in Fig. 6 using X-ray data (HZ43, ObsID 15460). | Figure 8: Dither pattern of events extracted from SKY image of ObsID 15460. Note the flattening on the left. |
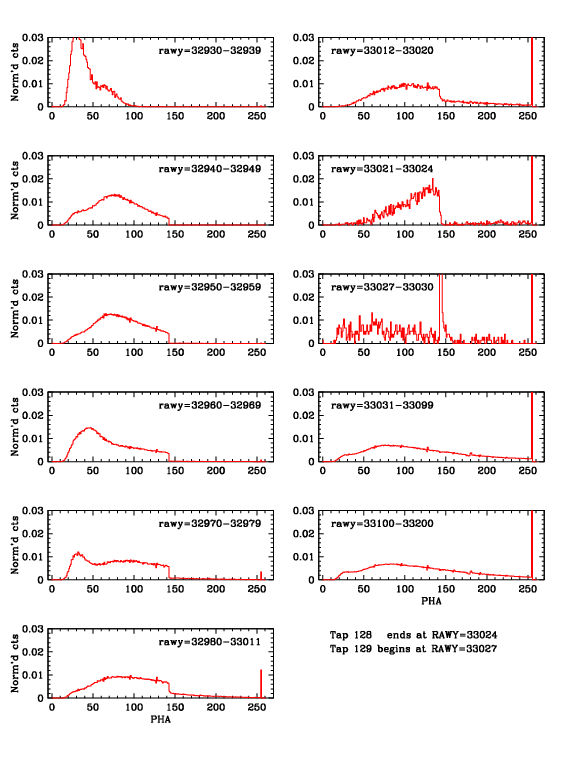
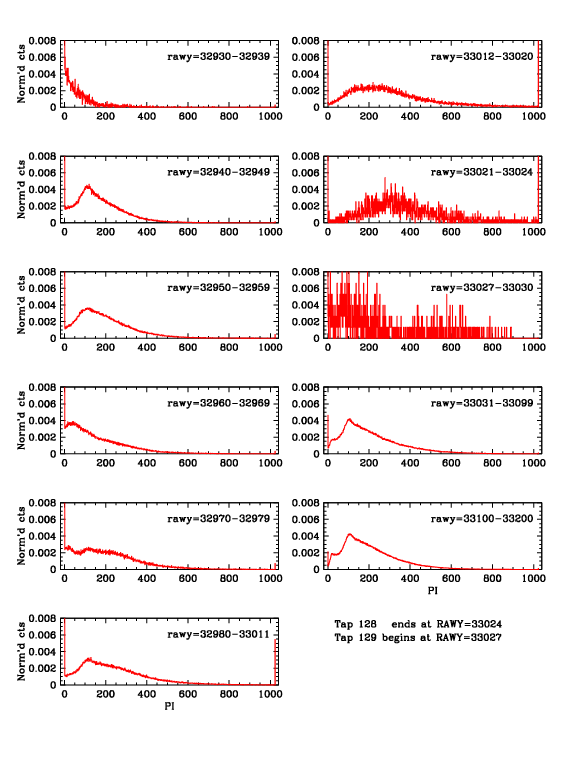
In addition to position errors at the plate edges, events there also display anomalous pulse height distributions (PHDs). Figs. 9 and 10 show PHDs from the merged-observation (background dominated) data for several ranges of RAWY near the inner edge of plate 3 on the CRSV=128 and 129 taps. The PHDs on tap 129 (one tap away from the plate end) all have normal shapes apart from some oddness (a peak around PHA=143) for a couple pixels right next to the tap gap. On tap 128, however, the PHA PHDs all have an abrupt dropoff at PHA=143, including the "shoulder" region (RAWY=32980-33020 here) before the high-count region. This dropoff is caused by standard filtering of status bit #29, which flags events where "V amp saturation test failed: One or more of the tap signals on the V-axis exceeded their saturation level. The V-axis position calculated for the event is unreliable." As seen in the rightmost column of Fig. 4, events with this problem have high density on taps CRSV=64, 126, and 128 (and notice that this is true on all of tap 128, including the shoulder, consistent with the PHA PHDs in Fig. 10).
A peak at very low channels also appears and tends to increase in strength
toward the edge of the plate.
Similar low-channel behavior is seen in PHA for
the HZ43 data of ObsID 15460 (Fig. 11), although a channel-143 cutoff is
not seen because the X-ray PHDs have few if any counts beyond PHA~110.
Fig. 12 shows PHDs from pre-flight laboratory calibration data with
C-K (277 eV) emission. As in the flight data, odd PHDs are seen toward
the plate edge.

|
|

|
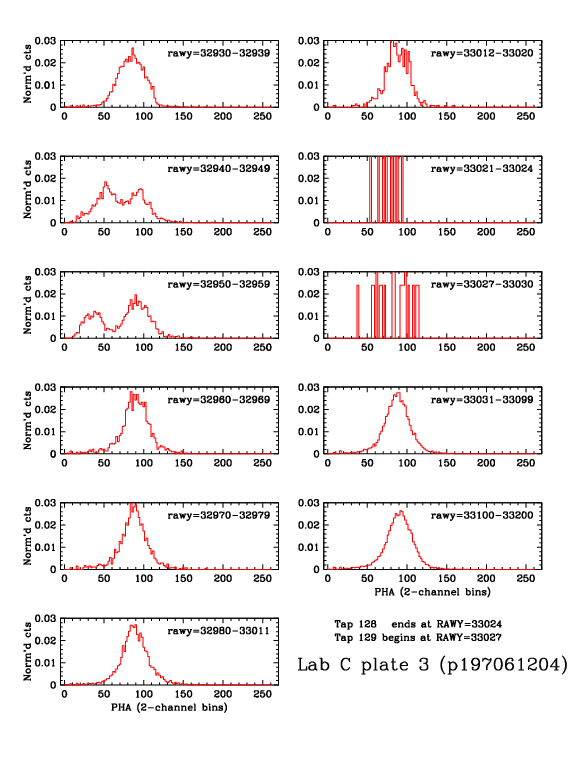
|
| Figure 9: PHA distributions as f(RAWY) on the CRSV=129 tap, which is a fully "good" region. The chosen RAWY ranges correspond to those in Fig. 10 (tap 128), modulo 256 pixels (one tap). | Figure 10: PHA on tap 128, the inner edge of plate3. PHDs have dropoffs around PHA=143 and low-channel peaks toward the plate edge. The latter are also seen in PI PHDs but not the dropoffs. | Figure 11: Same as Fig. 10 but using the HZ43 X-ray events of ObsID 15460. As in Fig. 10, an extra low-channel peak is seen close to the plate edge. | Figure 12: Same as Fig. 10 and 11 but using C-K laboratory data. Similar oddly shaped distributions are seen but not necessarily in the same RAWY ranges as flight data. This is presumably because of the Dec 1999 change to the HRC-S range switch level, which affects AMP_SF break points. |
The problematic regions do not have sharp edges, and the exact range to remove is not obvious, particularly when the apparent edge is slanted, as for CRSV=66 and 125. The edge of tap 128 is pretty straight, but there's the odd shoulder range (roughly RAWY=32980 to the tap end at 33023) with its bit-29 errors, truncated PHA distributions, and scalloping. We conservatively assume that data in the shoulder region are valid/useful, but a new degap solution for that region is desirable (see the nonuniform event distribution in the degapped merged data; also note in the second panel of Fig. 5, which uses data from that region, that the support-strut shadows appear to be fuzzier than in the third panel, indicating position errors).
Recommended limits for good data are:
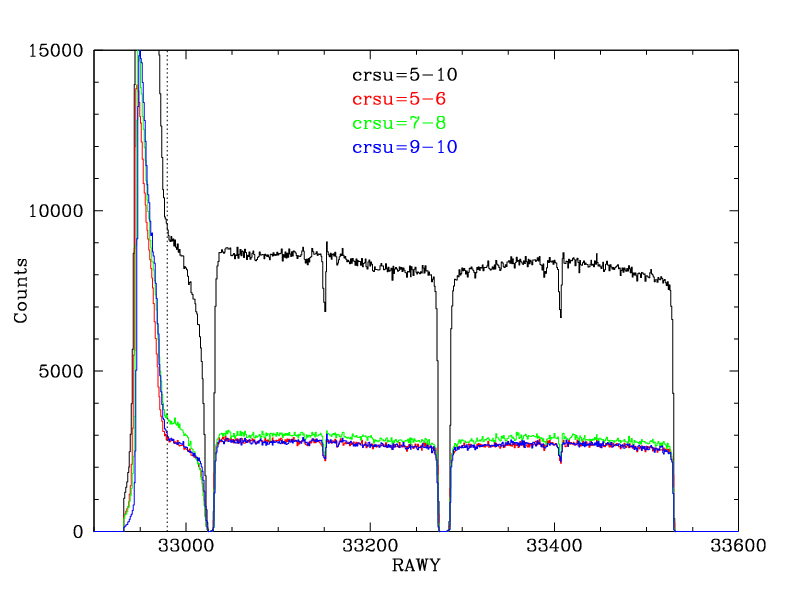
This amounts to the removal of 88, 79, and 51 pixels for a total of 218 (0.5% out of ~45000), equivalent to 1.61 Å of wavelength coverage (out of 165+175 Å). On taps 66 and 125, one could make a case that another ten or twenty pixels could be included as good(ish) data, but a single degap solution would not be very accurate across all values of CRSU (note different curvatures of the red, green, and blue traces in Fig. 13). The recommended badpix limits are illustrated below.

|

|
|
| Figure 13: Recommended new badpix limits for CRSV taps 66, 125, and 128. | ||
Last modified: 06/16/17

