Cycle 28 PIMMS Effective Areas
Released as of 18 DEC 2025
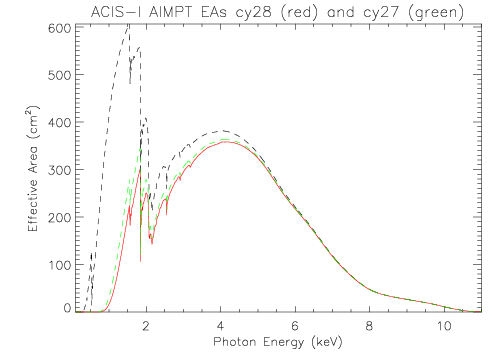
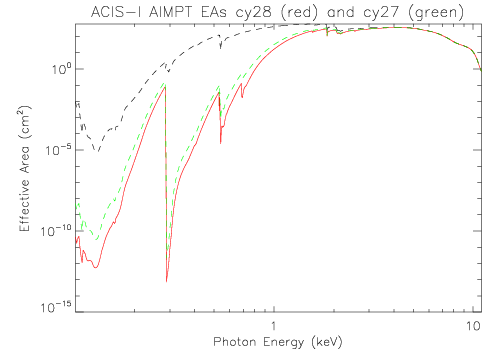
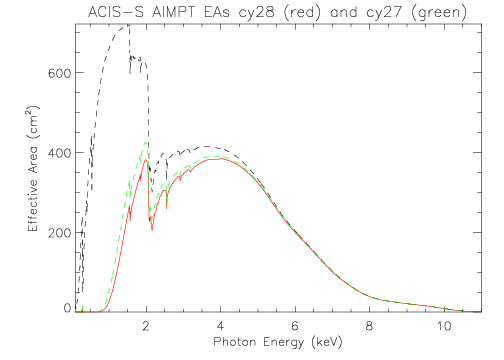
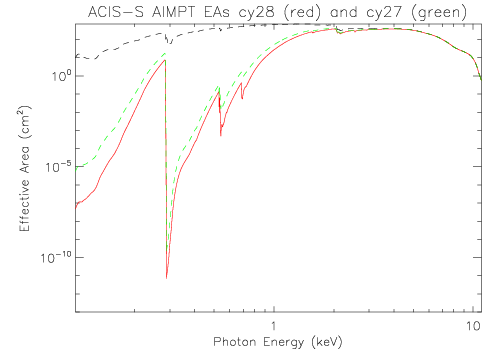
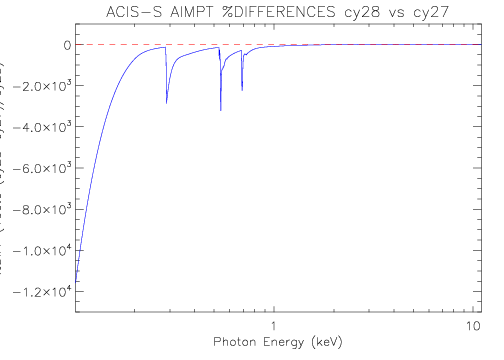
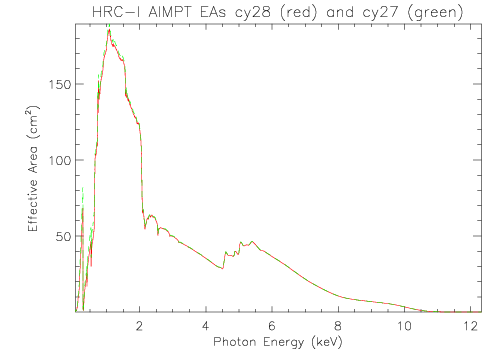
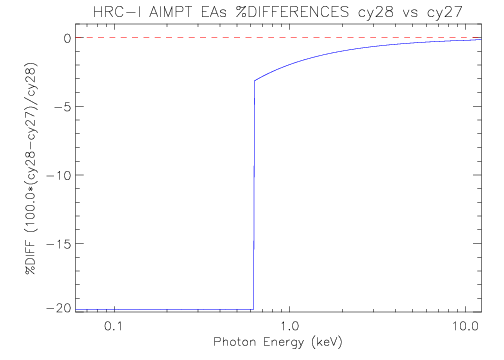
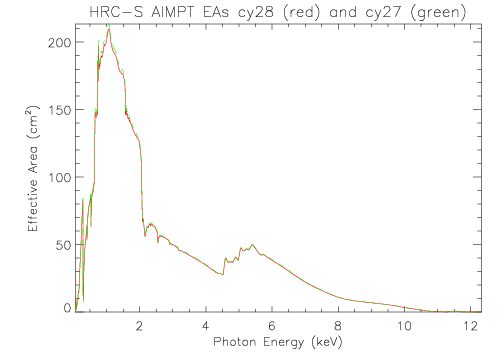
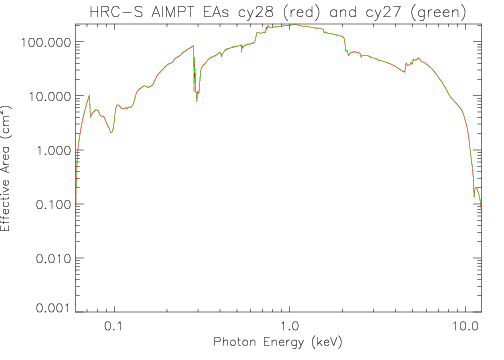
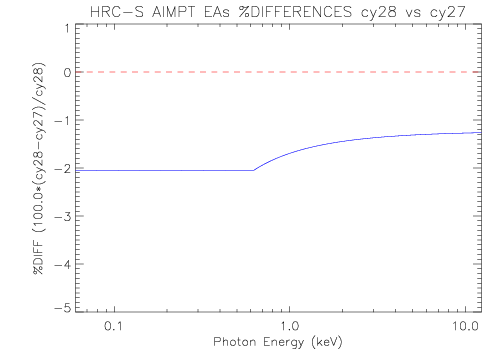
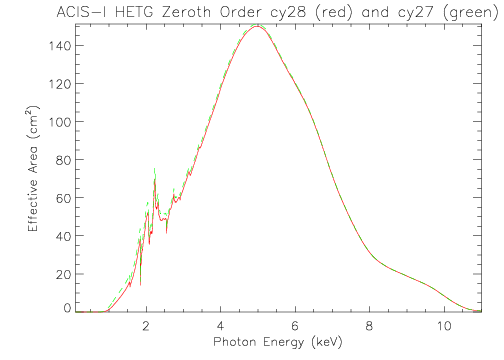
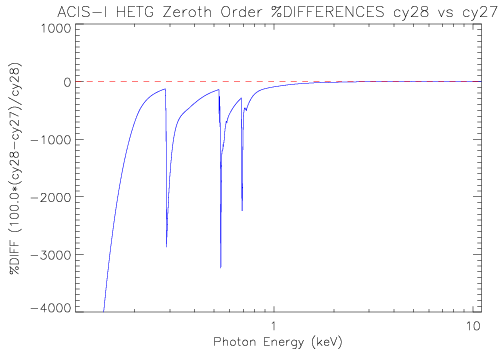
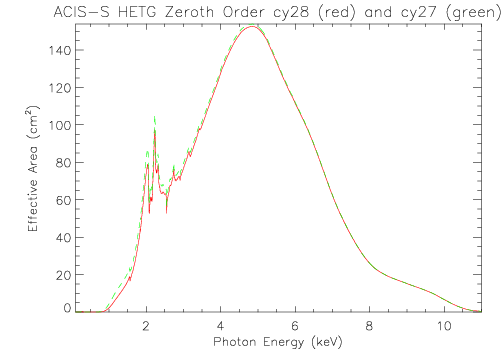
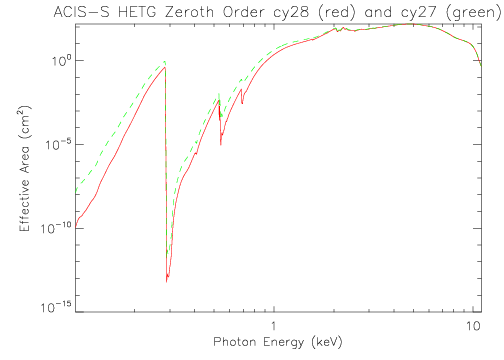
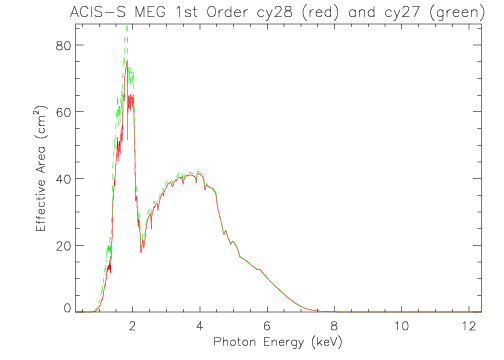
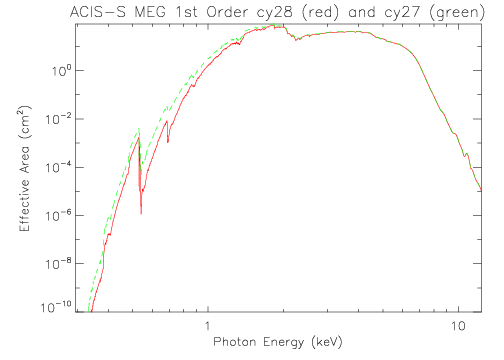
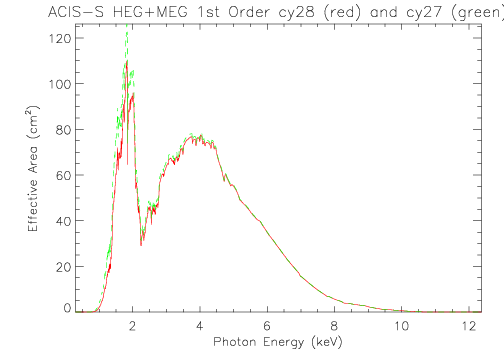
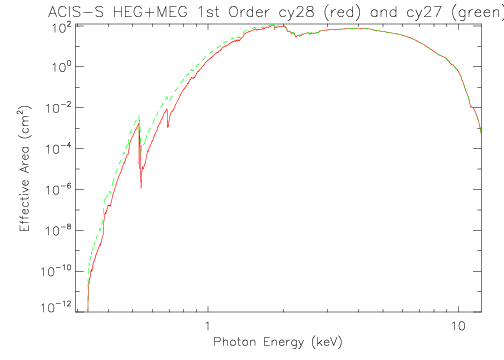
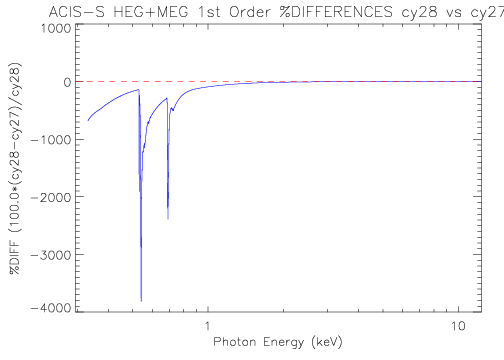
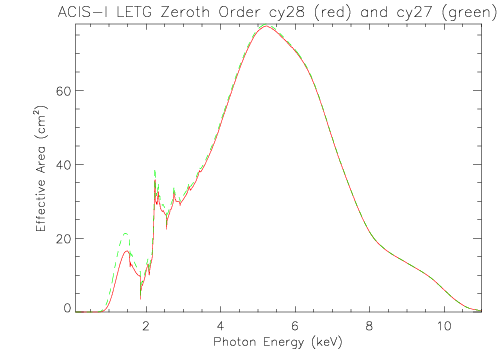
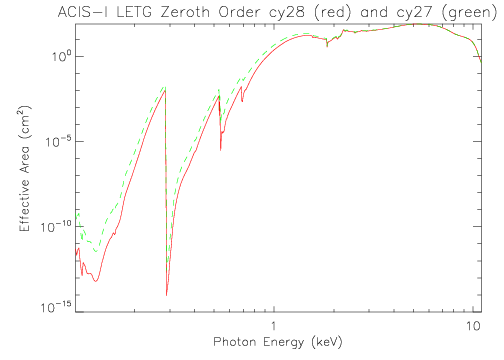
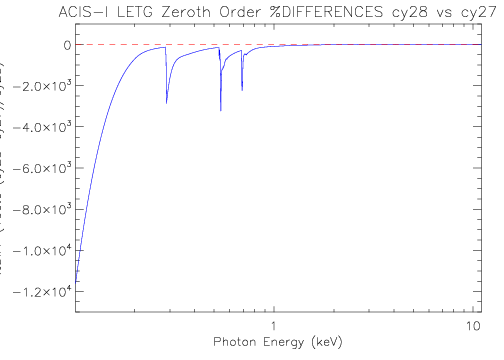
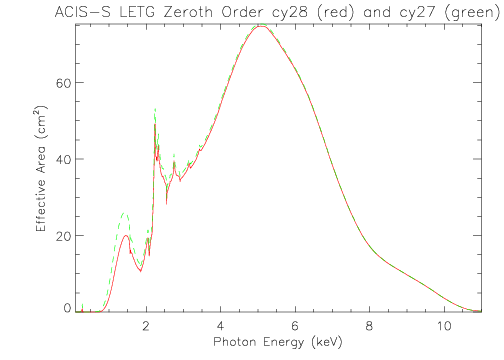
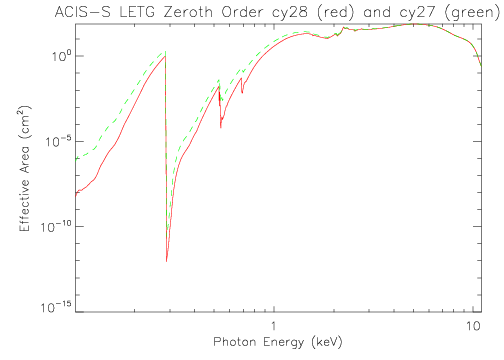
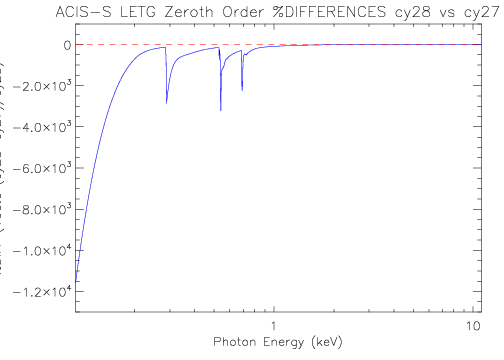
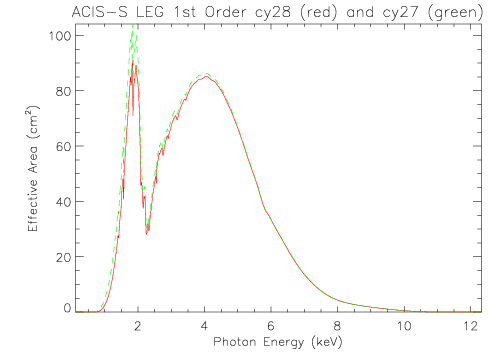
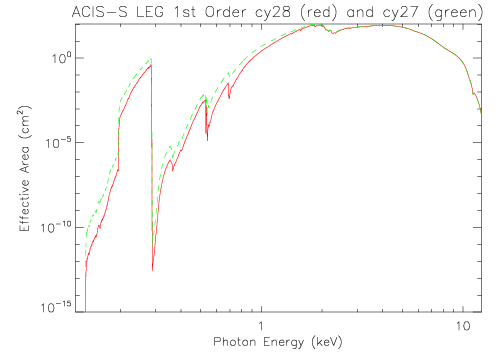
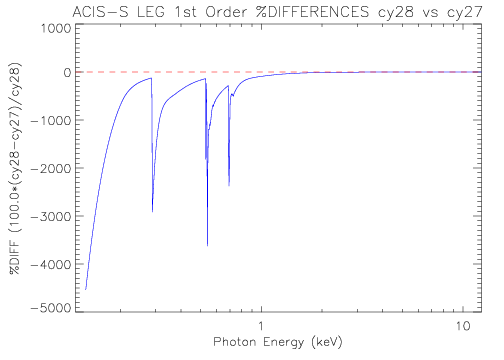
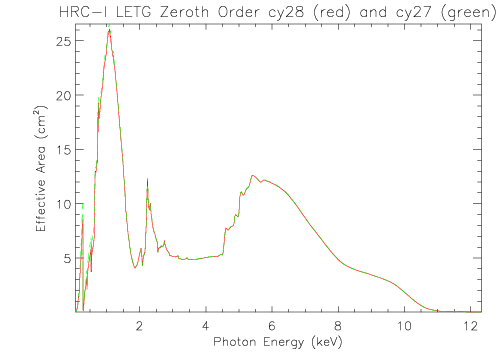
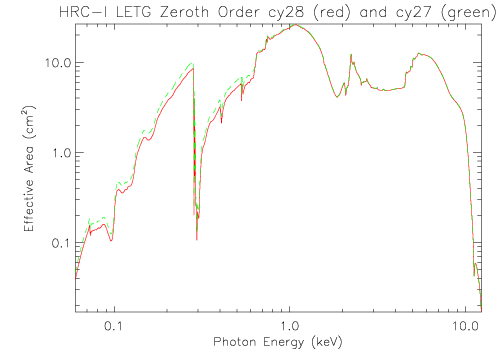
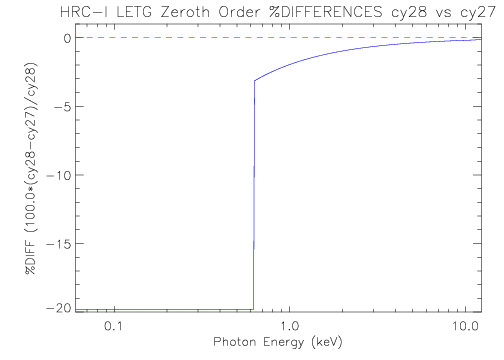
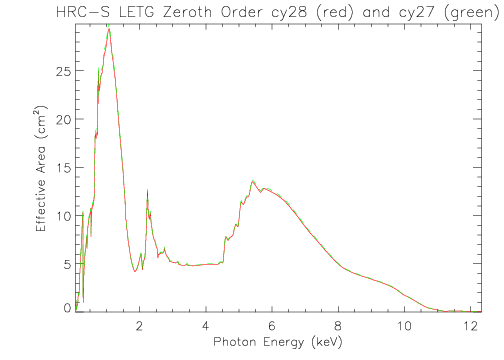
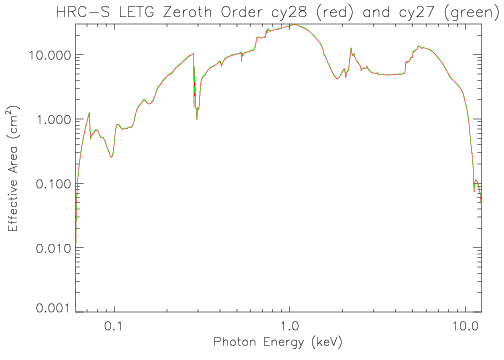
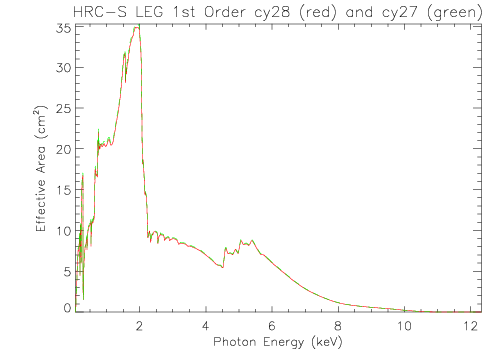
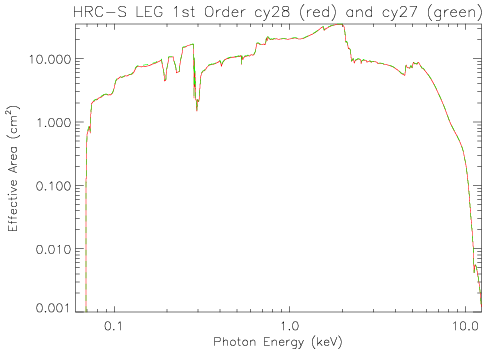
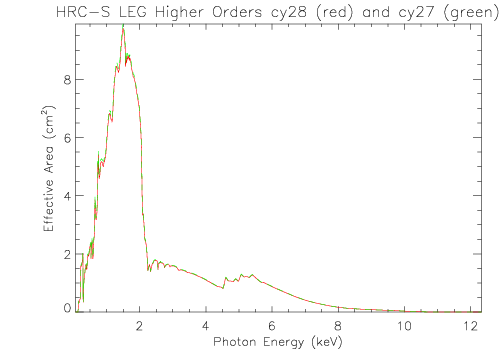
The PIMMS Cycle 28 effective areas are illustrated below. The ACIS CONTAM file has been upgraded to version N0016. As is always the case, the time-delay factor for the ACIS contaminant build-up has been updated. No other changes to ACIS calibrations have been implemented since Cycle 27. The HRC-I QE has been upgraded, and HRC-S includes an update to the current QEU file as well.
The model OBS_IDs and the ARF-building scripts have now been standardized for Chandra PIMMS calculations. Hence the procedures are the same as with cy27.
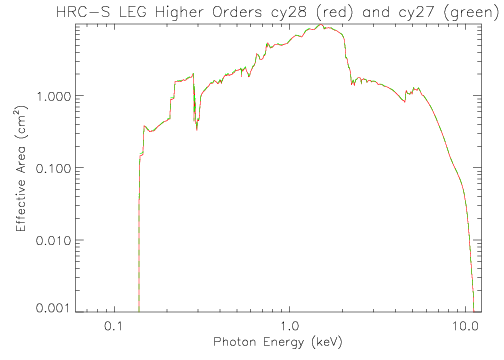
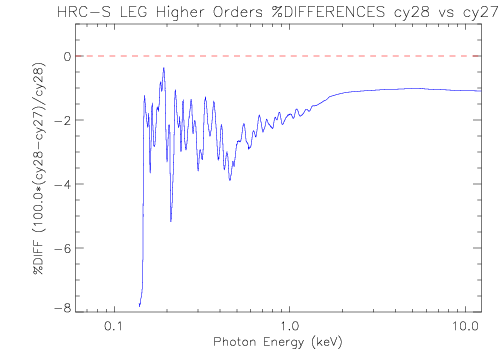
The Cycle 28 PIMMS Effective Area Public Information describes how the effective area files were generated, including the new HETG and LETG GREFFs and the new HRC-S QE file.
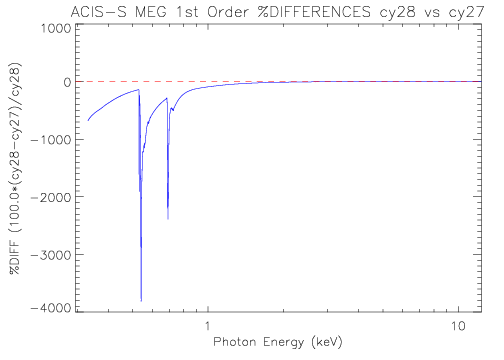
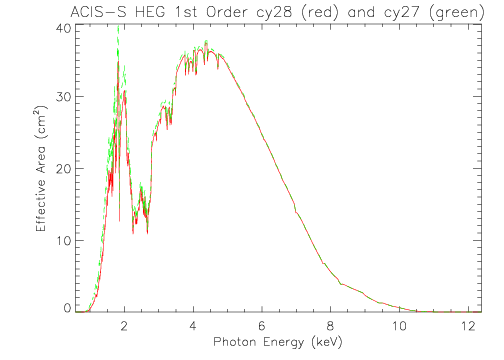
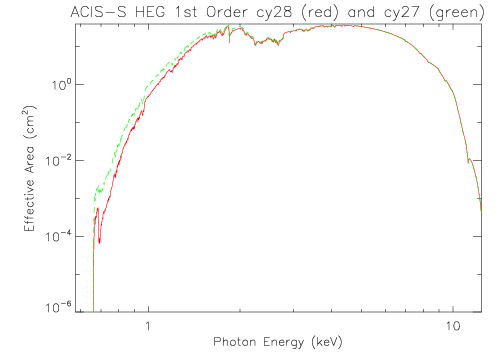
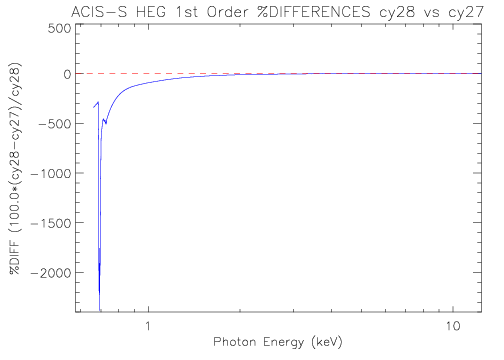
Effective area plots are provided for the following detector configurations: