Validation: Line Flux Estimate
| Introduction |
| LSF Reference Data |
| Building LSFPARMS |
| Caveats |
| Validation |
| Summary |
| Other Links |
| isis |
| mit/cxc |
| ciao |
| caldb |
Line Flux Estimate
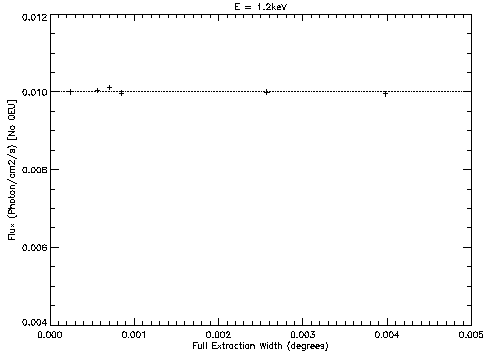
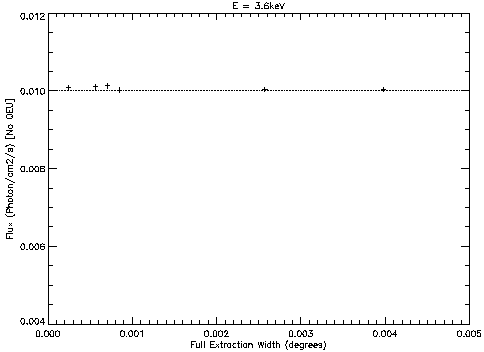
At any given extraction width, the measured line flux - derived after fitting a model (or a function) - shoudl be identical.
We run a number of mono-energetic marx simulations with a given source flux of 0.01 photons/cm2/s per line. Similiarily to the analysis in the previous page, we use isis to perform a delta function fitting, to derive a model flux, and then compare the expected and model values to see how well (or badly) their values would match.
Simply taking the ratio of the derived flux to the expected value, we find that the difference is generally less than 5%. This results are tabulated in Table 2 below (the result can be seen as plots also). The worst cases in each energy are found generally with a very narrow extraction width. This happens since the narrowest extraction width (0.000122deg) for HEG is set outside the grid points used in the LSF library, i.e., the tool mkgrmf (to make RMF from LSF) is forced to extrapolate the LSF parameter values to make RMF. This is one of the limitations to the current LSF library.
Table 2: Validation of Flux Estimate at Various Extraction Widths
| HEG | |||||||
| Energy | Extraction | Width | (deg) | ||||
| (keV) | 0.000122 | 0.000281 | 0.000353 | 0.000424 | 0.001286 | 0.001989 | |
| 0.8 | 85.0% | 92.6% | 91.4% | 95.2% | 93.4% | 92.1% | Plot |
| 1.0 | 97.0% | 101.% | 101.% | 103.% | 100.% | 99.3% | Plot |
| 1.2 | 95.8% | 97.4% | 97.7% | 99.1% | 97.2% | 96.6% | Plot |
| 1.4 | 95.2% | 100.% | 100.% | 101.% | 99.7% | 99.1% | Plot |
| 1.6 | 94.3% | 99.2% | 99.0% | 99.5% | 98.4% | 97.9% | Plot |
| 1.8 | 92.0% | 99.3% | 99.2% | 99.7% | 99.1% | 98.6% | Plot |
| 2.0 | 90.3% | 97.7% | 97.6% | 97.9% | 97.2% | 96.9% | Plot |
| 2.2 | 93.9% | 99.9% | 99.3% | 99.6% | 98.9% | 98.4% | Plot |
| 2.4 | 92.1% | 98.6% | 98.5% | 98.7% | 98.3% | 97.7% | Plot |
| 2.6 | 89.8% | 94.9% | 94.9% | 95.2% | 94.4% | 93.8% | Plot |
| 2.8 | 93.1% | 100.% | 100.% | 101.% | 99.8% | 99.1% | Plot |
| 3.0 | 91.6% | 101.% | 100.% | 100.% | 100.% | 99.1% | Plot |
| 3.2 | 92.9% | 99.9% | 99.4% | 99.5% | 99.0% | 97.9% | Plot |
| 3.4 | 93.7% | 100.% | 100.% | 100.% | 99.9% | 98.8% | Plot |
| 3.6 | 90.7% | 98.6% | 98.6% | 98.7% | 98.5% | 97.4% | Plot |
| 3.8 | 93.0% | 98.8% | 99.0% | 99.2% | 98.9% | 98.0% | Plot |
| 4.0 | 94.5% | 101.% | 102.% | 102.% | 101.% | 99.6% | Plot |
| 4.5 | 92.3% | 100.% | 99.9% | 100.% | 99.8% | 98.6% | Plot |
| 5.0 | 89.9% | 96.8% | 96.8% | 97.1% | 96.6% | 95.5% | Plot |
| 6.0 | 90.7% | 96.5% | 96.9% | 97.2% | 96.7% | 95.3% | Plot |
| 6.5 | 92.8% | 98.5% | 98.9% | 99.1% | 98.7% | 97.2% | Plot |
| 7.0 | 90.7% | 98.3% | 97.6% | 97.8% | 96.9% | 95.3% | Plot |
| MEG | |||||||
| Energy | Extraction | Width | (deg) | ||||
| (keV) | 0.000122 | 0.000281 | 0.000353 | 0.000424 | 0.001286 | 0.001989 | |
| 0.5 | 97.3% | 89.9% | 87.0% | 87.2% | 89.1% | 89.3% | Plot |
| 0.6 | 99.6% | 93.4% | 97.2% | 95.4% | 96.3% | 96.2% | Plot |
| 0.8 | 100.% | 100.% | 101.% | 99.1% | 98.7% | 98.7% | Plot |
| 1.0 | 99.5% | 99.6% | 101.% | 99.0% | 99.0% | 98.8% | Plot |
| 1.2 | 100.% | 100.% | 101.% | 99.7% | 99.9% | 99.5% | Plot |
| 1.4 | 97.8% | 98.4% | 99.0% | 97.6% | 97.9% | 97.6% | Plot |
| 1.6 | 99.3% | 100.% | 101.% | 99.4% | 99.7% | 99.5% | Plot |
| 1.8 | 98.8% | 99.5% | 100.% | 99.1% | 99.1% | 98.8% | Plot |
| 2.0 | 99.4% | 100.% | 101.% | 100.% | 100.% | 99.8% | Plot |
| 2.2 | 99.5% | 99.9% | 100.% | 98.9% | 98.7% | 98.4% | Plot |
| 2.4 | 97.9% | 97.8% | 98.2% | 97.2% | 97.4% | 97.2% | Plot |
| 2.6 | 98.3% | 97.7% | 98.2% | 96.9% | 97.0% | 96.8% | Plot |
| 2.8 | 100.% | 99.4% | 99.9% | 99.1% | 99.0% | 99.0% | Plot |
| 3.0 | 99.1% | 99.4% | 99.7% | 98.8% | 98.6% | 98.4% | Plot |
| 3.2 | 96.8% | 98.5% | 99.1% | 98.0% | 97.9% | 97.7% | Plot |
| 3.4 | 99.4% | 99.2% | 99.5% | 98.1% | 98.5% | 98.3% | Plot |
| 3.6 | 101.% | 101.% | 101.% | 100.% | 100.% | 100.% | Plot |
| 3.8 | 99.1% | 99.6% | 100.% | 99.3% | 99.4% | 99.1% | Plot |
| 4.0 | 99.4% | 100.% | 101.% | 99.4% | 99.3% | 99.1% | Plot |
| 4.5 | 99.6% | 100.% | 101.% | 99.6% | 99.4% | 98.9% | Plot |
| 5.0 | 99.1% | 100.% | 101.% | 99.4% | 99.3% | 98.9% | Plot |
Note to the experts: the estimated fluxes are somewhat lower than the expected values. This results from the fact that the DTCORR keyword in marx simulation is fixed at 1.0. In reality the DTCORR value should have been slightly less than 1.0, leading to the reduction of the estimated flux. However, when marx are run without the pileup effect, the DTCORR is not evaluated rigorously (true for marx 4.0.3).
Furthermore, there has been a change in ways to determine encircled energy fraction (EEFRACS) of the new LSF library. The new process takes a proper account of the effect of mirror scatters so that, at a higher energy, the EEFRACS value is evaluated more accurately than before (esp. compared with the canned gRMF in CALDB).
Lastly, there are other calibration issues that had cropped up while comparing the LSF/RMF products with marx simulated datasets.
- Turn off QEU (via ardlib.par) when making ARF,
- Make sure to utilize OSIP files (i.e., OSIPfile=CALDB),
- Set QE files to version N0004 (via ardlib.par)
- Be careful when extracting high-energy events; at a high E, HEG and MEG regions overlap, which leads to some events being classified as tg.part=99.
| Previous: Validation: Line Profile | Next: Validation: Wavelength |