The Chandra Bibliography through Data
Raffaele D’Abrusco, Erin Scott, and the Archive Operations team
The Chandra Data Archive (CDA) has tracked the scientific impact of the Chandra X-ray Observatory since its launch by collecting, classifying, and curating a comprehensive list of scientific and technical publications related to Chandra. Papers are automatically selected from an as-broad-as-possible pool of candidate publications available in the Astrophysical Data System (ADS) and classified by Data Processing and Archive Operations team experts. The candidate Chandra papers are labeled according to many criteria, including (but not limited to) the significance and type of usage of Chandra data, whether the publication is scientific or technical, and the specific Chandra observations and/or Chandra Source Catalog (CSC) data products used in the publication. The metadata collected for each paper included in the bibliography are recorded in databases and used to calculate a variety of metrics that rely both on Chandra-specific attributes and bibliographic properties of the publications (number of citations, whether they are refereed or not, etc.). A regularly updated selection of typical bibliographic metrics can be found here.
At the pinnacle of the hierarchy of Chandra-related publications included in our bibliography are the so-called Chandra Science Papers (CSPs): refereed papers where Chandra plays a pivotal role, i.e. publications that could have not been written if Chandra had not been operating. Recently, we classified the 10,000th CSP over the almost 25 years of operations of our mission. Understanding how CSPs use Chandra data sheds light on how the existence of the Chandra archive has affected the type of science performed; in what follows, we present some insights from our investigations of how CSPs relate to Chandra archival observations.
Data Complexity
The building blocks of the Chandra archive are what we call “ObsIDs” (short for Observation ID), corresponding to an observation of a specified target for a specific proposal with a specific observational configuration. Single observations of Chandra targets can be—and often are—split into several ObsIDs based on observational requirements dictated by the scientific goals of the proposal they belong to or to facilitate their scheduling. The archive has grown to include ~23,000 single ObsIDs (among all categories of proposal including Calibration), covering ~4% of the area of the sky once and ~1.2% of the sky at least twice, with a variety of combinations of detectors and observational configurations. The linking of each paper to all ObsIDs it includes allows a granular mapping between bibliography and data holdings, which lends itself to measuring the “data complexity” of a typical Chandra publication.
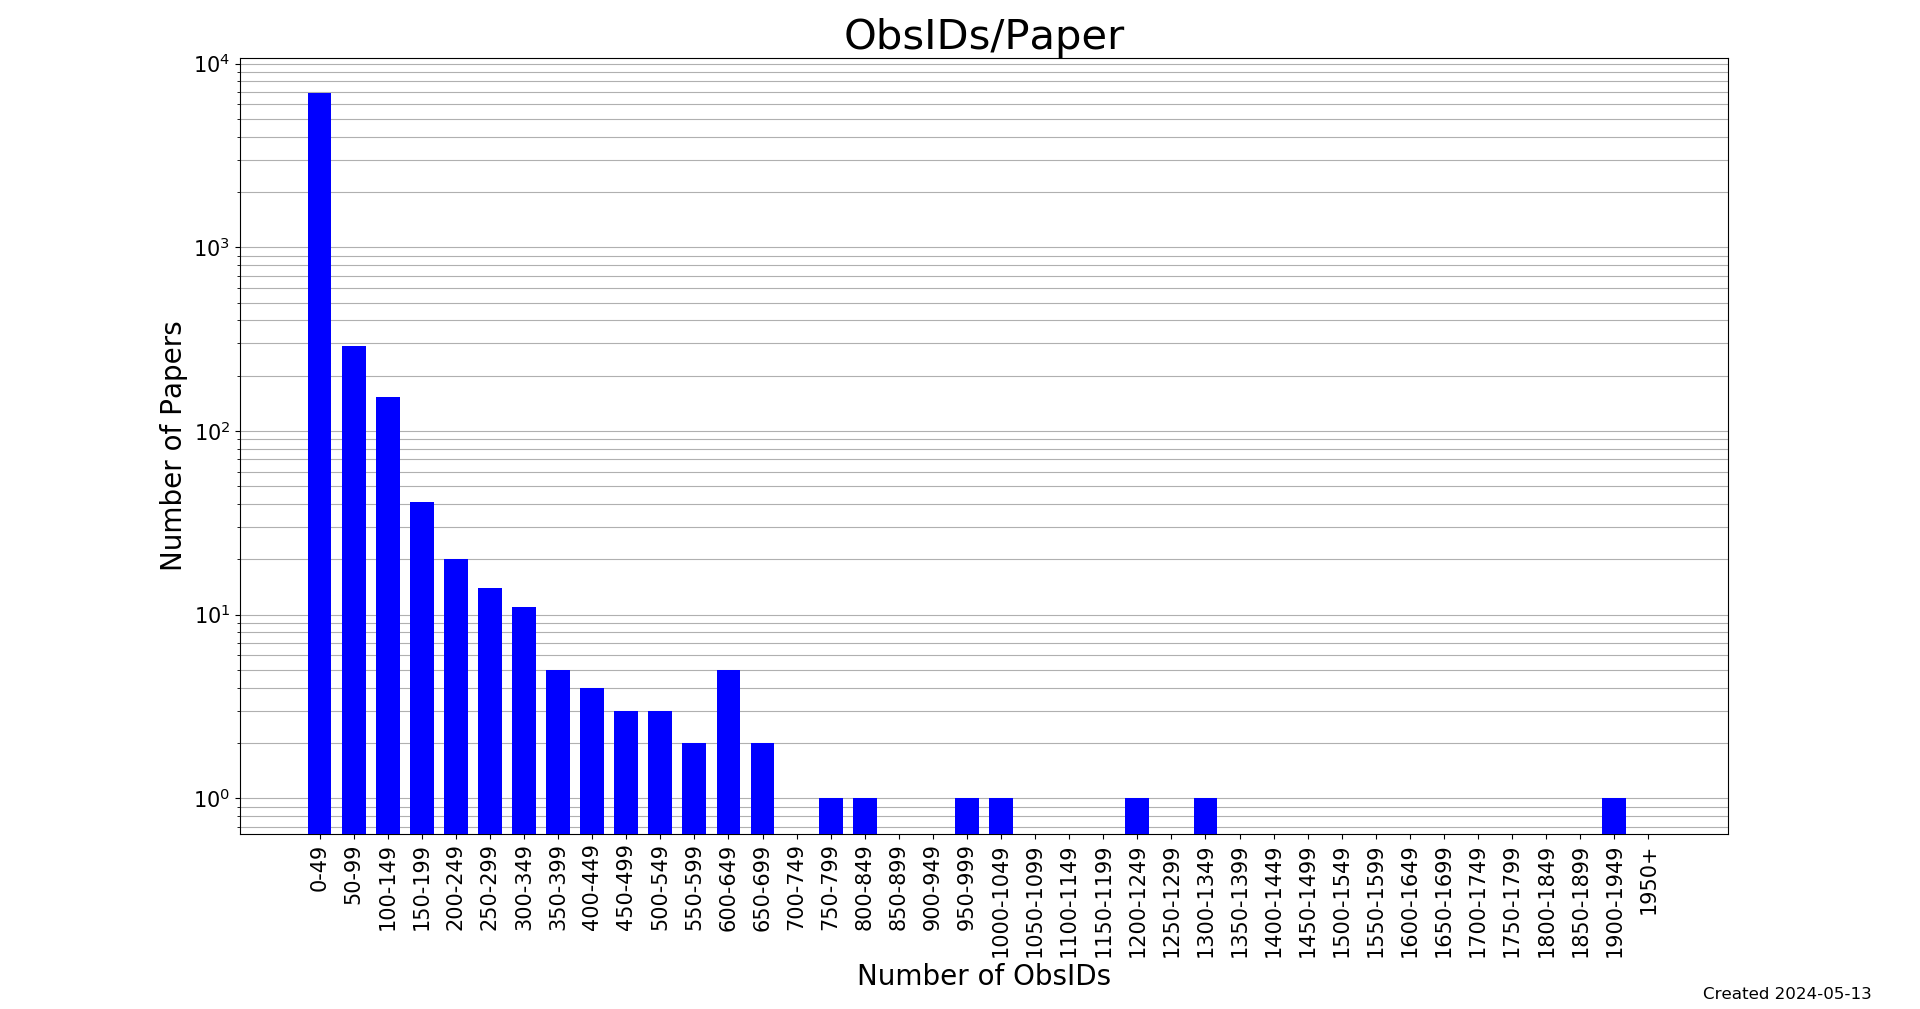
The most obvious way to assess the complexity of Chandra data used in papers is by counting the number of ObsIDs used in publications. The histogram of the distribution of the number of ObsIDs linked to all CSPs classified so far (Figure 1) shows a lopsided distribution: ~90% of all CSPs use 50 ObsIDs or fewer, ~7% employ between 50 and 250 observations, and only the remaining 3% of papers are linked to a larger number of ObsIDs. The rapid decrease with increasing number of observations is interrupted by a spike in the 600–649 bin, corresponding to a handful of refereed papers (independently written by non-overlapping list of co-authors) that investigate different aspects of approximately the same sample of archival observations of galaxies and the clusters of galaxies they reside in. This is a curious example of the type of insights that can be gained from even the simplest analysis of the bibliography data collected by the CDA. Conversely, the 7 CSPs linked to more than 700 ObsIDs offer an impressive picture of the diversity of astrophysical questions Chandra has helped to answer, as they span wildly different classes of astrophysical sources and research fields (from cataclysmic variables to quasars, from normal galaxies to galaxy clusters, and culminating with cosmology).

Figure 1: Histogram of the distribution of Chandra Science Papers (CSPs) as a function of the number of ObsIDs linked to the paper.
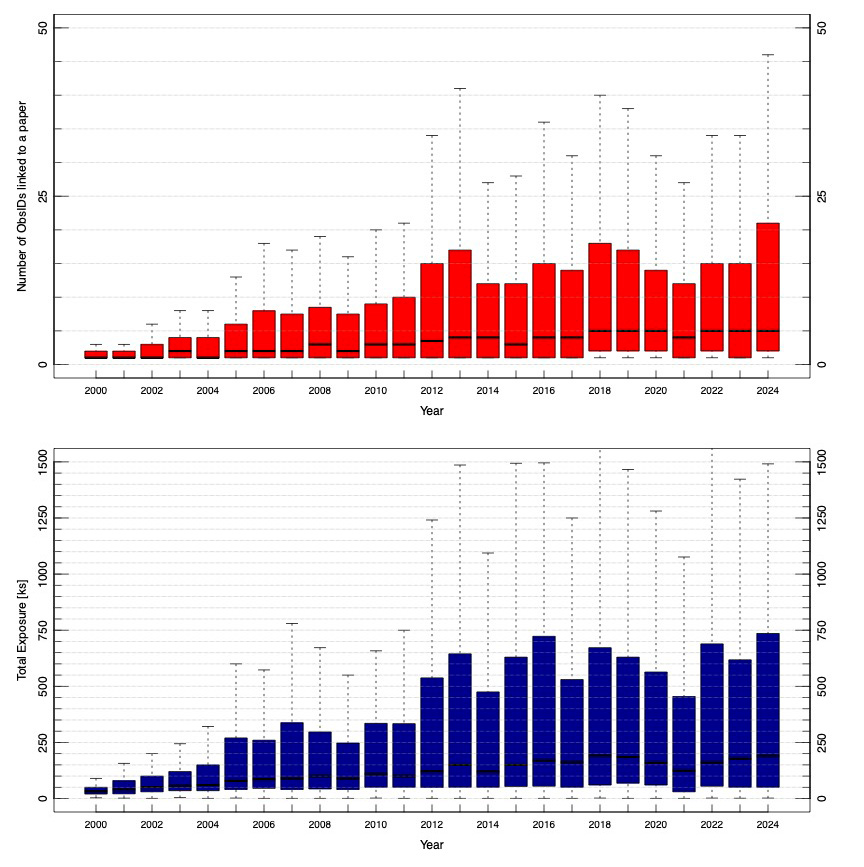
Although interesting, a static picture of data–literature linkage does not illuminate the potential evolution of data practices in the Chandra community over time. The number of ObsIDs linked to papers as a function of the paper’s publication year (Figure 2), on the other hand, has been slowly increasing from 1–2 in the first few years of the mission to ~5 in the past decade. A more marked increase is visible for the 3rd quartile of the distribution, which has grown to include 20 ObsIDs for 2024 publications (although data for 2024 are incomplete). The median length of single observations has remained relatively constant over the years from 2000 to 2021, with the recent decrease mostly driven by the adoption of Chandra Cool Targets (CCTs), a new category of typically numerous and short observations of targets located in regions of the sky that offer thermal relief to the spacecraft. For this reason, the growing “data complexity” of papers published over the last years cannot be entirely attributed to single programs being split into a larger number of ObsIDs more frequently than in the past for thermal or scientific reasons. A similar trend of increasing complexity is also visible—although with different magnitude—for specific types of programs (GOs, GTOs, TOOs, and DDTs) and different size categories (like Very Large Proposals), suggesting that the trend is driven by the same dynamics affecting how programs of all types and scales are used in the scholarly literature. Similarly to the total number of ObsIDs, the total exposure of all observations used in CSPs has slowly grown over time (Figure 2, lower plot); the median total duration has reached ~200 ks for papers in 2024 from ~50 ks in 2005, and the interquartile range now spans the 50 ks to 750 ks interval, compared to 50–250 ks in 2005.
The coordinated growth of the number and total duration of the observations linked to CSPs clearly indicates that the data content of scientific literature using Chandra has become more complex with time. A likely explanation of this trend is that, over the lifetime of the mission, the increasing availability of a growing mass of archival Chandra data has allowed scientists to focus on topics that require a large amount of freely reusable data, such as the time-dependent behavior of the same source observed multiple times, a comparative analysis of different sources of the same class, or the characterization of entire populations of astrophysical objects that can only be addressed via a statistical approach.

Figure 2: Upper: Box plot of the distribution of the number of ObsIDs linked to CSPs as a function of the year of the publication. Lower: Box plot of the distribution of total exposure (measured in ks) used in CSPs as a function of the year of the publication.
Archival science
The increase of the data complexity of Chandra-based publications hints at new venues for discovery being explored, but it only paints a partial picture of the importance of the archive as a multiplier of the total scientific production of the mission. The availability of large, well-curated, easily accessible public Chandra data has also expanded the community of astronomers who have produced scientific results using our mission. By comparing the list of authors of papers included in our bibliography with the Principal Investigators (PIs) and observers of approved Chandra programs, we have sorted CSPs into non-exclusive archival categories. Those papers using any data coming from programs whose key personnel are not among the papers' authors are labeled mixed archival, while papers where none of the Chandra data being used are connected with the authors are labeled purely archival. Using these definitions, we found that the fractions of fully archival and mixed archival CSPs have increased over the life of the mission to approximately 50% and 75%, respectively, of the total number of CSPs classified each year (Figure 3).

Figure 3: Fractions of the total Chandra Science Papers that are classified as mixed archival (light blue) and purely archival (dark blue) over the life of the Chandra mission.
These results show the pervasive reach of Chandra archival data in the recent scientific literature and highlight the multiplicative effect of the accumulation of data on the potential for discovery. With half of all recent CSPs solely based on data with no author–proposer linkages, the archive has emerged as an equalizing force facilitating the fruition of the X-ray Universe well beyond the relatively small community of PIs and their teams. Even for the additional ~25% of mixed archival papers, where some analyzed observations are directly linked to proposals submitted by one or more coauthors, archival data have emerged as crucial components that complement and enrich the more recent non-archival data, thereby helping scientists interpret results and draw conclusions.
Conclusions
This article highlights how the granular data–literature linkages that the Chandra bibliography has collected since the beginning of the mission can be used to reconstruct the evolution of data usage habits in the community. While more analysis is required to confirm the underlying dynamics, the obvious increase in the complexity of the data typically used in Chandra papers suggests that scientists have harnessed the longevity of the mission by exploring areas of the discovery space that would have not been accessible without the progressive accumulation of publicly available data. These results are consistent with the known positive effects of well-curated archives on the total scientific output of large observatories (see Peek et al. 2019) and further confirm that the commitment to support comprehensive archives is key to fulfilling the discovery potential of missions like Chandra.
References
Peek, J., Desai, V., White, R. L., et al. 2019, BAAS, 51, 105.