- ACIS DOSE registered-photon-map
- APR registered-photon-map in fits
Statistics:
#                IMAGE      NPIX      MEAN          RMS               MIN    MAX
  ACIS_apr01_total.fits    6004901    7.29          25.35             0.0   13341.0

 ACIS_apr_total I2 node 0  262654  3.750417        3.401383           0.0   122.0
 ACIS_apr_total I2 node 1  262654  4.430981        6.141572           0.0   206.0
 ACIS_apr_total I2 node 2  262654  4.927555        9.188547           0.0   280.0
 ACIS_apr_total I2 node 3  262654  5.290888        12.024307          0.0   360.0

 ACIS_apr_total I3 node 0  262654  4.970646        10.997835          0.0   326.0
 ACIS_apr_total I3 node 1  262654  4.556180        8.432973           0.0   263.0
 ACIS_apr_total I3 node 2  262654  4.105218        5.747690           0.0   189.0
 ACIS_apr_total I3 node 3  262654  3.490303        3.105829           0.0   108.0

 ACIS_apr_total S2 node 0  262397  8.728069        8.718063           0.0  3420.0
 ACIS_apr_total S2 node 1  262397  10.734936       28.476095          0.0   556.0
 ACIS_apr_total S2 node 2  262397  9.127189        15.801587          0.0  7806.0
 ACIS_apr_total S2 node 3  262397  8.736277        3.316634           0.0    28.0

 ACIS_apr_total S3 node 0  262397  25.395496       59.214019          0.0   648.0
 ACIS_apr_total S3 node 1  262397  36.661498       81.673445          0.0   670.0
 ACIS_apr_total S3 node 2  262397  11.123302       3.560568           0.0   101.0
 ACIS_apr_total S3 node 3  262397  10.491564       3.638493           0.0   148.0
- Apr 1999 - Apr 2001 registered-photon-map in fits
Statistics: # IMAGE NPIX MEAN RMS MIN MAX ACIS_total.fits 6004901 207.51 406.06 0.0 352522.0 ACIS_total I2 node 0 262654 120.283696 95.511875 29.0 9289.0 ACIS_total I2 node 1 262654 142.720907 198.267237 69.0 6432.0 ACIS_total I2 node 2 262654 161.700149 304.801281 84.0 8896.0 ACIS_total I2 node 3 262654 174.628980 405.755018 0.0 11095.0 ACIS_total I3 node 0 262654 188.679358 398.510372 99.0 10879.0 ACIS_total I3 node 1 262654 173.414614 295.307486 92.0 8567.0 ACIS_total I3 node 2 262654 146.021466 192.023550 32.0 6332.0 ACIS_total I3 node 3 262654 118.452713 85.055378 0.0 3420.0 ACIS_total S2 node 0 262397 247.604001 328.145441 71.0 51393.0 ACIS_total S2 node 1 262397 311.682691 799.431754 81.0 15791.0 ACIS_total S2 node 2 262397 273.066746 169.740641 85.0 81669.0 ACIS_total S2 node 3 262397 267.773641 56.941431 0.0 628.0 ACIS_total S3 node 0 262397 599.356391 606.837945 121.0 4485.0 ACIS_total S3 node 1 262397 724.897838 662.531501 0.0 69308.0 ACIS_total S3 node 2 262397 462.512624 132.586099 126.0 3136.0 ACIS_total S3 node 3 262397 392.987359 122.818262 0.0 2890.0 - APR 2001 dose GIF image
- APR I3 dose GIF image
- APR S3 dose GIF image
- TOTAL APR 1999 - APR 2001 dose GIF image
- TOTAL I3 dose GIF image
- TOTAL S3 dose GIF image
- APR registered-photon-map in fits
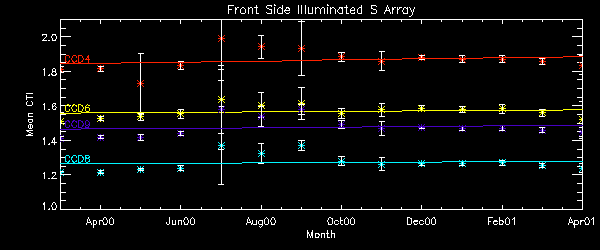
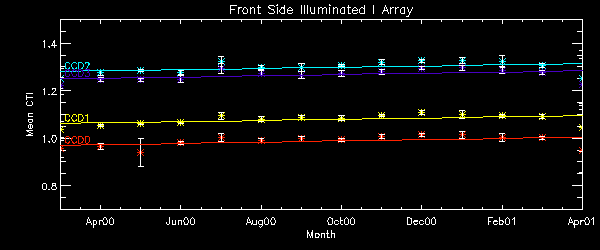
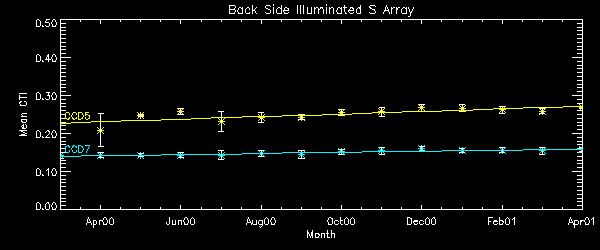
- The Mean CTI
Note: Temperature data selection changed.
Observations with cold radiator temperature deviation larger than 0.5 C
from the nominal value of -127.92905 C are dropped (after DOM 200).


Mean CTI observed when FPT~ -119 C and no Squeegy (average of 4 nodes per chip).
CTI's are computed for Mn K aplha, and defined as slope/intercept x10^4 of row # vs ADU.
Data file here


CTI Slope (after DOM 200) CTI slopes were computed for data point after DOM 200 and inside of 1 sigma deviation. Using only data point in 1 sigma range, we drop high temperature observations, squeegy observations, and other outliers. A independent variable is date, and a dependent variable is CTI. Note: Unit is cti/day from this month report. Front Side Illuminated S Array Node 0 Node 1 Node 2 Node 3 CCD4 2.408e-8 2.732e-8 3.147e-8 2.814e-8 CCD6 1.875e-8 2.286e-8 2.380e-8 2.076e-8 CCD8 1.900e-8 2.052e-8 2.045e-8 1.756e-8 CCD9 2.003e-8 2.416e-8 2.209e-8 1.865e-8 AVG 1.956e-8 Front Side Illuminated I Array Node 0 Node 1 Node 2 Node 3 CCD0 1.672e-8 2.127e-8 2.145e-8 1.857e-8 CCD1 1.827e-8 2.240e-8 2.125e-8 1.661e-8 CCD2 1.800e-8 2.338e-8 1.949e-8 1.689e-8 CCD3 1.710e-8 1.854e-8 1.968e-8 1.914e-8 AVG 1.750e-8 Detrended AVG 1.421e-8 Back Side Illuminated S Array Node 0 Node 1 Node 2 Node 3 CCD5 5.612e-9 6.617e-9 6.049e-9 2.158e-9 AVG: 4.786e-9 CCD7 3.102e-9 5.344e-9 5.354e-9 3.060e-9 AVG 4.387e-9
- Focal Plane Temperature
  The Mean (max) FPT: -113.95      std dev: 2.535
          mean width:    0.31      std dev: 0.10
DOY Focal Temp S.D. 89.81 -115.0 0.27 92.48 -111.5 0.54 -small shoulder on rising side 95.08 -114.4 0.31 97.77 -112.92 0.32 100.37 -115.51 0.44 -small shoulder on rising side 103.06 -113.89 0.29 105.96 -107.41 0.39 108.34 -115.51 0.25 111.01 -113.08 0.25 113.63 -115.51 0.26 116.27 -116.32 0.24 118.96 -116.32 0.21 
- Bad Pixel Candidates
Warm Pixels - new warm pixels observed this month are marked with "*" (due to change in warm pixel definition) The following front-illuminated pixels consistently showed a bias level more than 5 sigma away the chip's mean level during this period (Note:a definition of a warm pixel was changed to match with that of MIT).
CCD Quadrant Chipx Chipy * 5 1 232-245 313 * 5 2 509 1-31 5 3 607 281 5 3 716 718 5 4 1022 166-169 6 3 766 501 * 7 1 1-3 1-1024 * 7 2 510-515 1-1024 * 7 4 1022 1-1024 * 8 1 62 482 Hot Pixels - No new hot pixels observed this month.
Previously reported:
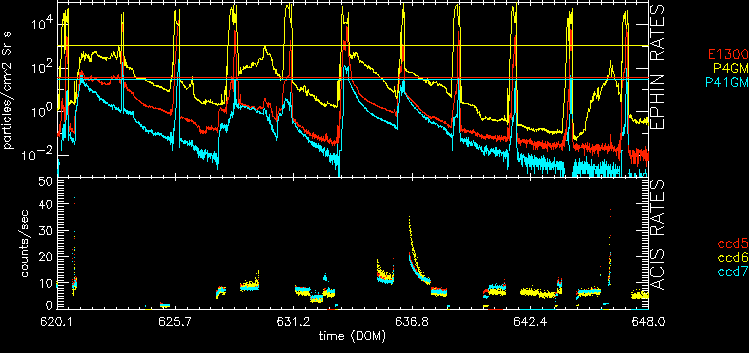
Pixel 716,718 of CCD5 Quad 3 and pixel 1022,166 of Quad 4 We define a hot pixel as a pixel with the count rate 1000 counts above the average- Acis Count Rate Plot This monitors the ACIS count Rate vs. EPHIN count Rate.
No sources are removed. For more CCDs and daily updates see: Ephin/Acis Info - Focal Plane Temperature

-
DOSE of central 4K pore-pairs
- APR HRC-I dose fits image
               IMAGE      NPIX      MEAN    STDDEV       MIN       MAX

        NO HRC-I OBSERVATATION THIS MONTH
- AUG 1999 - APR 2001 HRC-I dose fits image
             MAGE          NPIX      MEAN      STDDEV       MIN       MAX
HRCI_08_1999_04_2001.fits  16777216  1.10783   3.00555      0.0       462.0
- :APR HRC-S dose fits image
              IMAGE      NPIX      MEAN    STDDEV       MIN       MAX
  HRCS_04_2001.fits     16777216  0.01409   0.01387     0.0        12.0
- AUG 1999 - APR 2001 HRC-S dose fits image
IMAGE NPIX MEAN STDDEV MIN MAX HRCS_08_1999_04_2001.fits 16777216 3.38505 9.52601 0.0 1808.0 - APR HRC-I dose GIF image
- AUG 1999 - APR 2001 HRC-I dose PNG image
- APR HRC-S dose PNG image
- AUG 1999 - APR 2001 HRC-S dose PNG image