Chapter 1 | Chapter 2 | Chapter 3 | Chapter 4 | Chapter 5
Chapter 6 | Chapter 7 | Chapter 8 | Chapter 9
Appendix A | Appendix B

PREVIOUS INDEX NEXT

Chapter 9
LETG: Low Energy Transmission Grating

9.1  Instrument Description

The Low Energy Transmission Grating (LETG ) was developed under the direction of Dr. A.C. Brinkman in the Laboratory for Space Research (SRON) in Utrecht, the Netherlands, in collaboration with the Max-Planck-Institut für Extraterrestrische Physik (MPE) in Garching, Germany. The grating was manufactured in collaboration with Heidenhaim GmbH.
The Low Energy Transmission Grating Spectrometer (LETGS) comprises the LETG, a focal-plane imaging detector, and the High Resolution Mirror Assembly discussed in Chapter 4. The Chandra High Resolution Camera spectroscopic array (HRC-S) is the primary detector designed for use with the LETG. The spectroscopic array of the Chandra Advanced CCD Imaging Spectrometer (ACIS-S) can also be used, though with lower quantum efficiency below  ∼ 0.6 keV and a smaller detectable wavelength range than with the HRC-S. The High Energy Transmission Grating (HETG) used in combination with ACIS-S  offers superior energy resolution and quantum efficiency above 0.78 keV. The HRC is discussed in Chapter 7, the ACIS in Chapter 6, and the HETG in Chapter 8.
The LETGS provides high-resolution spectroscopy (λ/∆λ > 1000) between 80 and 175 Å (0.07-0.15 keV) and moderate resolving power at shorter wavelengths. The nominal LETGS wavelength range accessible with the HRC-S is 1.2-175 Å (0.07-10 keV); useful ACIS-S coverage is 1.2 to roughly 60 Å ( ∼ 0.20-10 keV).
A summary of LETGS characteristics is given in Table 9.1.
Table 9.1: LETGS Parameters
Wavelength range 1.2-175 Å (HRC-S)
1.2-60 Å (ACIS-S)
Energy range 70-10000 eV (HRC-S)
200-10000 eV (ACIS-S)
Resolution (∆λ, FWHM) 0.05 Å 
Resolving Power (λ/∆λ) ≥ 1000 (50-160 Å)
≈ 20×λ (3-50 Å)
Dispersion 1.148 Å/mm
Plate scale 48.82 μm/arcsec
Effective area (1st order) 1-25 cm2 (with HRC-S)
1-100 cm2 (with ACIS-S)
Background (quiescent) LETG/HRC-S: Typically 10 (25) cts/0.07-Å/100-ksec @ 50 (175) Å
(after background filtering), where typical means 0.10 cts/pixel/100-ks
LETG/ACIS-S: << 0.01 cts/pixel/100-ks (order sorted)
Detector angular size 3.37' × 101' (HRC-S; standard 6-tap-wide spectroscopy region)
8.3' × 50.6' (ACIS-S; full 6-chip array)
Pixel size 6.43 × 6.43 μm (HRC-S)
24.0 × 24.0 μm (ACIS-S)
Temporal resolution 16 μsec (HRC-S in Imaging Mode, center segment only)
 ∼ 10 msec (HRC-S in default mode)
2.85 msec-3.24 sec (ACIS-S, depending on mode)
Rowland diameter 8637 mm (effective value)
Grating material gold
Facet frame material stainless steel
Module material aluminum
LETG grating parameters
    Period 0.991216 ±0.000087 μm
    Thickness 0.474 ±0.0305 μm
    Width (at bar middle)0.516 ±0.0188 μm
    Bar Shape symmetric trapezoid
    Bar Side Slope 83.8 ±2.27 deg
Fine-support structure
    Period 25.4 μm
    Thickness 2.5 μm
    Obscuration < 10%
    Dispersion 29.4 Å/mm
    Material gold
Coarse-support structure
    Triangular height 2000 μm
    Width 68 μm
    Thickness < 30 μm
    Obscuration < 10%
    Dispersion 2320 Å/mm
    Material gold

9.1.1  Scientific Objectives

The LETGS provides the highest spectral resolving power ( > 1000) on Chandra at low (0.07-0.2 keV) energies. High-resolution X-ray spectra of optically thin plasmas with temperatures between 105 and 107 K, such as stellar coronae, reveal a wealth of emission lines that provide diagnostics of temperature, density, velocity, ionization state, and elemental abundances and allow precise studies of structure, energy balance, and heating rates. Absorption features provides similar information in cases where bright compact X-ray sources are embedded in cooler, extended gas clouds.
The high resolution (∆λ ≈ 0.05 Å) of LETGS  spectra at longer wavelengths (> 100 Å) also permits detailed studies of spectral line profiles in the X-ray region. These studies may provide non-thermal velocities of stellar coronae, flow velocities along active-region loops, orbital velocities in X-ray binaries, and upflow velocities in stellar flares. The LETGS also allows time resolved spectroscopy, 1-D spatially resolved spectra, and spectra of multiple point sources within its  ∼ 4 arcmin field of best focus .
Since the ultimate spectral resolution can only be achieved for point sources, the prime candidates for study in the Galaxy mainly comprise stellar coronae, white dwarf atmospheres, X-ray binaries, and cataclysmic variables. Extragalactic sources include relatively bright active galactic nuclei (AGN) and cooling flows in clusters of galaxies.

9.1.2  Heritage

Flat transmission gratings were flown aboard Einstein and EXOSAT. The LETG grating elements are produced using a technique similar to that used for production of the EXOSAT gratings. However, the LETG shares only basic operating principles with earlier instruments. Advanced grating technology has enabled the achievement of greater efficiency and increased dispersion. The Rowland geometry (see Figure 8.4) of the grating plate and spectroscopic arrays reduces dispersed image aberrations and hence contributes to improved spectral resolution.

9.1.3  Operating Principles

When inserted behind the HRMA, the LETG diffracts X-rays into a dispersed spectrum according to the grating diffraction relation, mλ = psinθ, where m is the integer order number, λ the photon wavelength, p the spatial period of the grating lines, and θ the dispersion angle. Parameters are summarized in Table 9.1. The grating facets are mounted on an aluminum support plate which has been machined so that the centers of individual grating facets lie on a Rowland torus. The grating facets are aligned to produce a single dispersed image. Spectral resolution is determined, among other factors, by grating line density, line density variations, HRMA point-spread function, pointing stability, alignment accuracy, pixel size of the read-out detector, and detector geometry.

9.1.4  Physical Configuration

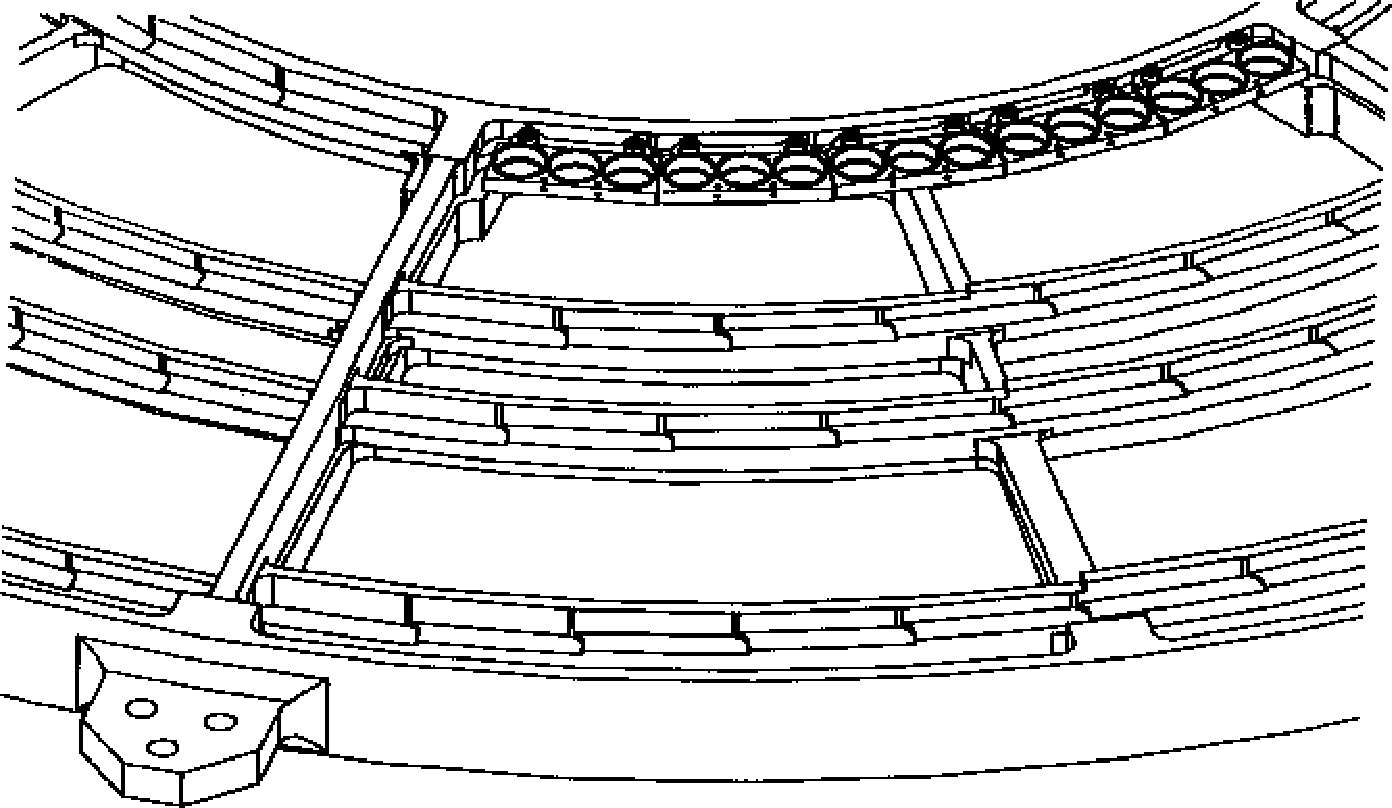
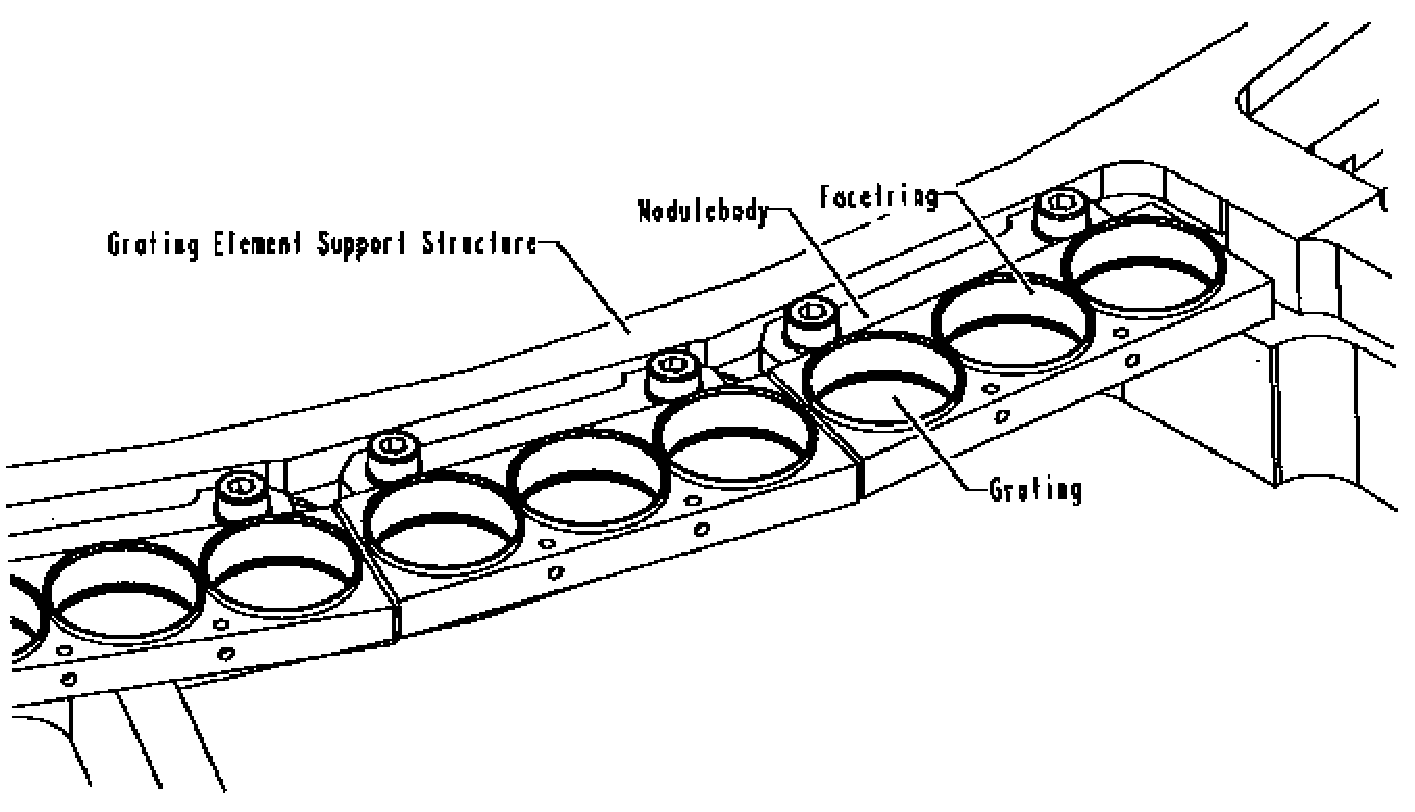
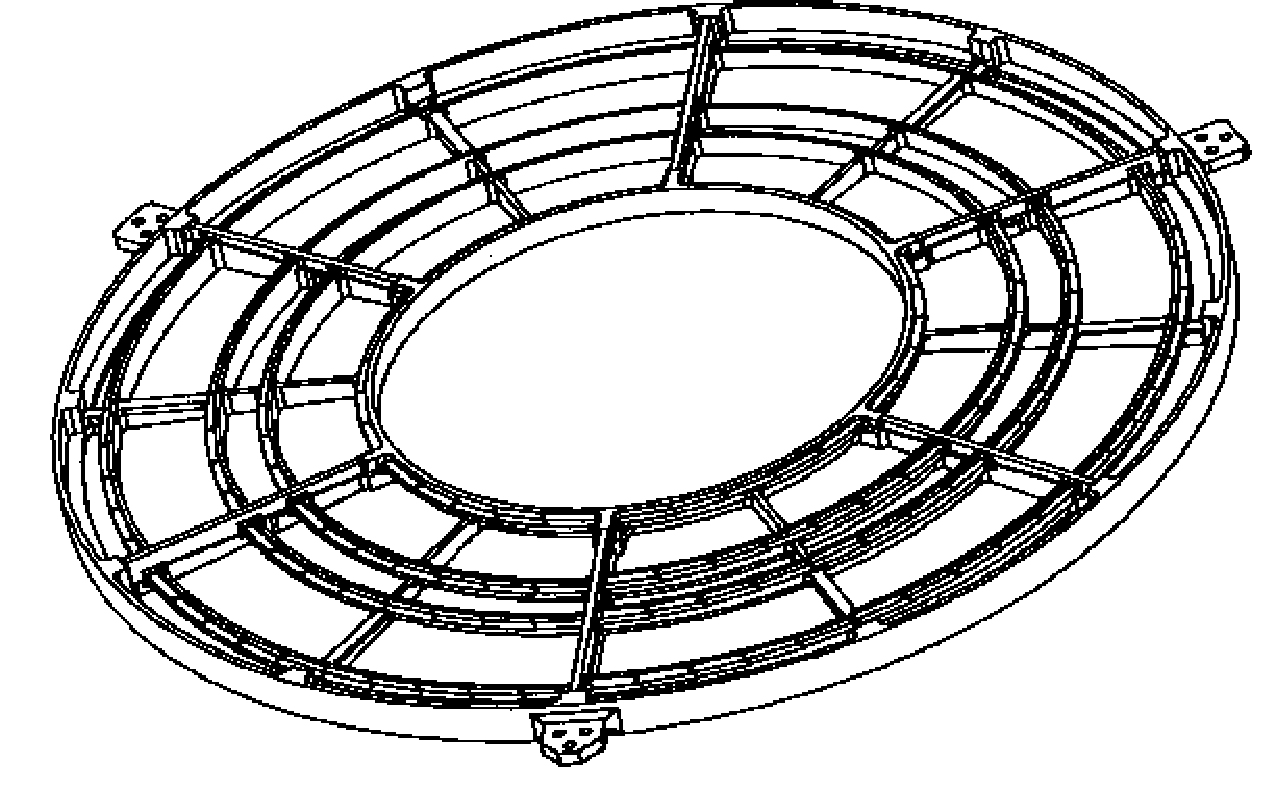
When the LETG is used, the Grating Element Support Structure (GESS ), an aluminum frame approximately 110 cm in diameter and 6 cm thick, is inserted  ∼ 300 mm behind the exit aperture of the HRMA and 1.4 m behind the HRMA mid-plane. The GESS holds approximately 180 trapezoidal grating modules, which measure about 13 × 50 mm. A design drawing of the full GESS is shown in Figure 9.1; a closer view, showing some mounted modules, is seen in Figure 9.2. Figure 9.3 shows empty grating modules mounted on the GESS. Each grating module holds three circular grating facets, each of which comprises approximately 80 of the triangular grating elements seen in Figure 9.4.
images/gess-1.png
Figure 9.1: LETG Grating Element Support Structure, a machined aluminum plate approximately 110 cm in diameter that holds grating modules on a Rowland torus behind the Chandra mirrors.
images/gess-2.png
Figure 9.2: Detail of the LETG Grating Element Support Structure showing grating modules mounted on the inner annulus.
images/gess-modules.png
Figure 9.3: A closeup view of the LETG GESS showing nearly three complete grating modules. Each module holds three circular grating facets, and each facet contains approximately 80 triangular grating elements.
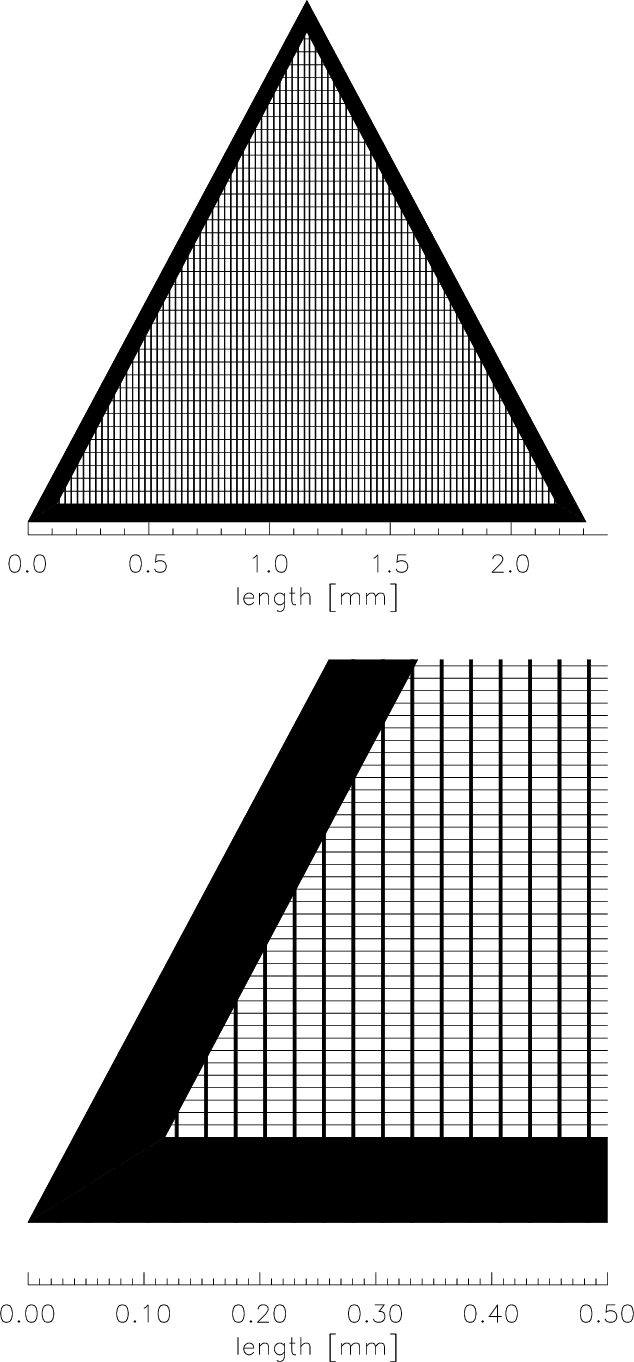
In contrast to the HETG gratings, which have a thin polyimide substrate, the LETG gratings are free-standing wires held by a support mesh. Within each grating facet the grating bars are supported by perpendicular "fine support" bars and triangular "coarse support" bars. The parameters of these structures are given in Table 9.1. A schematic of the grating structure is shown in Figure 9.4. Both the fine and coarse grating supports act as long-period transmission gratings themselves. As discussed in Section 9.3.7 and illustrated in Figures 9.23, 9.24, and 9.27, the fine support produces a dispersion pattern perpendicular to the grating dispersion direction and the coarse support produces a six-pointed star pattern.
images/letg-facet.png
Figure 9.4: LETG  facet structure schematic showing the basic shape of the individual grating elements and the relative sizes of the support structures. The upper view shows the complete grating element, which comprises the triangular coarse support, the vertical fine supporting bars, and the (horizontal) grating bars. The grating bars themselves are not shown to scale. In the upper view every 50th grating bar is drawn, in the lower view every 10th bar.
Since the gratings are produced from a single master mask, there is negligible variation in the period between facets. The thickness of the gold of the grating bars on top of the support mesh determines the "phasing," or efficiency of redistribution of photons into each spectral order in wavelengths where the gold is partially transparent. The thickness is designed to optimize the 1st order response at energies of interest.
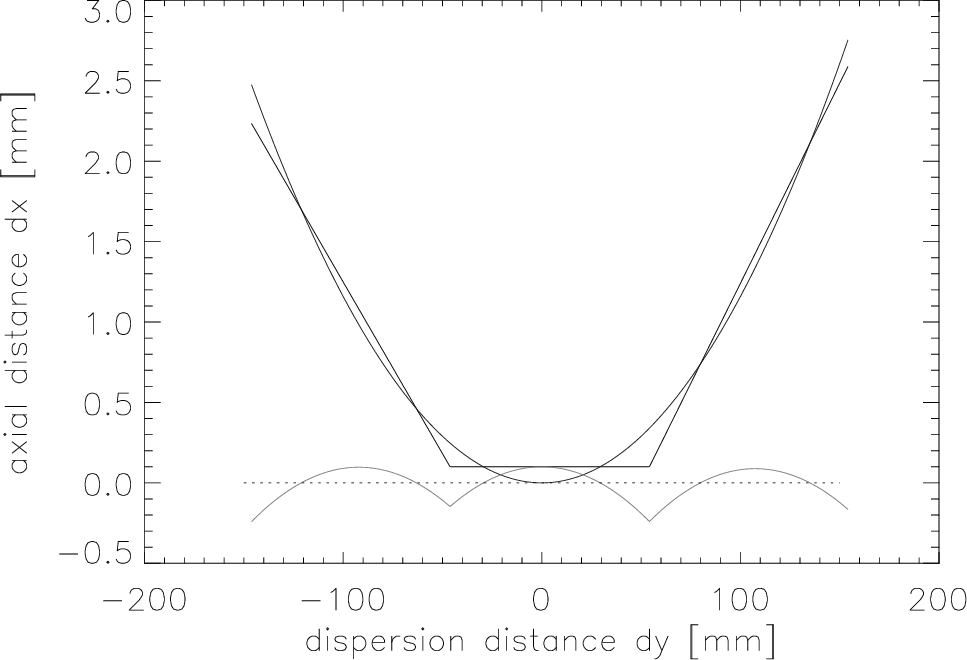
To reduce aberrations, the GESS is shaped to follow the Rowland torus. The basics of the Rowland geometry are shown in Figure 8.4. The primary read-out detector (HRC-S ) is made of three tilted array segments which also follow the Rowland circle in the image plane (see Figures 7.2 and 9.5). Because the detector array elements are flat, the distance from the Rowland circle changes with position, and so the spectral resolution changes very slightly with wavelength. The secondary read-out detector, ACIS-S, has 6 CCDs, each of which is only one-quarter as long as an HRC-S segment, so the ACIS-S array follows the Rowland circle even more closely.
images/hrcs_dev_rowland.png
Figure 9.5: The front surfaces of the HRC-S detector segments and their relationship to the Rowland circle are shown schematically. The scalloped line beneath them is the difference between the detector surface and the Rowland circle.

9.2  Calibration

9.2.1  Pre-Launch Calibration

Prior to assembly, individual grating elements were tested using a visual light spectrograph at the MPE. Laboratory calibration of grating period and resolution was performed for individual grating elements at optical wavelengths and extrapolated to the X-ray range. Grating efficiencies at X-ray wavelengths were modeled using near-infrared spectrophotometry and verified by X-ray measurements of a sample of facets. Grating facet and module alignment was also tested. LETGS efficiency, resolution, and line response function were tested at the X-ray Calibration Facility at MSFC in Huntsville, AL for both ACIS-S and HRC-S configurations. Absolute energy scale and off-axis response were also measured. Efficiency and the Line Spread Function (LSF) of the LETG and HRMA/LETG subsystem were characterized using a detector system designed for HRMA calibration, the HRMA X-ray Detection System (HXDS). Details may be found in the XRCF Final Report at https://cxc.harvard.edu/cal/Hrma/XRCFReport.html.

9.2.2  In Flight Calibration

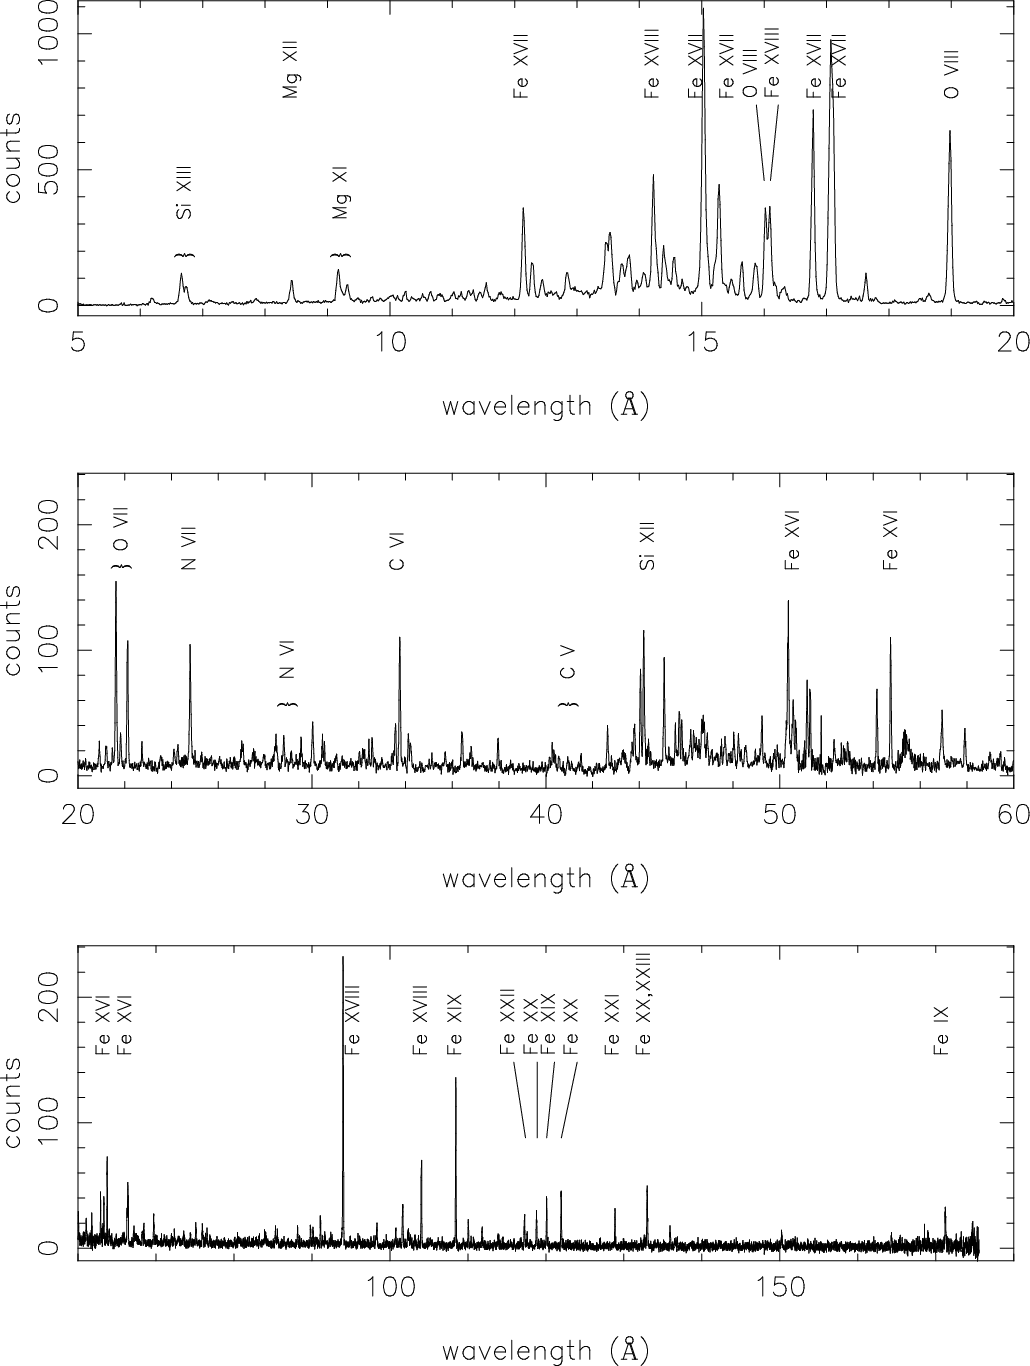
In-flight calibration of the LETGS, along with its primary detector, the HRC-S, is planned and executed by the CXC LETG team. LETG first-light and focus observations were of the active late-type binary Capella whose coronal spectrum is rich in narrow spectral lines (see Figure 9.26). Spectra of Capella, the late-type star Procyon (F5 IV), and serendipitous Guest Observer targets have been used in calibration of the LETG dispersion relation, resolving power, line response function, and grating-detector alignment.
Calibration of the LETGS effective area (EA) and HRC-S quantum efficiency (QE) at energies above the C-K edge (0.28 keV, 44 Å) relies primarily on observations of the quasar continuum source PKS 2155-304 and, earlier in the mission, of 3C 273 and Capella. PKS 2155-304 also has been regularly observed with LETG/ACIS-S to monitor contamination buildup on ACIS (see Section 6.5.1) and for cross calibration with other X-ray missions. Mkn 421 largely replaced PKS 2155-304 as an ACIS contamination monitoring source starting in 2010. RX J1856 (neutron star continuum source) is also used for contamination monitoring. For calibration of the LETG/HRC-S EA at longer wavelengths, observations of the hot DA white dwarfs HZ 43 and Sirius B are used.
Early in the mission, most calibration targets were observed at least twice per year to monitor LETGS operation, but calibration observations are now less frequent. Regularly observed sources and monitoring frequencies are listed in Table 9.2. Other targets are occasionally observed to meet specific calibration needs that might arise, and ACIS-S and HRC-S (see Table 7.5) are routinely calibrated by themselves (i.e., without gratings).
Table 9.2: Routine LETGS Calibration Monitoring Observations
TargetFreq. (yr−1)Purpose
Capella 1 LETG/HRC-S LRF, dispersion relation, QE, EA
PKS 2155-304 1 LETG/ACIS-S EA, ACIS-S contam, cross calib with XMM, Suzaku
Mkn 421 1 LETG/ACIS-S and LETG/HRC-S EA, ACIS-S contam, HRC-S gain
RX J1856-3754 1 LETG/ACIS-S EA and ACIS-S contam
HZ 43 1 LETG/HRC-S EA and HRC-S gain

9.3  LETGS Performance

9.3.1  Usage

Overview

The primary use of the LETG is for on-axis observations of point sources, which produce a zero-order image and a dispersed spectrum. Typical LETGS observations range from a few tens to several hundred ks. To reduce the (small) risk that the grating mechanism might fail, its frequency of use is minimized by grouping grating observations into consecutive time blocks whenever possible.
The net LETG transmission is  ∼ 28% at energies below  ∼ 1 keV (about 12.5% for zeroth order, the same for 1st order, and a few percent for all other orders) so count rates are usually not a concern with respect to exceeding detector limits or telemetry saturation. However, some bright sources (e.g. Sco X-1) if observed for long exposure times could cause significant charge depletion in the HRC MCPs (see Chapter 7, especially Section 7.14), and even moderate rates may cause pile-up problems when using ACIS-S (see Sections 6.16 and 9.4.1). Some observers may find it useful to insert the LETG for imaging observations simply to reduce the detected photon count rate.

Detectors

In standard operation, the LETGS uses either the HRC-S or ACIS-S as its detector. The LETG+HRC-S  covers a wavelength range of approximately −165 to +175 Å in 1st order for on-axis sources. This wavelength range can be shifted somewhat by offset pointing, but image quality degrades substantially beyond about 2 arcmin. The HRC-S does not have sufficient energy resolution to allow sorting of overlapping spectral orders.
In rare cases it might be useful to use the HRC-S Low Energy Suppression Filter (LESF), as discussed in Section 9.4, in order to obtain a predominantly higher-order (m > 1) spectrum. The LESF is a region on the HRC-S UV/Ion Shield (UVIS) where the aluminum coating is relatively thick, and corresponds to the upper part of the "T" in Figure 7.1. Note that the Al coating on the LESF is thicker on the outer plates than on the central plate. See Figures 9.17 and 9.19 for the effect of the LESF on 1st and higher order effective areas.
When used with the ACIS-S detector, the effective LETGS wavelength coverage is reduced because of the smaller detector size in the dispersion direction (ACIS-S is only half as long as the HRC-S) and the fact that the three outermost chips (S0, S4, and S5) now have essentially zero QE for detecting 1st order LETG photons because of absorption by contaminant on ACIS (see Figure 9.6). Another consideration is that ACIS has worse temporal resolution than HRC, which may be important when observing periodic or rapidly varying sources. On the other hand, ACIS has a much lower background and its intrinsic energy resolution allows easy separation of diffraction orders. Note that the CTI-degraded energy resolution of the ACIS FI CCDs (Section 6.7) does not pose a problem for LETG point-source observations, because order separation effectively eliminates energy uncertainties.
images/letg_perf_acissQE.png
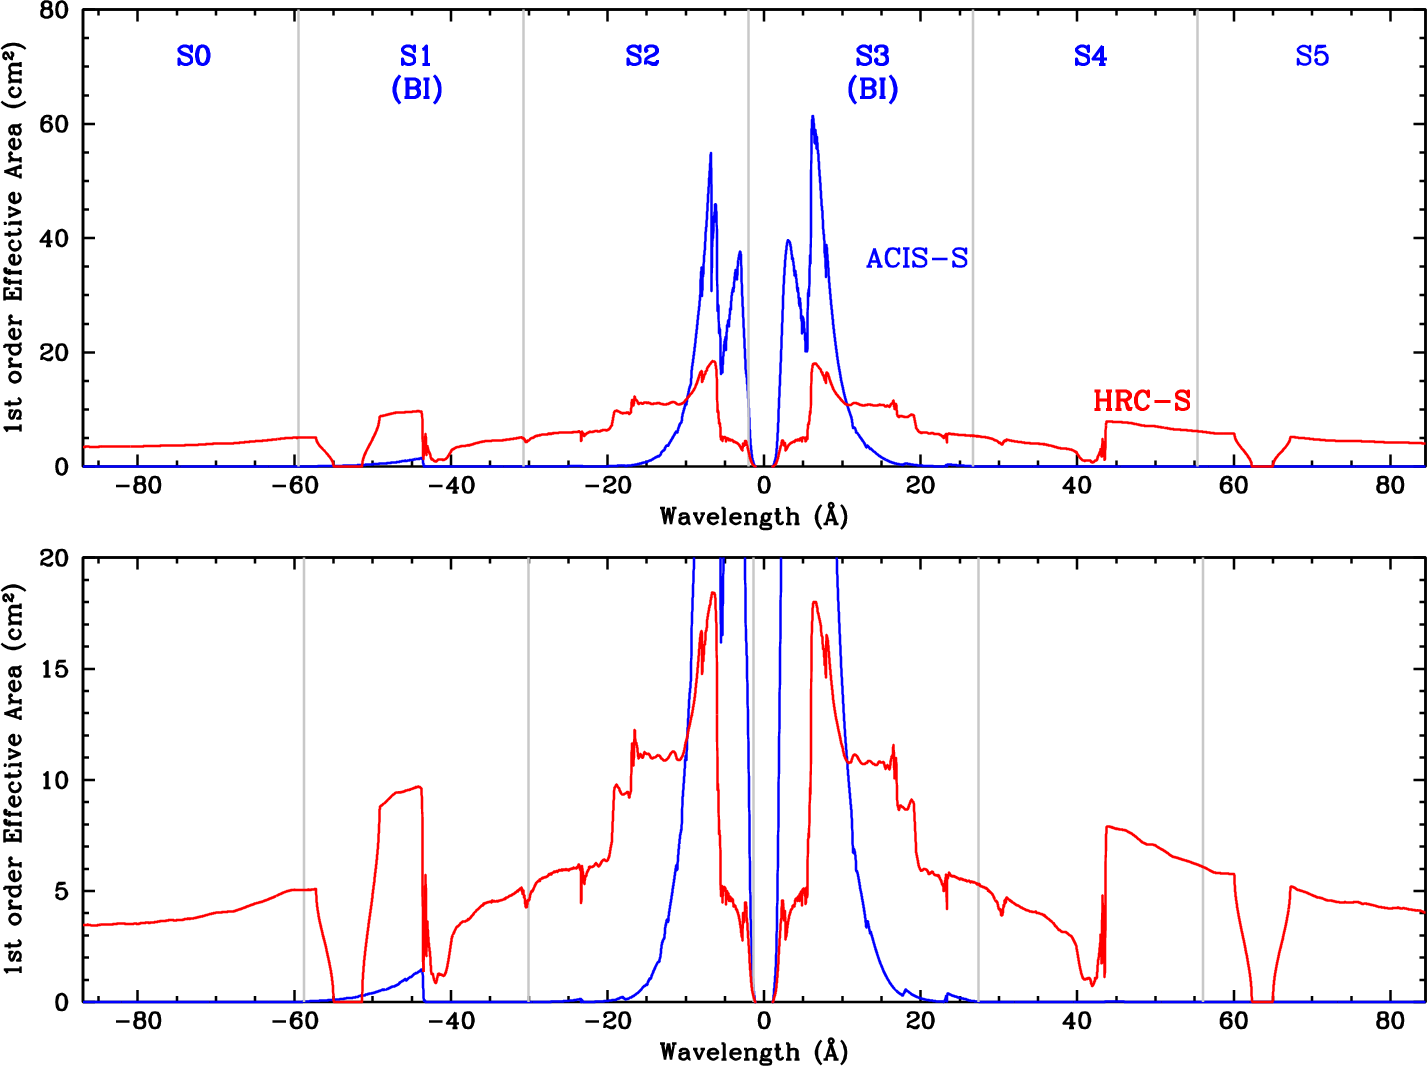
Figure 9.6: LETGS 1st order effective area (EA) with ACIS-S and HRC-S, showing plus and minus orders separately; lower panel shows low-EA regions in more detail. The effects of dither and ACIS bad columns are included. Gray vertical lines mark ACIS chip boundaries, and HRC plate gaps appear near −53 Å and +63 Å. ACIS curve is for Y-offset=+1.07 arcmin (with current dither aimpoint; see Section 6.11) and HRC curve is for Y-offset=0 arcmin.See Section 9.4.2/SIM-Z Offsets and Offset Pointing for more information regarding the choice of ACIS row and Y-offset. The LETG+HRC EA is currently decreasing a few percent per year at all wavelengths, while the LETG+ACIS EA is slowly falling because of increasing contamination on the ACIS Optical Blocking Filters. See also Figure 9.17, which plots effective areas for combined plus and minus orders. Note that the HRC-S high voltage was raised in Sep 2024, and the LETG/HRC-S curve is appropriate for then. If Effective Area trends are similar to before the HV increase, EA will be roughly 10% lower by mid 2026.
In some special cases, the HRC-I may also be used with the LETG. A detailed discussion of the various merits of LETGS detector choices from a point of view of proposal planning is given in Section 9.4.

Off-Axis and Multiple Sources

Because the LETGS is essentially an objective-grating system, it is possible to do multi-object spectroscopy, although, as noted above, the point-spread function degrades rapidly off-axis. To include or reject secondary sources, or to avoid overlapping diffraction from multiple sources, observers may specify the orientation (roll angle) of the grating dispersion direction on the sky (see Chapter 3). Observations of extended sources are also possible, but at the expense of resolving power and with the loss of the simple relation between position and energy. In angular extent, the standard HRC-S spectroscopy read-out region is 3.37 arcmin × 101 arcmin, and the full ACIS-S array covers 8.3 arcmin × 50.6 arcmin. In special cases, a different HRC-S detector "window" (up to twice as wide in cross-dispersion) may be selected, as described in Section 9.4.

9.3.2  Wavelength Coverage and Dispersion Relation

The active extent of the HRC-S in the dispersion direction is 296 mm, almost exactly twice that for the ACIS-S. The nominal zeroth-order aimpoints for each detector are slightly offset from the detector center so that gaps between the three HRC-S segments (six ACIS-S segments) will occur at different wavelengths in negative and positive orders. A Y-axis offset (along the dispersion axis) of +1.1 arcmin is recommended for most LETG+ACIS-S observations in order to shift coverage of longer wavelengths onto the backside-illuminated S1 and S3 chips, which have higher QE at low energies than the other ACIS-S chips.
With a dispersion of 1.148 Å/mm for the LETG, the standard wavelength range of the LETGS with HRC-S is −163 Å to +175 Å. Physical coverage with ACIS-S extends from −88 to +84 Å when using Y-offset=+1.1 arcmin, but the poor low-E response of the outlying front-illuminated chips limits the effective wavelength range to −59 Å for negative 1st order and less than about +15 Å for the positive order (see Figure 9.6). Outlying chips may be useful, however, for collecting higher-order spectra.

Off-Axis Pointing and Detector Gaps

Wavelength coverage can be adjusted (increasing the wavelength range on one side and decreasing on the other) by changing the central offset (the observatory Y coordinate-see the discussion in Chapter 3) although spectral resolution degrades rather quickly beyond about 4 arcmin from the optical axis. From the information in Table 9.1, one can derive the relationship between angular offset (in the dispersion direction) and wavelength as 3.36 Å per arcmin, so an offset of 10 arcmin would stretch the positive order HRC-S coverage to approximately 210 Å (60 eV). While the vast majority of LETG observations have been made with offsets of less than 2 arcmin, flight LETG calibration data have been collected at 5 arcmin off-axis (for resolution testing) and 10 arcmin off-axis (for effective area calibration).
As noted in Section 9.3.2, there are gaps between detector segments which create corresponding gaps in the wavelength coverage of each order. The gaps in + and − orders do not overlap so that the combined wavelength coverage is continuous. The locations of the gaps (neglecting the effects of dither) are listed in Table 9.3, which also lists the locations of the HRC-S UV/Ion Shield inner "T" filter edges. Dithering the spacecraft will partially smooth these gaps, but observers may wish to adjust the source pointing if a line of interest falls in a gap, or to tune the wavelength coverage of the higher-QE back-illuminated (S1 and S3) ACIS-S chips. Standard HRC dither amplitude (full width, in both directions) is 40 arcsec (1.95 mm), which covers 2.3 Å, and standard full-width ACIS dither (changed in 2023) is 32 arcsec (1.56 mm), or 1.8 Å.
Please see the "Checking your LETG/ACIS Obscat Setup" web page at https://cxc.harvard.edu/cal/Letg/ACIS_params. An interactive tool for visualizing spectral feature placement on the ACIS array as a function of Y-offset and source redshift is available there.
Detector Section Energy Wavelength
(eV) (Å)
HRC-S  UVIS Inner T (thick Al) (650) - 730  (19) - 17 
HRC-S  seg-1 (neg. mλ) (75) - (221) (164) - (56)
HRC-S  seg0 (245) - 203  (50) - 61 
HRC-S  seg+1 (pos. mλ) 188 - 71  66 - 175
ACIS-S  S0 (neg. mλ) (141) - (207)(87.9) - (59.7)
ACIS-S  S1 (Back-illuminated) (210) - (400)(59.2) - (31.0)
ACIS-S  S2 (407) - (5300)(30.4) - (2.3) 
ACIS-S  S3 (Back-illuminated) (7300) - 469    (1.7) - 26.4
ACIS-S  S4 460 - 225 27.0 - 55.1
ACIS-S  S5 (pos. mλ) 223 - 148 55.7 - 83.8
Table 9.3: LETG Position-Dependent Spectral Coverage (1st Order). Energies and wavelengths for the negative order are given in parentheses. Listed values are for the most commonly used pointing (on-axis for HRC-S and Y-offset = +1.2 arcmin for ACIS-S) without dither. Standard dithering affects ±1.1 Å on the edge of each HRC-S segment and ±0.90 Å on the edge of each ACIS chip. Uncertainties are of order 0.5 Å and arise mostly from thermally induced pointing errors, which have been increasing over time; shifts of  ∼ 1 Å have been seen. Note that the QE for FI ACIS chips is much lower than for BI chips at low energies, rendering S0, S4, and S5 of limited use (see Figure 9.6). Please see https://cxc.harvard.edu/cal/Letg/ACIS_params for up-to-date and detailed information regarding offset pointing, wavelength ranges, and pointing errors.

Dispersion Calibration

Overall wavelength calibration is accurate to a few parts in 10000 across the full wavelength range of the instrument, and the Rowland diameter has remained stable since launch. The RMS deviation between observed and predicted wavelengths for a set of relatively unblended lines observed in Capella spectra amounts to 0.013 Å, after correction for the relative spacecraft and Capella radial velocity differences. Through analysis of accumulated calibration and general observer (GO) observations, some remaining differences between predicted and observed line wavelengths have been found to be caused by small event position errors at some locations on the HRC-S detector.
Position errors occur in both dispersion and cross-dispersion axes, though for spectroscopy the latter are usually not important because data are generally summed in the cross-dispersion direction. The magnitude of position errors in the dispersion axis for the central HRC-S plate range from 0 to  ∼ 0.05 Å, with typical errors of  ∼ 0.01-0.02 Å. The outer plates ( > 60 Å ) tend to exhibit larger errors of typically  ∼ 0.02-0.08 Å. The size of the position errors changes over spatial scales of the HRC read-out taps, which are 1.646 mm apart (see Chapter 7 for details of the HRC). Spacecraft dither moves dispersed monochromatic photons of a given order over a region of the detector that is roughly 2mm square. Within any given dither region, then, monochromatic light will fall on detector regions that have different position determination errors. As a result, a narrow spectral line could suffer some distortion of its line profile and/or a small shift of its apparent wavelength. Such distortions or shifts could occur at the spacecraft dither frequency (see Chapter 5); observers should therefore exercise caution in interpretation of such periodic effects. Care should also be taken when interpreting the results of combined spectra from + and − orders, since these effects are not symmetrical about zeroth order.
The position errors appear to be stable in detector coordinates and to repeat in different observations for which the aimpoints are very similar. An empirical correction for the effect based on accumulated calibration and GO observations has been derived and is implemented in CALDB 3.2.0 as part of the HRC-S degap map. Details on the derivation of the wavelength corrections can be found on the "Corrections to the Dispersion Relation" page at https://cxc.harvard.edu/cal/Letg/Corrlam. After correction, the RMS deviation between observed and predicted line wavelengths observed in Capella are reduced from 0.013 to 0.010 Å across the entire wavelength range of the instrument. Corrections for the outer plates ( > 60 Å) are much less effective owing to a lack of reference lines with adequate signal-to-noise ratio. For the central plate alone, the RMS deviation amounts to 0.006 Å.
For the purposes of observation planning, it should be assumed that individual observed line wavelengths could be in error by up to about 0.02 Å for λ < 60 Å, and 0.05 Å for λ > 60 Å. Despite the observed repetition in pattern from observation to observation, observers are reminded that the exact wavelength error for any given line depends on the exact position of the target on the detector. Small differences in actual aimpoint that occur naturally between observations as a result of uncertainties in aspect and target acquisition (see Chapter 5) mean that wavelength shifts for a specific line are not generally repeatable from one observation to another and might also be subject to small secular trends.

9.3.3  Resolving Power

The dominant contribution to the LETGS line response function (LRF) and instrument resolving power is the HRMA point-spread function (PSF), which is  ∼ 25 μm FWHM, depending on energy. The next most important factor is the detector PSF, which is  ∼ 20 μm FWHM for the HRC-S, with 6.43-μm-wide pixels; ACIS pixels are 24 μm wide. Uncertainties in correcting photon event positions for the observatory aspect, which occurs during ground data processing, adds a small contribution of order a few μm. Finally, the small errors in event position determination resulting from HRC-S imaging non-linearities described in Section 9.3.2 can lead to some distortion of spectral line profiles. These effects are difficult to quantify in detail but are estimated to affect the line FWHM by less than 25%.
When all these effects are combined, the LETGS line response function is generally  ∼ 40 μm FWHM. With a conversion of 1.148 Å/mm for the LETG, a good figure of merit for LETGS resolution is therefore 0.05 Å. Because the three segments of the HRC-S can not perfectly follow the Rowland circle (see Figure 9.5), however, resolution varies slightly along the detector, and is lowest near the ends of each detector segment. Resolution degradation is almost negligible when using the ACIS-S, since its six segments more closely follow the Rowland circle, although the coarser ACIS pixel size (24 μm vs.  ∼ 40 μm FWHM LRF) means that line profiles are barely adequately sampled. A plot of LETGS resolving power for an on-axis point source, based on results from an observation of Capella, is shown in Figure 9.7.
images/letg_res_nre.png
Figure 9.7: LETG spectral resolving power, as derived from observations of Capella (ObsIDs 1248, 1009, 58) and Procyon (ObsIDs 63, 1461) with the HRC-S. The analysis is based only on spectral lines thought not to be affected significantly by blending at the LETGS resolution. Measured line widths were corrected for source orbital, rotational, and thermal motions. The dashed line is an optimistic error budget prediction calculated from pre-flight models and instrument parameters. The conservative solid curve is based on in-flight values of aspect, focus, and grating period uniformity. The deviations from approximate linearity near ±60 Å and at the longest wavelengths arise from deviations of the HRC surface from the Rowland circle (see Figure 9.5). Deviations in the experimental data from a smooth curve are likely caused by hidden blends not predicted by the radiative loss model and by detector imaging nonlinearities discussed in Section 9.3.2.
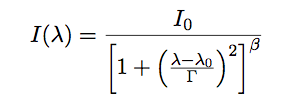
Plots of fits to the LETG+HRC-S LRF at zeroth order and of Fe XVII and XVIII lines at  ∼ 17 and 94 Å are given in Figures 9.8 and 9.9. The fitted form is a Moffat function:
Equation 9.1
(9.1)
where λ0 is the wavelength of the line center and Γ is a measure of the line width. The relation between Γ and the line FWHM depends on β. For a Lorentzian profile, or β = 1, the profile FWHM is Γ/2. For the value β = 2.5 recommended here, FWHM  ≈ 1.13Γ.
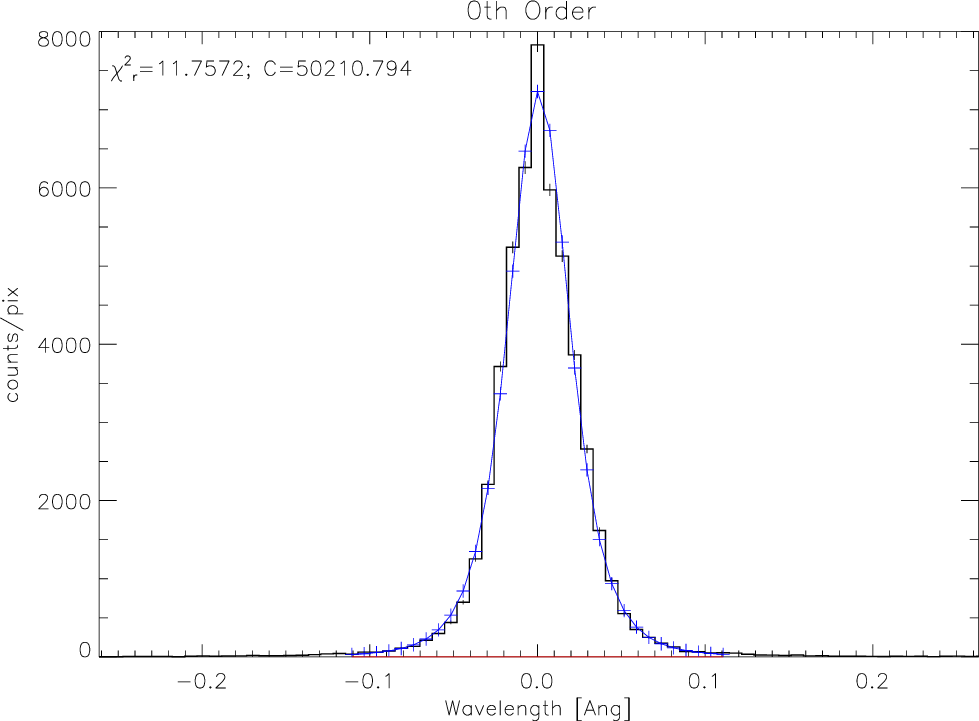
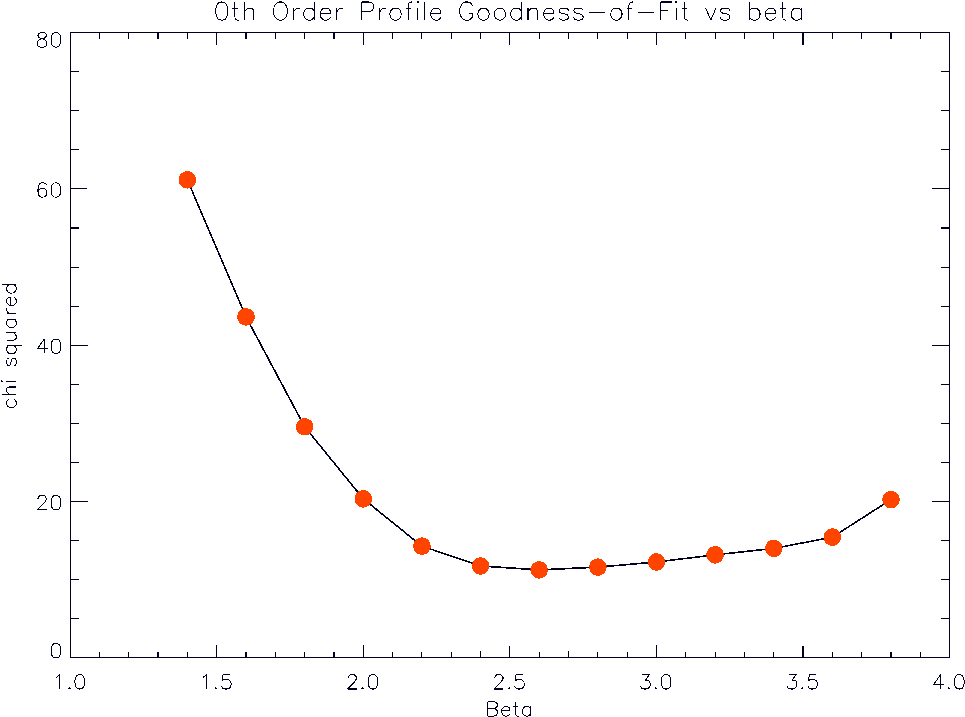
Figure 9.10 illustrates the χ2 of fits to the zeroth order profile versus β, and shows a best-fit profile with an index of  ∼ 2.5. (Note that β = 1.0 yields a Lorentzian profile.) The best fit to the very high signal-to-noise-ratio zeroth order profile is far from being statistically satisfactory. However, spectral lines seen in first order generally contain orders of magnitude fewer counts than in the zeroth order of the well-exposed calibration spectrum shown, and the Moffat function nearly always provides a good match. Line response functions can also be generated within CIAO in the RMF FITS format. These are based on ray trace simulations using the MARX program and generally match observed line profiles to a level of 10% or better once intrinsic source broadening terms have been taken into account. Observers wishing to use line profile shapes as a diagnostic tool should keep in mind that, in the case of LETG+HRC-S observations, non-linearities in the HRC-S imaging can lead to significant distortions of observed line profiles (see Section 9.3.2).
images/letg_zero_PSF.png
Figure 9.8: Observed LETG zeroth-order LRF from in-flight calibration observations of the active late-type binary Capella. The model profile, the continuous curve, is a Moffat function (see Equation 9.1) corresponding to the best-fit value of β = 2.5. While this function represents a statically-poor fit to this extremely high S/N zeroth-order profile, it is a good approximation to the LRF for lines in the dispersed spectrum containing many fewer counts.
images/letg_2lines_fits.png
Figure 9.9: LETGS line response function as illustrated by two bright Fe lines (Fe XVII at  ∼ 17 Å and Fe XVIII at  ∼ 94 Å ) using in-flight calibration observations of Capella. The solid curves are best-fit Moffat functions with β = 2.5.
images/letg_beta_chi.png
Figure 9.10: LETGS zeroth order profile goodness of fit vs. β, showing a best-fit profile with an index of  ∼ 2.5 (see Equation 9.1).

Extended Sources

If a source is extended, there is no longer a unique mapping between the position of an event in the focal plane and wavelength, and this results in the apparent degradation of spectral resolving power. For very large sources, the grating resolution may be no better than the intrinsic ACIS energy resolution.
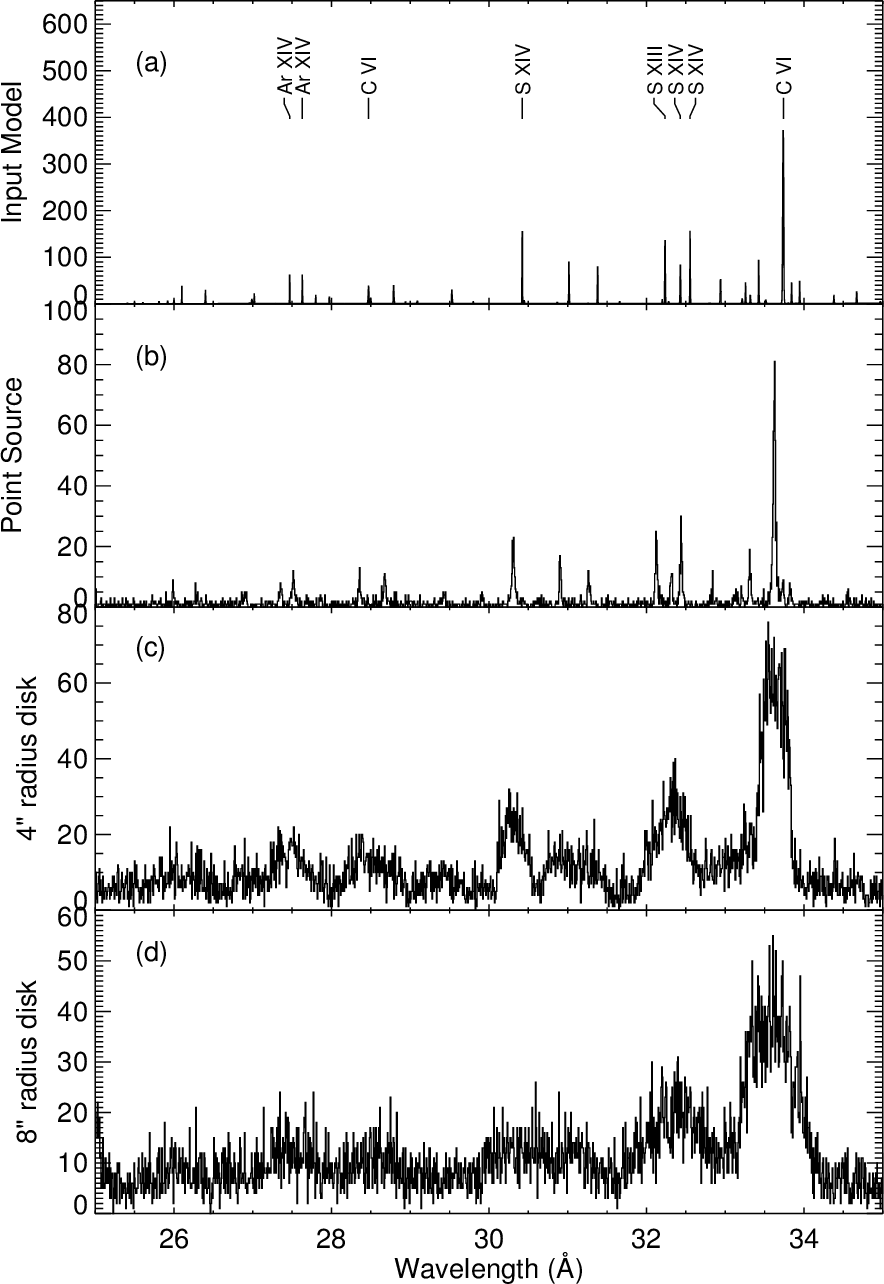
The effect of increased source size on the apparent LETG spectral resolving power has been simulated using the MARX program, and results are shown in Figure 9.11. Another illustration of the effect of source extent may be seen in Figure 9.30 (Section 9.4), which shows model spectra over a small wavelength range.
images/fig_ext_leg.png
Figure 9.11: LETG spectral resolving power for extended sources. The predicted LETG resolving power (E/∆E) is shown versus wavelength for several source sizes. The MARX simulator has been used, and the source is represented by a β model (Equation 9.2). For comparison, the spectral resolution for ACIS front-illuminated CCD chips is shown (thick solid line). Note that the ACIS/FI curve does not include the effects of CTI, which progressively degrades resolution away from the read-out edge (most of this degradation can be compensated for in data analysis).
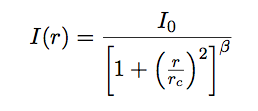
In each case, extended sources were modeled using a Beta model for the surface brightness profile. Beta models are often used to describe the distribution of emission in galaxies and clusters of galaxies, and have an identical form to the Moffat function used to describe the line profile above, except that the intensity dependence is radial:
Equation 9.2
(9.2)
where I(r) is the surface brightness, r is the radius, and rc characterizes the source extent. The value of β was set to a typical value of 0.75 and simulations were performed for different values of the source extent, rc.

Off-Axis Sources

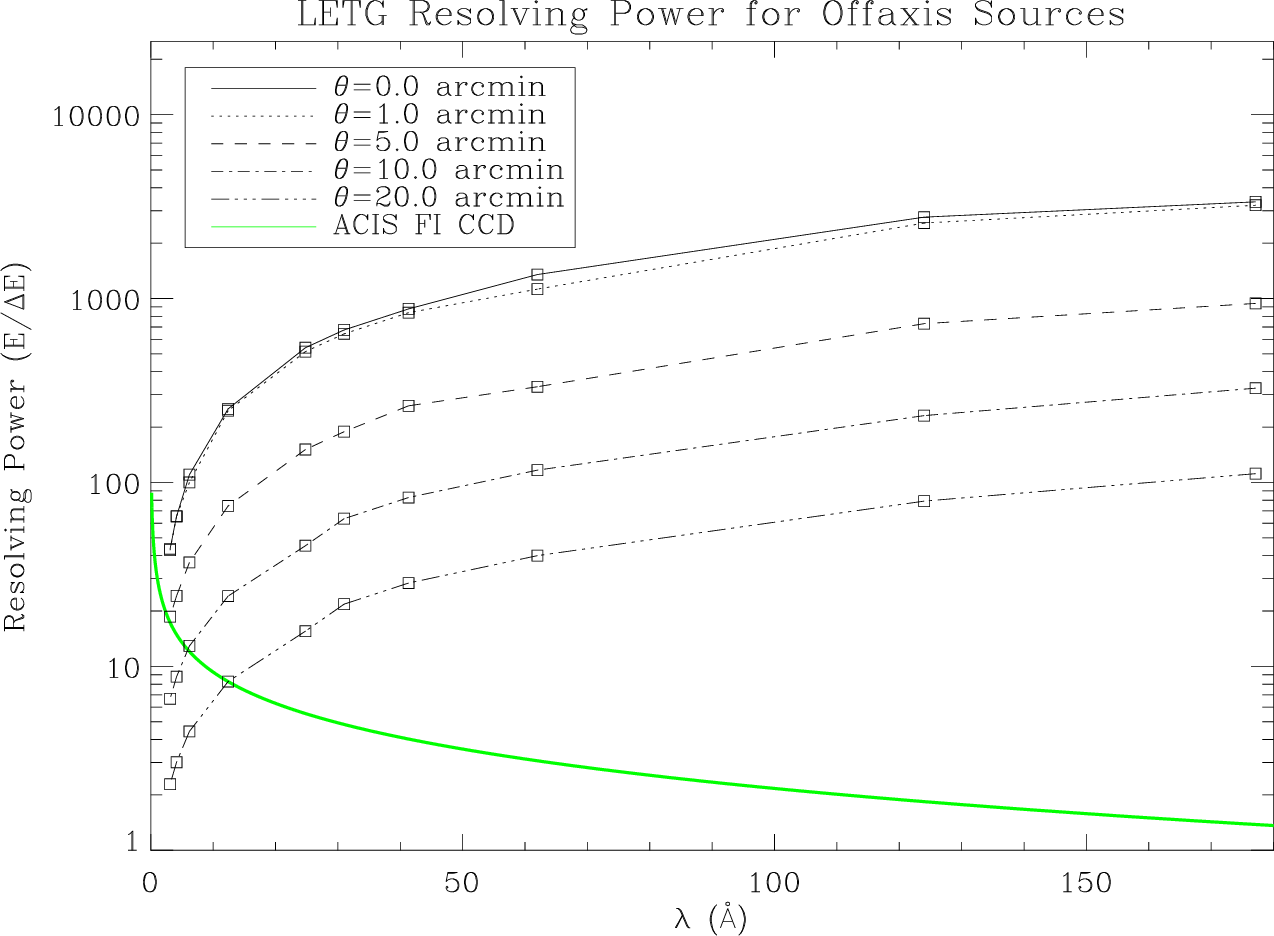
Similarly, for sources off-axis, the increased point-spread function decreases the spectral resolving power. The effect on off-axis sources has been simulated with MARX and is shown in Figure 9.12.
images/fig_off_leg.png
Figure 9.12: LETG spectral resolving power for off-axis sources. The predicted LETG resolving power (E/∆E) is shown versus wavelength for various off-axis distances. For comparison, the spectral resolution for ACIS  front-illuminated CCD chips is shown. Note that the ACIS/FI curve does not include the effects of CTI, which progressively degrades resolution away from the read-out edge.
As with extended sources, an ACIS pulse-height spectrum may, in extreme cases, provide energy resolution comparable to or better than the LETG for a source far off-axis.

9.3.4  Grating Efficiency

Fine and Coarse Support Structure Diffraction

As explained in Section 9.1, the LETG has fine and coarse support structures which are periodic in nature, and have their own diffraction characteristics. The fine support structure disperses photons perpendicularly to the main spectrum, with about 1/26 the dispersion of the main grating. The coarse support is a triangular grid, and creates a very small hexagonal diffraction pattern which is generally only discernible in zeroth order or for very bright lines. Examples of this secondary diffraction are visible in Figures 9.23, 9.24, and 9.27, all in Section 9.3.7.
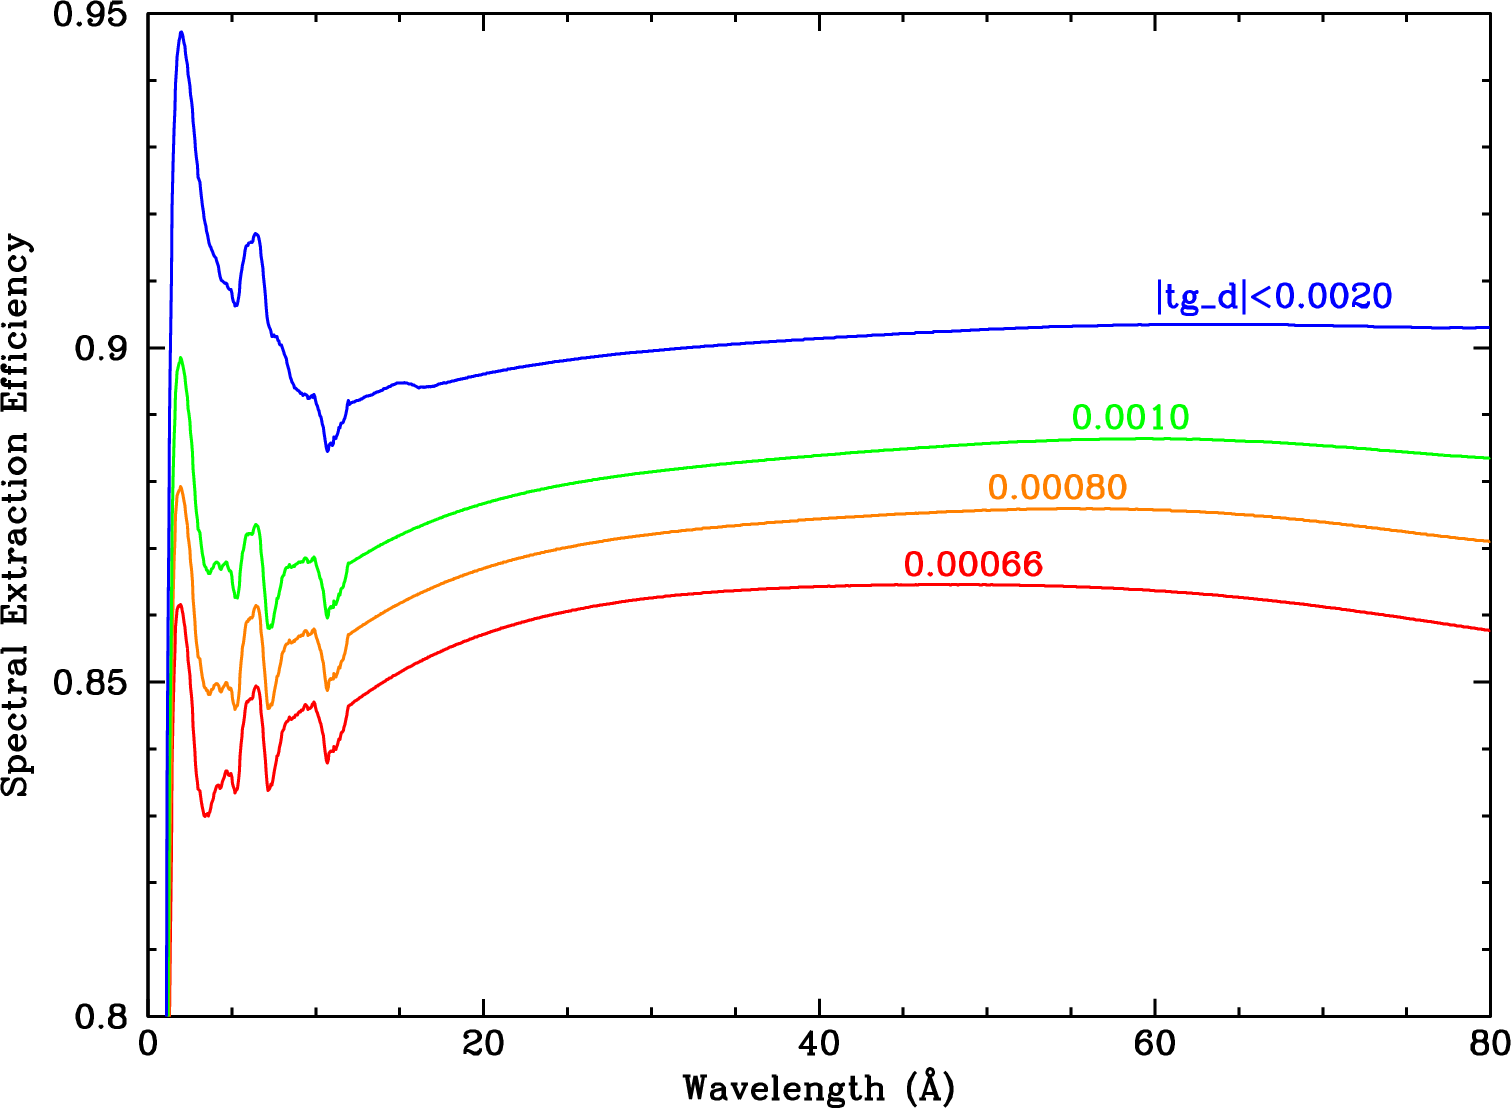
The two support structures each diffract roughly 10% of the X-ray power, but the coarse-support diffraction pattern is so small that essentially all its photons are collected along with the primary spectrum during spectral-region extraction in data analysis. A significant fraction of the fine-support diffraction pattern, however, may lie outside the spectral extraction region, resulting in a loss of several percent of the total X-ray intensity (see, e.g., Figure 9.23). The fractional retention of X-ray power in the source extraction region is referred to as the spectral extraction efficiency and is discussed in Section 9.3.5.

Total Efficiencies

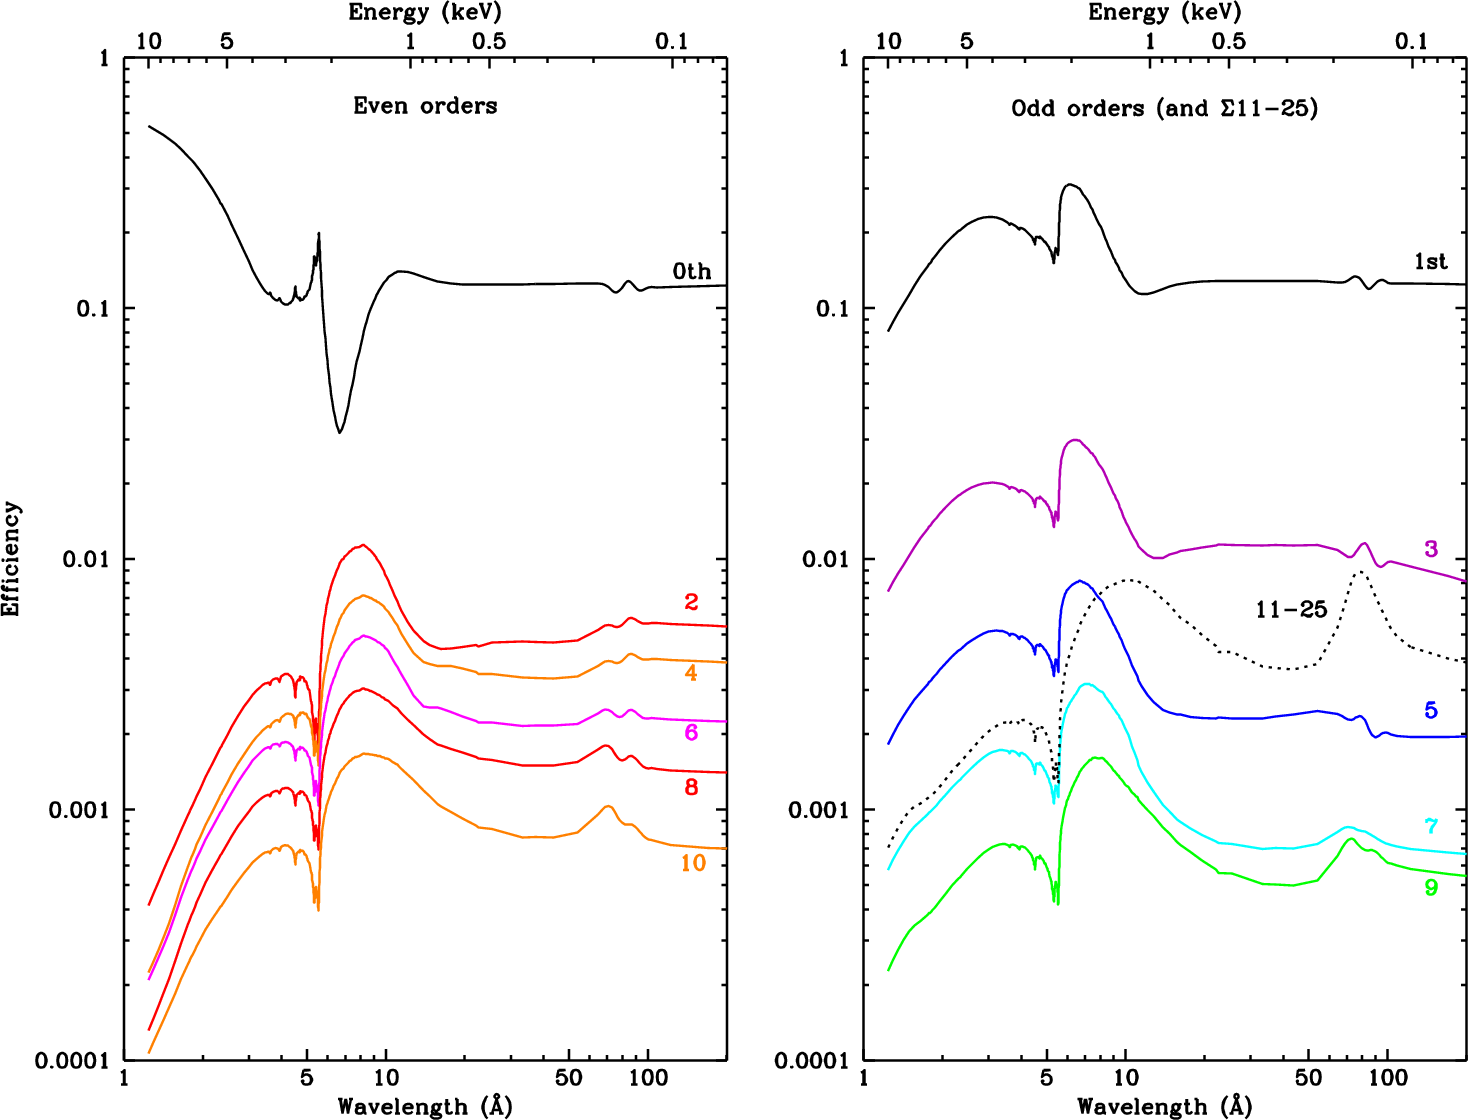
The zeroth and 1st order grating efficiencies are based on a rhomboidal grating bar analytical model and verified by ground calibration. Higher orders have been calibrated relative to 1st order using flight data. Plotted values (Figure 9.13) are for the total diffraction efficiency (including photons diffracted by the coarse and fine support structures), with negative and positive orders summed. Even orders are generally weaker than odd orders up through roughly 6th order.
images/greffs.png
Figure 9.13: LETG grating efficiency. Combined positive and negative order efficiency is plotted versus wavelength and energy. For clarity, even and odd orders are plotted separately; the sum of orders 11-25 is also shown. Plotted values include all support structure diffraction. Net efficiency when using a spectral extraction region (see Figures 9.14 and 9.15) is 10-15% lower. Features near 6 and 80 Å are due to the partial transparency of the gold grating material at these wavelengths.
The wiggles near 80 Å, and the stronger features near 6 Å, arise from partial transparency of the gold grating material to X-ray photons. Note that there are no absorption-edge features from C, N, or O in the LETG efficiency as there are in the HETG, because the LETG does not use a polyimide support film.

9.3.5  Effective Area

The LETGS effective area for any diffraction order is the product of HRMA effective area, net LETG efficiency for that order (including spectral extraction efficiency), and overall detector efficiency (which varies slightly depending on exactly where the diffracted spectrum falls on the detector). For LETG/ACIS-S an additional factor is the Order Sorting Integrated Probability (OSIP), which is determined by the width of the ACIS-S energy filter for each diffraction order. All these quantities vary with wavelength.
Of the contributors listed above, the HRMA EA (see Chapter 4) is the best calibrated within the LETGS energy band. The largest contributor to the LETG/HRC-S effective area uncertainty is the efficiency of the HRC-S, especially at longer wavelengths ( > 44 Å ; < 0.28 keV) where ground calibration is very difficult or impossible. In-flight calibration (see Section 9.2.2), particularly of the net 1st order effective area, has provided the best and most extensive data, and the effective area is now believed to be accurate to a level of approximately 10-15% or better across the entire bandpass. Effective areas for orders 2-10 have been calibrated relative to 1st order to an accuracy of 5-10% (best for 3rd order and generally worsening with increasing m) using flight data. Uncertainties for λ< 6 Å, mλ> 80 Å, and orders beyond 10th may be larger but are usually unimportant.
The QE of both the ACIS-S and HRC-S detectors is slowly decreasing over time (see Sections 6.5.1 and 7.10), and so the LETGS effective areas are also time dependent, as reflected in the CALDB (beginning with CALDB 4.4.5 for the HRC-S). The ACIS-S QE decrease is caused by a thickening layer of contaminant on the detector's Optical Blocking Filter, and is most apparent at low energies. As of 2016, it is recommended that LETG+ACIS-S spectra be centered on row 520 (SIM-Z=0) instead of row 180 (SIM-Z=-8 mm) in order to sample a region of ACIS-S with thinner contaminant and therefore higher effective area (see Figure 9.6 and Section 9.4.1/ACIS-S). The HRC-S decrease of  ∼ 2% per year is largely independent of energy and believed to be caused by charge extraction across the entire detector (mostly from cosmic ray background events), with a slightly higher rate of decrease around the aimpoint and at wavelengths longer than  ∼ +140 Å. The HRC-S operating voltage was raised in 2012 and again in 2021 to counteract decreasing QE.

Instrument Spectral Features

In addition to fixed-position detector features (primarily detector segment gaps-see Section 9.3.2) there are instrumental spectral features which occur at fixed energies because of absorption edges in the materials comprising the HRMA, LETG, and HRC-S or ACIS-S. The edges are tabulated in Table 9.4 and can be seen in the effective area curves (such as Figure 9.17) as decreases or increases in effective area depending on whether the material is part of the mirror, the filter, or the detector. Every effort has been made to adequately calibrate Chandra over its entire energy range, but it should be understood that effective areas near absorption edges are extremely difficult to quantify with complete accuracy and uncertainties in these regions are inevitably higher.
Table 9.4: Instrumental Absorption Edges
Instrument Element Edge Energy Wavelength
(keV) (Å)
HRC Cs L 5.714 2.170
HRC  Cs L 5.359 2.313
HRC  I L 5.188 2.390
HRC  Cs L 5.012 2.474
HRC  I L 4.852 2.555
HRC  I L 4.557 2.721
LETG Au M 3.425 3.620
LETG Au M 3.148 3.938
HRMA Ir M 2.909 4.262
LETG Au M 2.743 4.520
HRMA Ir M 2.550 4.862
LETG Au M 2.247 5.518
LETG Au M 2.230 5.560
HRMA Ir M 2.156 5.750
HRMA Ir M 2.089 5.935
ACIS Si K 1.839 6.742
HRC, ACIS  Al K 1.559 7.953
HRC  Cs M 1.211 10.24
HRC  I M 1.072 11.56
HRC  Cs M 1.071 11.58
HRC  Cs M 1.003 12.36
HRC  I M 0.931 13.32
HRC  I M 0.875 14.17
HRC  Cs M 0.7405 16.74
HRC  Cs M 0.7266 17.06
ACIS F K 0.687 18.05
HRC  I M 0.6308 19.65
HRC  I M 0.6193 20.02
HRC,ACIS  O K 0.532 23.30
HRMA Ir N 0.496 25.0
HRC  N K 0.407 30.5
HRC,ACIS  C K 0.284 43.6
HRC  Al L 0.073 170

Spectral Extraction Efficiency

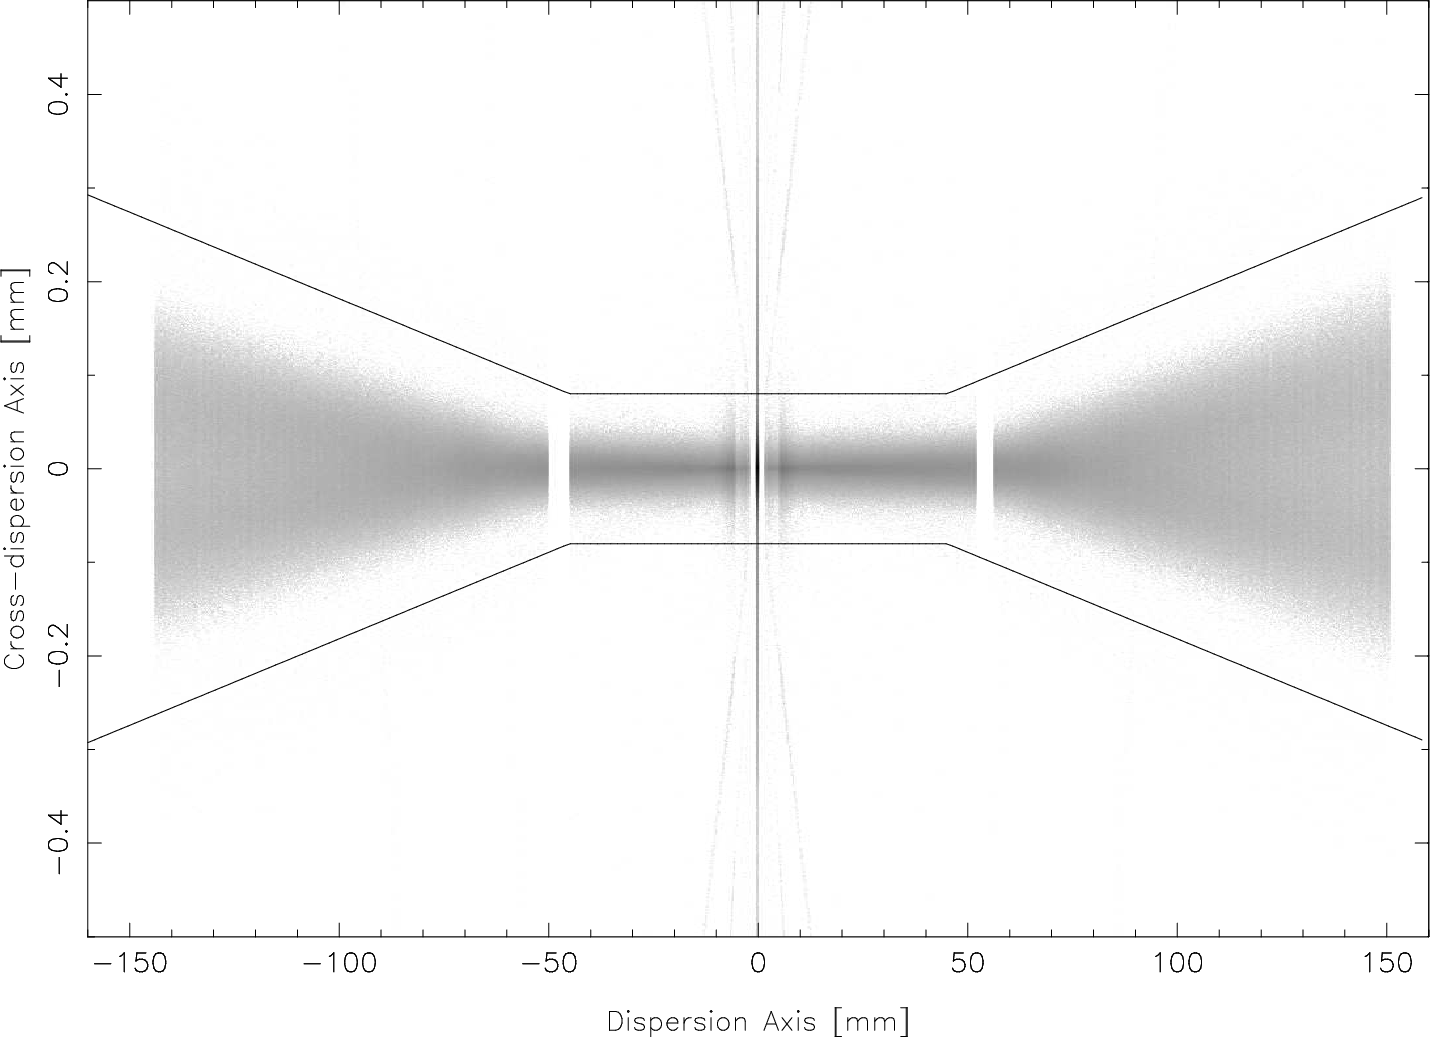
In practice, it is impossible to "put back" photons which undergo secondary diffraction (from the coarse and fine support structures) in a real observation. Instead, one defines an extraction region for the observed spectrum and adjusts the derived spectral intensities to account for the fraction of total events that are contained within the extraction region.
images/letg_wads.png
Figure 9.14: A MARX simulation of a flat spectrum illustrating the broadening of the LETG+HRC-S  profile in the cross-dispersion direction, and showing the "bow-tie" spectral extraction window. Note that the vertical axis is highly stretched and that the true diffraction pattern has some minor asymmetries. The default extraction region for LETG+ACIS-S spectra (not shown) is rectangular with a half-width of 0.12 mm.
images/letg_eefrac.png
Figure 9.15: Spectral extraction efficiencies for LETG+ACIS for various extraction region half-widths (tg_d units are deg). The default spectral extraction region is | tg_d | < 0.0008 deg. Approximately 10% of the total power is diffracted by the fine-support structure and most of it falls outside the extraction region; the peaks toward shorter wavelengths reflect the inclusion of progressively higher orders of cross-dispersed events within the extraction region. The otherwise general trend of declining efficiency toward short wavelengths is caused by increased scattering. The slight fall-off beyond  ∼ 60 Å is due to astigmatism, i.e., an increasing fraction of events are lost as the dispersion pattern broadens (see Figure 9.14).
The default extraction region for the LETG+ACIS-S configuration is a rectangle; that for the LETG+HRC-S configuration is "bow-tie" shaped, comprising a central rectangle abutted to outer regions whose widths flare linearly with increasing dispersion distance (see Figure 9.14). The shape of the bow-tie has been roughly optimized to match the astigmatic cross-dispersion that is a feature of Rowland-circle geometry, with the goal of including as much of the diffracted spectrum as possible while minimizing the included background. Extraction efficiencies for LETG+ACIS are illustrated in Figure 9.15. The extraction efficiency for the LETG+HRC bow-tie is 85-86% at most wavelengths. For custom analysis (such as when narrower or wider extraction regions are needed), CIAO permits adjustment of spectral and background regions by the user. A narrower extraction region optimized for the analysis of low-S/N spectra is available at https://cxc.harvard.edu/cal/Letg/LetgHrcEEFRAC. Whatever spectral region is chosen, CIAO computes the extraction efficiency and includes it as a factor in the Response Matrix File (RMF). Users then apply this RMF together with the effective area from the CIAO-computed Ancillary Response File (ARF) during subsequent analysis.

Zeroth and First-Order Effective Areas

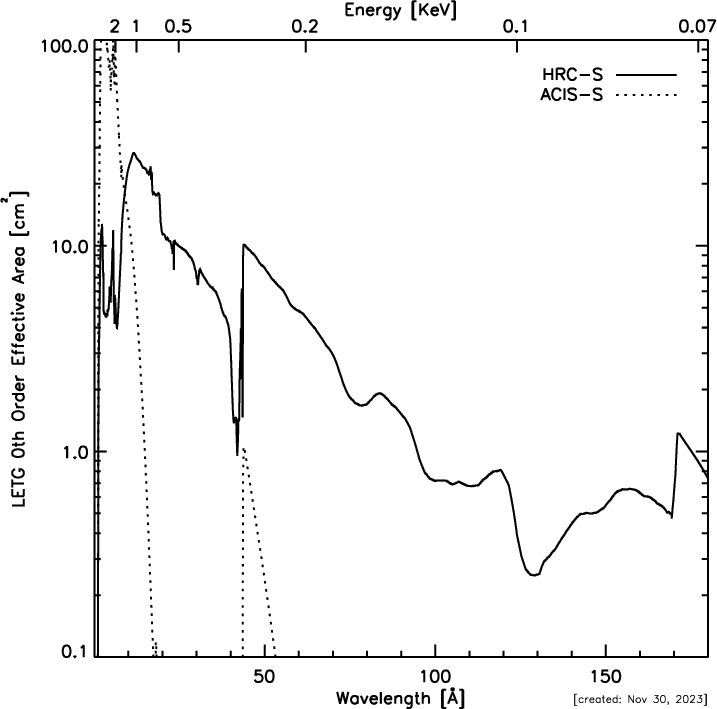
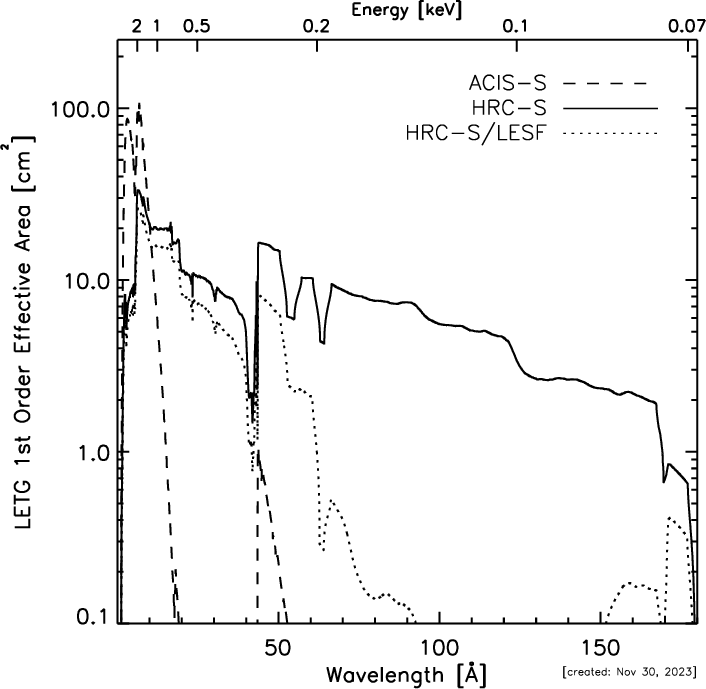
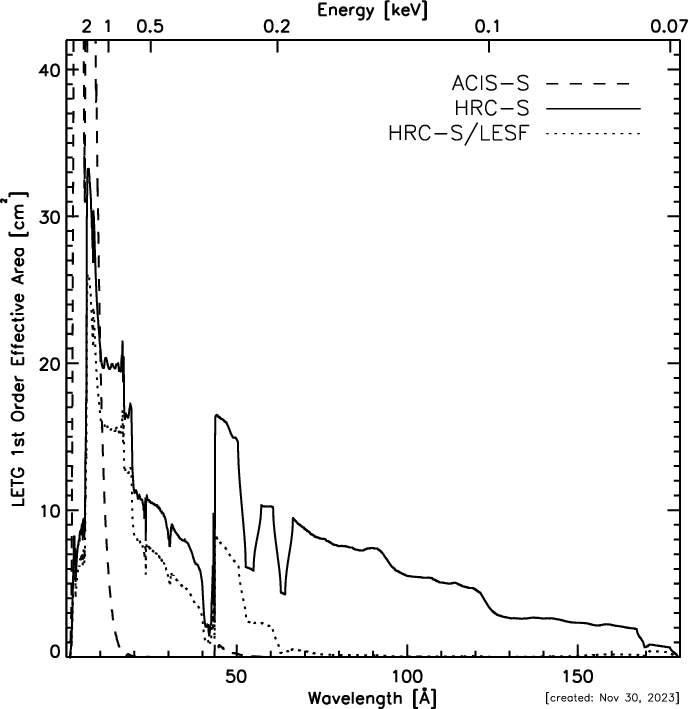
Although the HRC-S is the default detector for the LETG, other detector configurations are possible. Figures 9.16 and 9.17 show effective areas for the LETG zeroth and 1st orders, respectively, when using the HRC-S, HRC-S with LESF, or ACIS-S as the read-out detector. Based upon these and other plots, the various trade-offs as to the use of each detector are thoroughly discussed in Section 9.4. Users interested in the low energy response using ACIS  should read carefully the discussion in Section 6.5.1.
images/letg_0thO_v0110.png
Figure 9.16: LETGS zeroth-order effective area for an on-axis point source for the LETG with HRC-S and ACIS-S detectors. The zeroth-order effective area for the HRC-S/LESF combination is the same as for the HRC-S. LETG+ACIS-S areas include the effects of time-dependent contamination.
images/letg_1stO_log_v0110.png
images/letg_1stO_lin_v0110.png
Figure 9.17: LETGS 1st-order effective area for an on-axis point source, with HRC-S, HRC-S/LESF, and ACIS-S  detector configurations with log (top) and linear (bottom) scaling. Positive and negative orders are summed. LETG+ACIS-S areas include the effects of time-dependent contamination. Note that the vertical scale of the linear plot has been truncated.
images/letg_hrcs_ea_orders_mlam.png
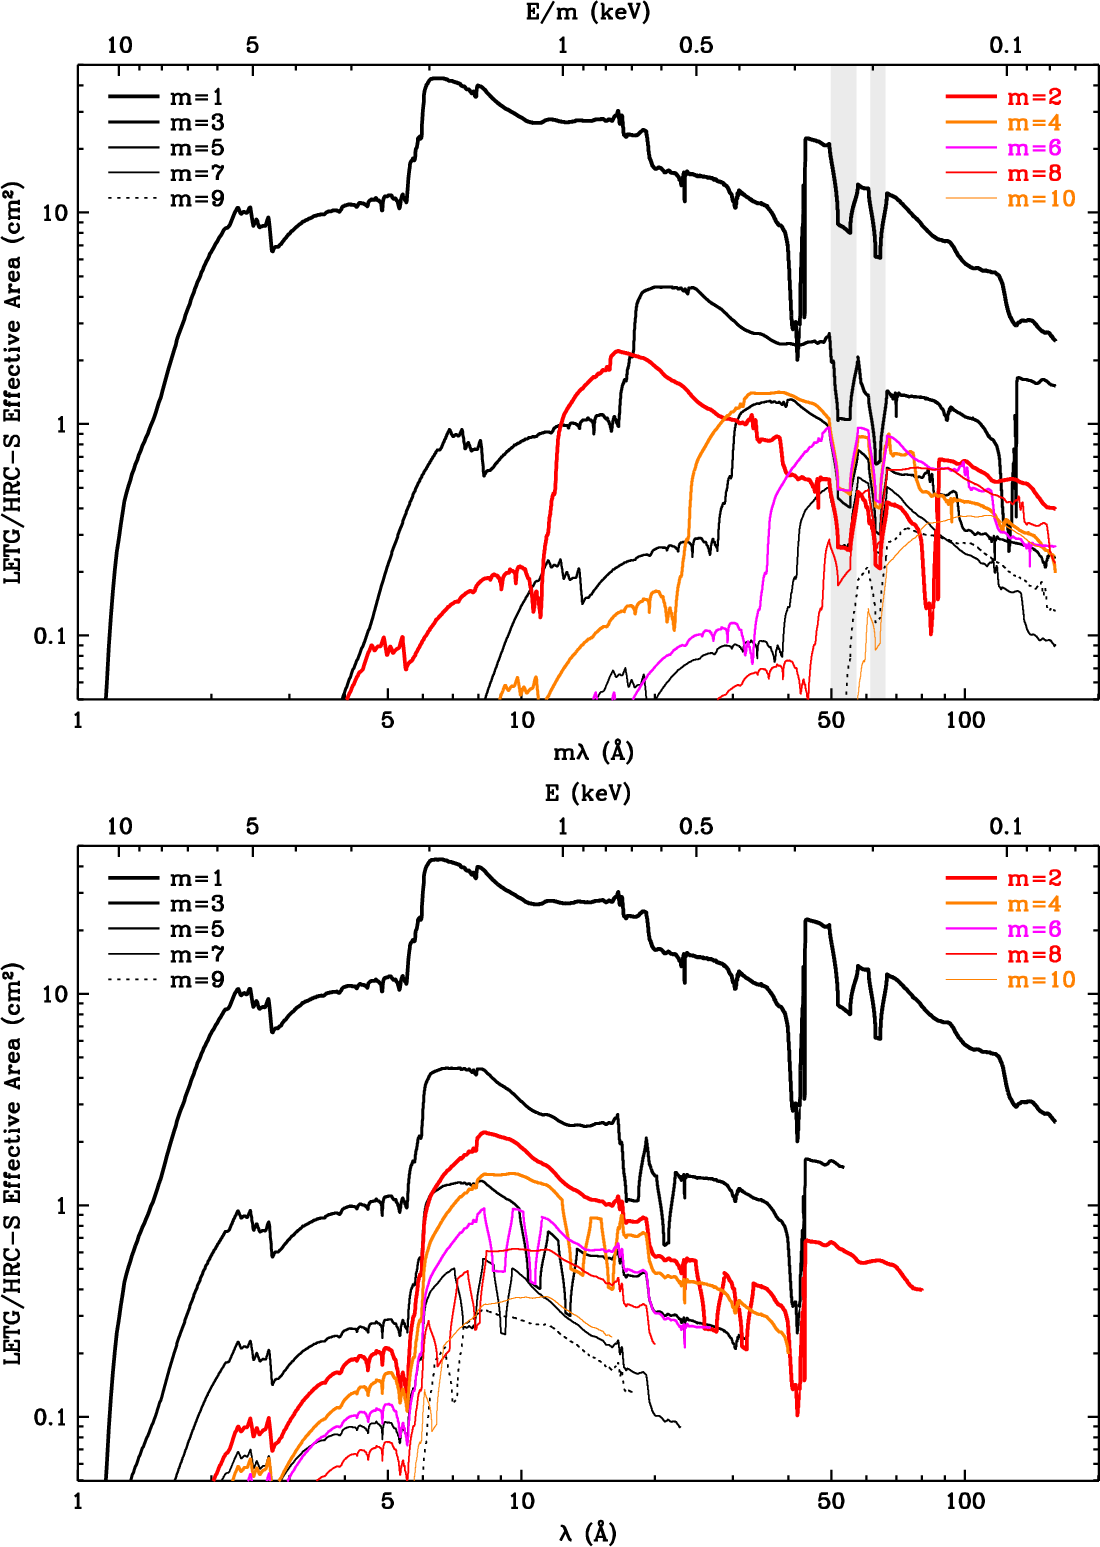
Figure 9.18: The combined LETG/HRC-S effective area, illustrating the relative strengths of 1st and higher orders, plotted versus mλ (top) and λ (bottom). Positive and negative orders are summed. (Current effective areas are about 30% lower than shown but the ratios between orders are correct.) Light shading in the top panel marks plate gaps around mλ = −53 and +64 Å. See the text for an example of how to determine the relative strength of overlapping lines from different orders, and https://cxc.harvard.edu/ciao/threads/hrcsletg_orders/ for color figures and further information.
images/letg_lesf.png
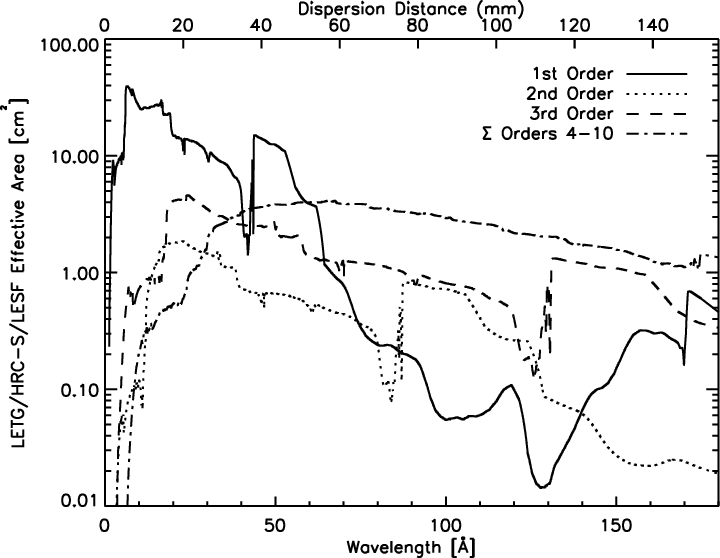
Figure 9.19: The combined HRMA/LETG/HRC-S/LESF effective areas for 1st and higher orders. Positive and negative orders are summed.
images/letg_acis_ea_orders_v0110.png
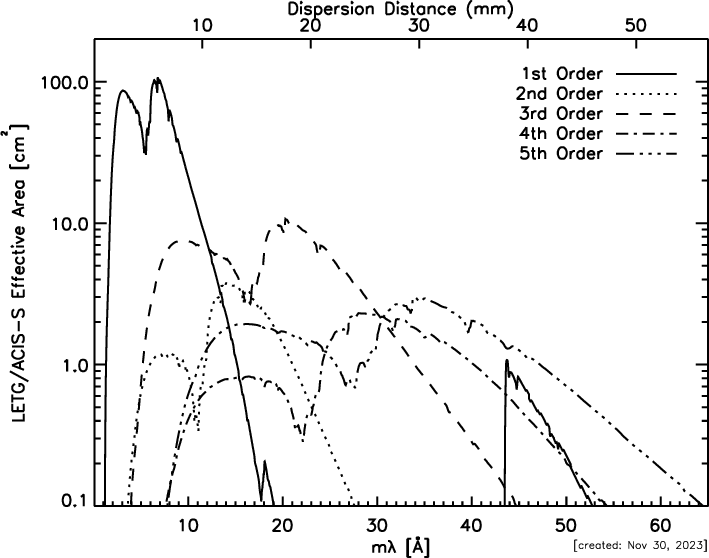
Figure 9.20: The combined HRMA/LETG/ACIS-S effective areas for 1st and higher orders. LETG+ACIS-S areas include the effects of time-dependent contamination. Positive and negative orders are summed.

Off-Axis and Extended Sources

Differences in the LETGS effective area for off-axis and significantly extended sources compared to the on-axis point source case are primarily determined by the HRMA vignetting function (see Chapter 4).

High-Order Diffraction Effective Areas

Although the LETG (and HETG) have been designed to reduce complications from higher-order diffraction by suppressing even orders, many grating spectra will have overlapping diffraction orders. When ACIS-S is used as the detector, its intrinsic energy resolution can be used to separate orders. The situation is more complicated, however, with HRC-S, which has very little energy resolution. Detector options and various data analysis techniques are described in Section 9.4.
The relative contribution of higher-order photons with different detector configurations can be estimated by inspection of Figures 9.18, 9.19, and 9.20. As an example, say an observer plans to use the LETG/HRC-S configuration and wants to determine the intensity of a line at 45 Å, but knows that line may be blended with the 3rd order of a 15 Å line which has 10 times the emitted intensity of the 45 Å line. Looking at Figure 9.18, one reads the 1st- and 3rd-order curves at mλ = 45 Å and sees that the 3rd-order value is about one-tenth the 1st-order value. Multiplying by 10 (the ratio of the emitted intensities of the 15 and 45 Å lines), one computes that  ∼ 50% of the feature at mλ = 45 Å will come from the 15 Å line. A fuller explanation, with color figures and more examples for the LETG/HRC-S with line and continuum sources, can be found at https://cxc.harvard.edu/ciao/threads/hrcsletg_orders/.

9.3.6  Background

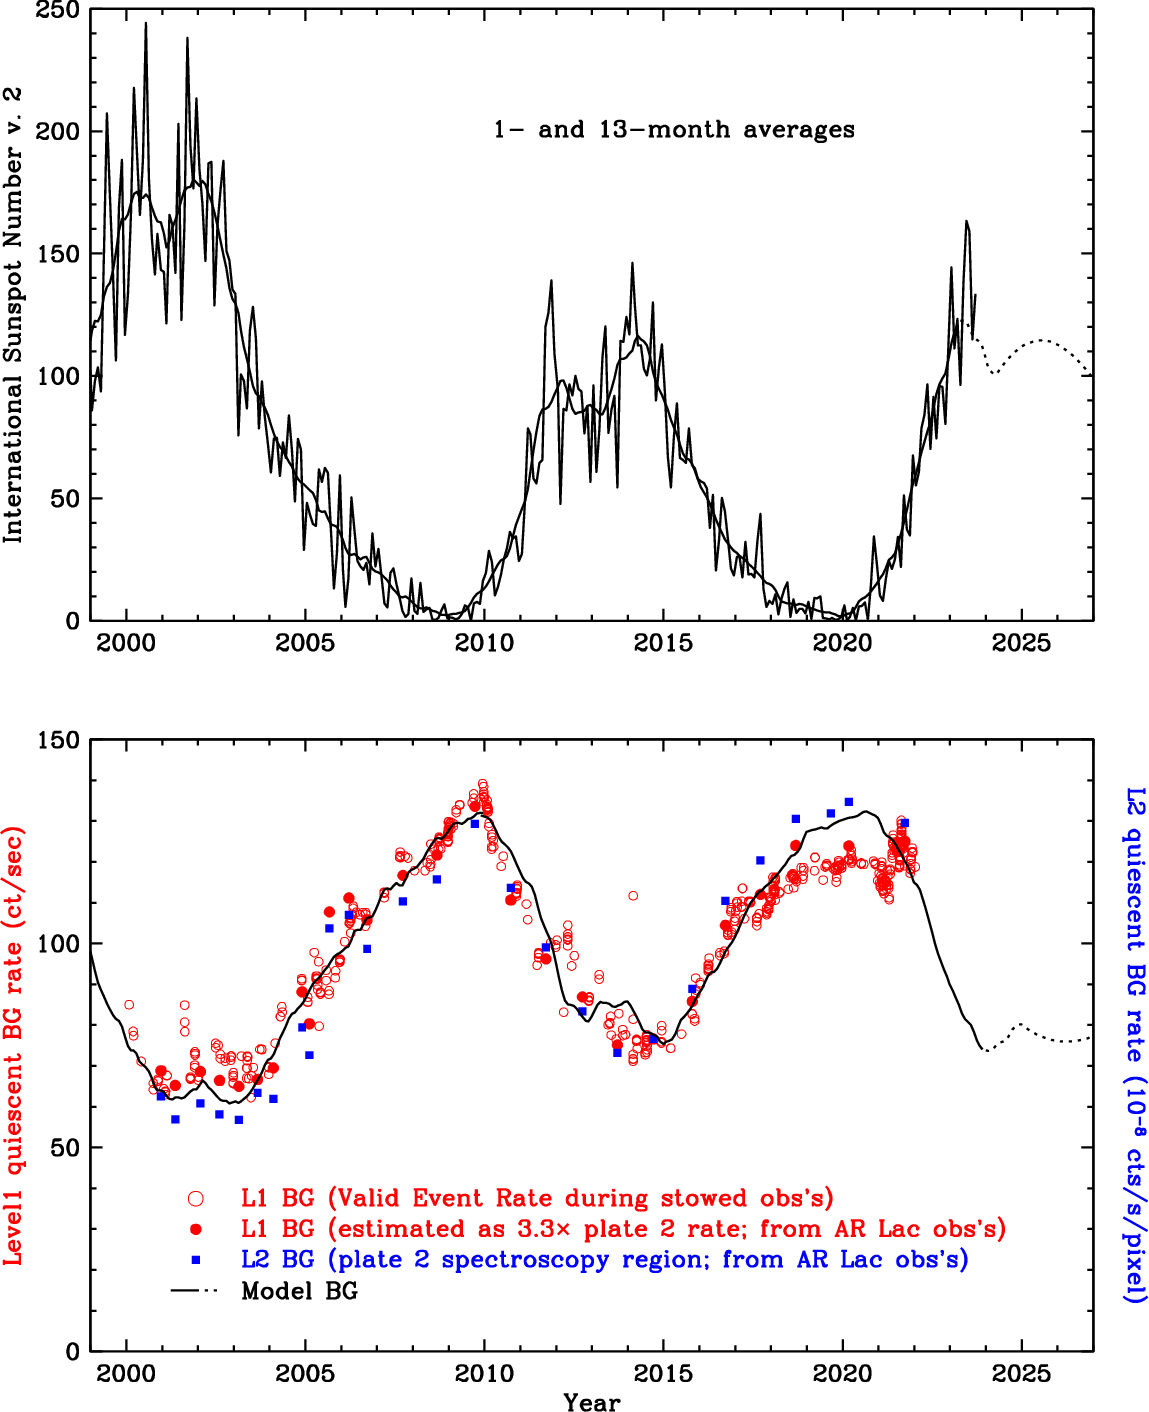
The LETG is always used in conjunction with a focal-plane detector, so LETGS spectra will exhibit that detector's intrinsic, environmental, and cosmic background. The components of the background of the HRC are discussed in Section 7.11. The quiescent background rate over the full detector varies with the solar cycle (see Figure 9.21) but is always a significant fraction of the 183 cts s1 telemetry limit. Imposition of the HRC-S spectroscopy window reduces the rate to between 55 and 130 cts s1, as discussed below.

HRC-S Exposure Windows, Deadtime, and Timing Resolution

To avoid constant telemetry saturation, the HRC-S is operated in a default windowed down "edge-blanking" configuration, in which data from only 6 of the 12 coarse taps in the center of the detector in the cross-dispersion direction are telemetered (see Section 7.11.2). The edge-blanking creates an active detector area slightly less than 10 mm, or 3.4 arcmin, in the cross-dispersion direction. This window easily accommodates the (dithered) dispersed spectra of point sources; other windows may be specified for extended sources or other special cases.
As long as the total count rate is below the 183 cts s1 telemetry limit, detector deadtime is negligible (and recorded as a function of time in the secondary science .dtf files-net exposure time is recorded in the image FITS file header). During background "flares" arising from an increased flux of solar wind particles, however, the background rate may rise above the 183 cts s1 telemetry limit. During these times detector deadtime may become significant. Current data processing algorithms correct for this deadtime with a typical accuracy of  ∼ 10% or better.
Time resolution approaching 16 μsec can be achieved with the HRC if the data rate is below telemetry saturation. To leave ample margin for telemetry in case of background flares, a special Imaging Mode (see Section 7.12) is used for high-resolution timing observations. This mode utilizes only the central region of the HRC-S detector and provides a field of view of approximately 7 arcmin × 30 arcmin. However, if telemetry saturation does take place then the time resolution with HRC-S is approximately the average time between events.

HRC-S Background Reduction Using Pulse-Height Filtering

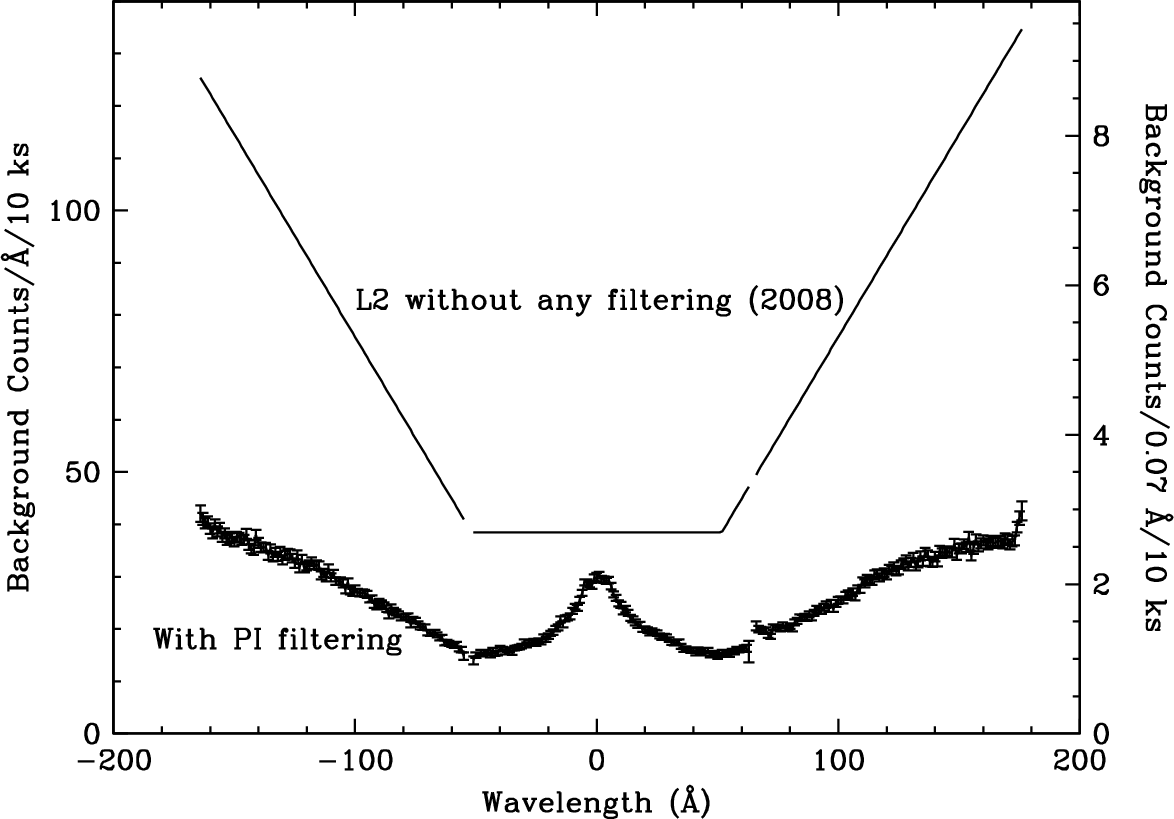
The quiescent background rate in HRC-S Level 2 data varies by more than a factor of two over a solar cycle (see Figure 9.21). A "typical" rate of 1.0×10⁻⁶ cts s1 pixel−1 corresponds to 5.76 × 10−5 cts s1 arcsec−2, or 0.10 cts/pix in 100 ks. The extent of a dispersed line in the LETGS spectrum is approximately 0.07 Å (9.5 pixels) and the spectral extraction region is 25 to 85 pixels wide in the cross-dispersion direction; the typical background rate therefore yields 24 to 81 background cts beneath the line in a 100 ks exposure. However, the HRC-S pulse height distribution is sufficiently narrow that a large fraction of pulse-height space can be excluded from the data to further reduce the background, which has a relatively broad pulse-height distribution.
A new HRC-S gain map and associated LETG/HRC-S background filter were released in 2020, with an update in mid-2021 (CALDB 4.9.6) that applies to all observations prior to 2021-May-14, when the HRC-S high voltage was raised to restore gain and QE. The background filter removes more than half of the Level 2 background at wavelengths longer than 20 Å, with a loss of only 1.0% of X-ray events (see Figure 9.22). Gain calibration details may be found at https://cxc.harvard.edu/cal/Letg/Hrc_bg.
There is no calibration of the time dependence of the HRC-S gain after 2021-May-14 and therefore the LETG/HRC-S background filter cannot be applied to observations after that date.
images/HRCsBGrates.png
Figure 9.21: Solar cycle and HRC-S background. Top: Monthly sunspot numbers in 1- and 13-month averages; the dotted curve is the predicted 13-month curve. Bottom: Level 1 (red) and Level 2 (blue) background rates and modeled background; the Leve 1 rate is for the LETGS standard spectroscopy region, derived from AR Lac monitoring data (without a grating) and from NIL-mode observations when the HRC-S is in the stowed position. The "typical" Level 2 (L2) rate is 1.0×10⁻⁶ cts s1 pixel−1, but this varies with the solar cycle. L1 and L2 background rates are not exactly correlated because of changes in the effects of L1-to-L2 filtering over time, particularly during the period of increasingly low gain prior to the May 2021 high voltage increase. The continuous black curve represents a simple model of the HRC-S background rate based on sunspot number with a 1-year lag (or 0.7 years after the 2009 solar minimum) corresponding to the approximate time for the solar wind to reach the heliopause, where its magnetic field helps deflect cosmic rays from entering the solar system. Rates in Figure 9.22 correspond to a Level 2 rate of 1.1×10⁻⁶ cts s1 pixel−1.
images/letg922.png
Figure 9.22: The 2008-Jan LETG+HRC-S background rate with and without pulse-height (PI) filtering. These Level 2 rates correspond to 1.1×10⁻⁶ cts s1 pixel−1 (see Figure 9.21). Data are shown using the standard `bowtie' spectral extraction region (see Figure 9.14). X-ray losses from the observed spectrum as a result of the filtering for 1st order are  ∼ 1.0%; losses will be somewhat larger for higher orders. See https://cxc.harvard.edu/cal/Letg/Hrc_bg for more information.
Relevance for Higher Orders  
The peak of the pulse-height distribution increases weakly with photon energy, so that the background filter, which is tuned to remove 1% of 1st order events, will remove increasing fractions of events for higher orders (e.g., roughly 30% of 8th order). This extra filtering of higher orders will have negligible effect for nearly all analyses, but should be considered when studying wavelength ranges with very heavy higher order contamination. A figure showing the effects of filtering on orders 1 to 12 is shown near the bottom of https://cxc.harvard.edu/cal/Letg/Hrc_bg.
Relevance for Observation Planning  
There are two backgrounds relevant for the LETG/HRC-S. The first is the Level 1 data event rate over the 3-plate standard spectroscopy region, which is 55–130 cts s1 during quiescence (see Figure 9.21), but can rise during background `flares' to cause telemetry saturation when the total (background plus sources) rate reaches 183 cts s1. The other is the filtered Level 2 background rate in the extracted spectrum. A "typical" rate of 1.0×10⁻⁶ cts s1 pixel−1 (see Figure 9.21) corresponds to  ∼ 10–25 cts (depending on wavelength—see Figure 9.22) in a 0.07 Å spectral bin per 100,000 s integration during quiescence, which may be used for estimating signal-to-noise (see also the discussion in Section 9.5.1).
There is a third background rate which will be of interest when high time resolution (sub-msec) is required, which is the count rate before any on-board screening is applied. See Sections 7.12 and 7.15.1 for more information on the HRC-S Timing Mode.

ACIS-S Background

As with the HRC-S detector, background rates in ACIS are somewhat higher than expected, but lower than in the HRC. Pulse-height filtering applied during order separation further reduces the effective ACIS-S background to extremely low levels when used with gratings. The reader is directed to Chapter 6 for further discussion.

9.3.7  Example Data and Support Structure Diffraction

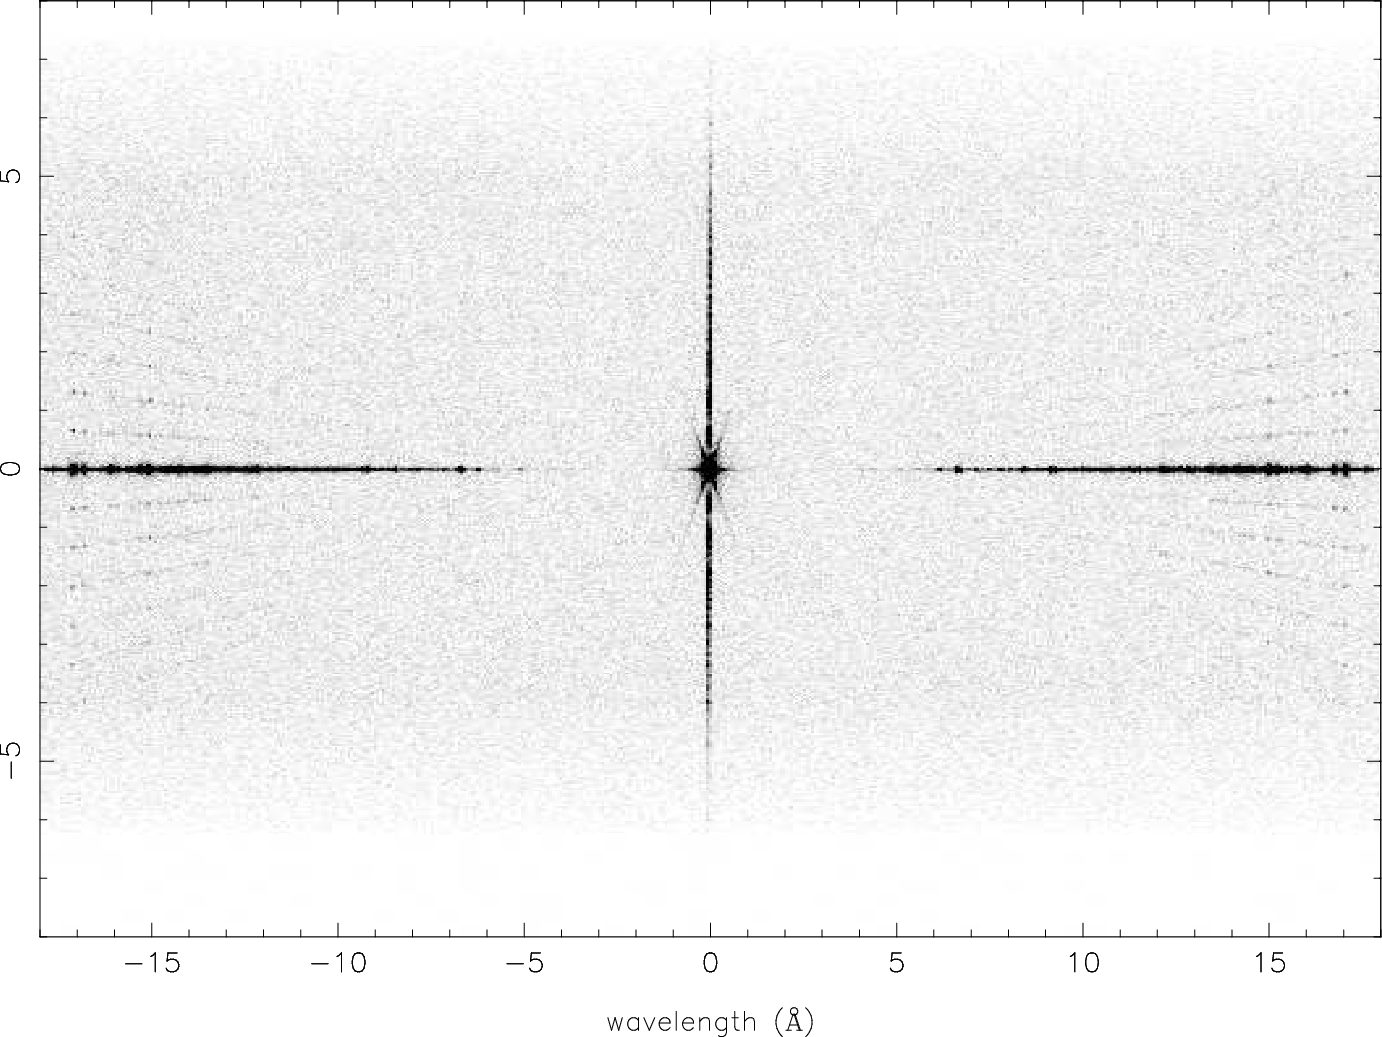
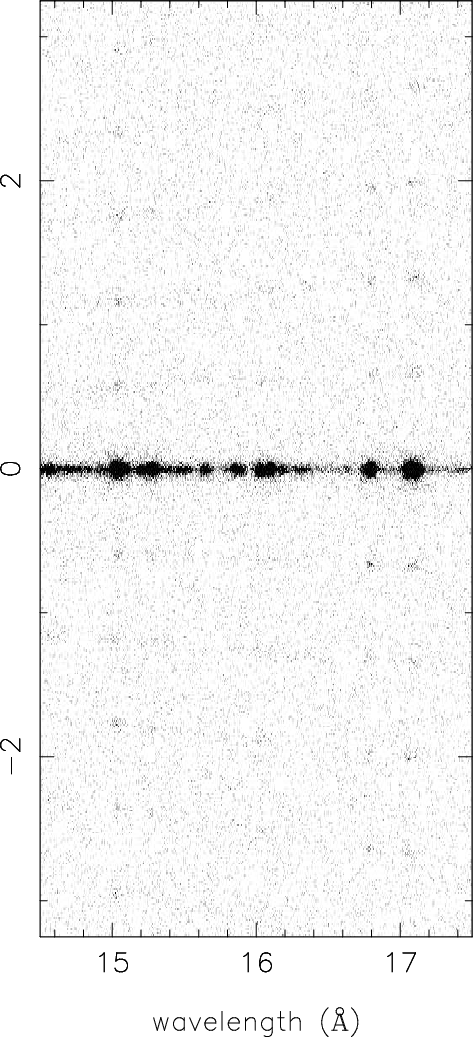
Figure 9.23 is a detector image from an 85 ks LETGS observation of Capella (ObsID 1248). The central 30 mm of the dispersion axis and the full extent of the telemetered cross-dispersion window (9.9 mm) are shown. Lines radiating from zeroth order above and below the primary dispersion axis are due to fine-support structure diffraction, and the six-pointed star around zeroth order is from coarse-support diffraction (see Section 9.1.4 for a description of the LETG support structures). Figure 9.24 is a close-up of the bright Fe XVII, Fe XVIII, and O VIII lines between  ∼ 15 and 17 Å, in which many orders of fine-support diffracted flux can be seen.
images/letg_cap_crossdisp.png
Figure 9.23: HRC-S detector image of LETGS observation of Capella. Vertical axis is stretched by a factor of 1.6 relative to horizontal; only the central 30 mm of the central plate is shown. The full extent of the telemetered six-tap cross-dispersion window is shown and measures 9.9 mm. The areas of reduced background at top and bottom are due to dither effects. Star-shaped coarse support structure diffraction is seen around zeroth order, and "cat's whiskers" fine support structure diffraction is seen above and below the primary dispersion axis, as well as in the vertical line through zeroth order.
images/letg_cap_fexvii.png
Figure 9.24: Detail of Figure 9.23, showing the LETG/HRC-S image of bright lines in Capella. Vertical and horizontal scales are identical. The Fe XVII lines at  ∼ 15 and 17 Å are the brightest in the LETG Capella spectrum. Faint features above and below the primary spectrum are due to fine support structure diffraction.
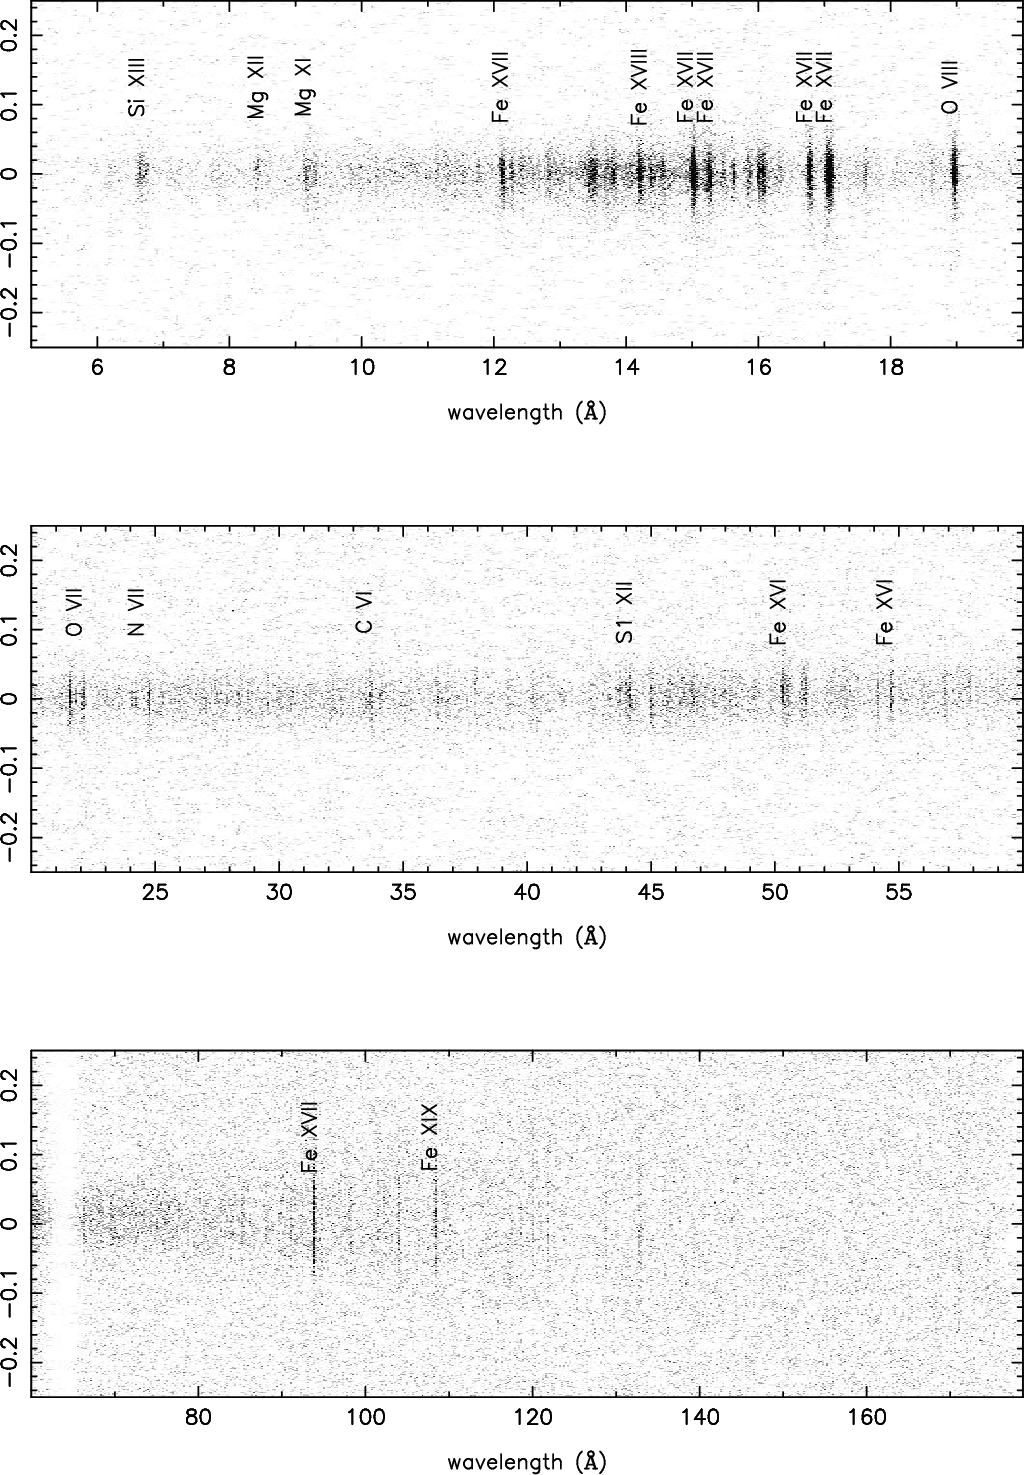
Figure 9.25 is an HRC-S image of a second Capella observation (ObsID 1420, 30 ks), showing positive order dispersion. The increasing cross-dispersion extent of lines at longer wavelengths is due to astigmatism in the HRMA/LETG system (see also Figure 9.14). The positive order HRC-S  plate gap is seen at  ∼ 63 Å. An extracted Capella spectrum (ObsID 62435, 32 ks), is shown in Figure 9.26.
images/letg_cap_image.png
Figure 9.25: HRC-S detector image of a Capella observation, showing positive order dispersion. Images in the top, middle, and bottom panels are horizontally compressed by factors of 11, 28, and 84 respectively. The increasing cross-dispersion extent of lines at longer wavelengths is due to astigmatism in the HRMA/LETG system. The positive-order HRC-S plate gap is at  ∼ 63 Å.
images/letg_cap_spec.png
Figure 9.26: Extracted LETGS spectrum of Capella with some line identifications (from Brinkman et al. 2000, ApJ, 530, L111). Many of the lines visible between 40 and 60 Å are 3rd order dispersion of the strong features seen in 1st order in the uppermost panel. Positive and negative orders have been summed.
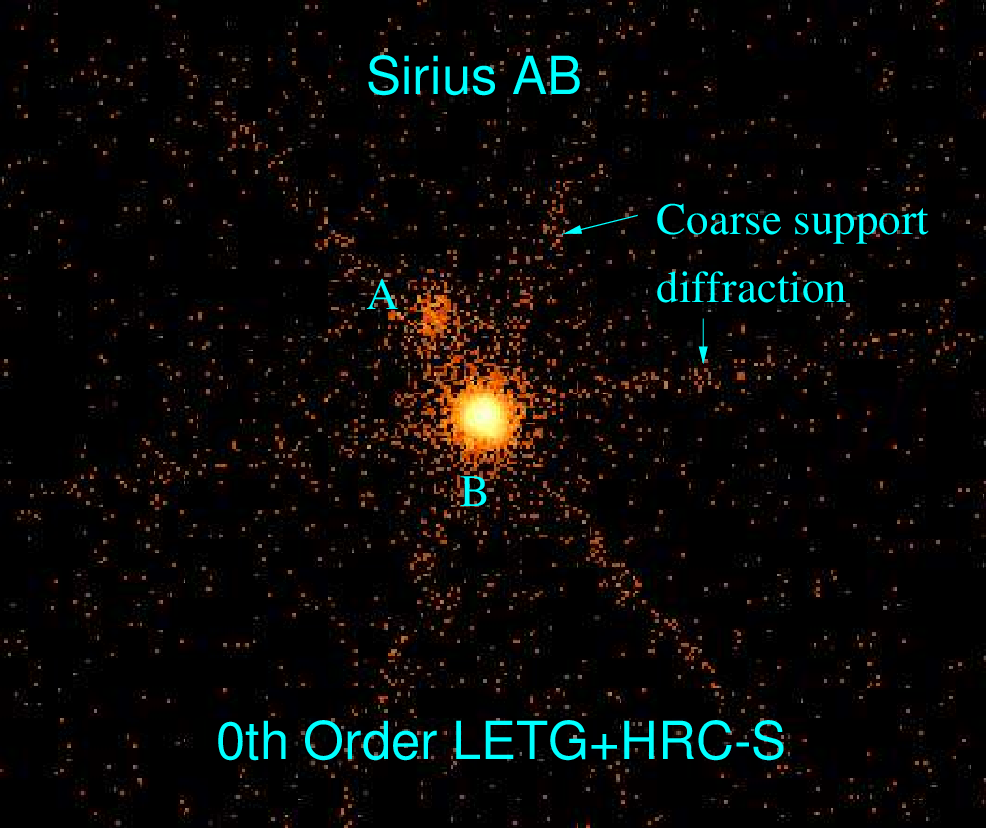
Figure 9.27 is a zeroth-order image of summed Sirius AB observations (ObsIDs 1421, 1452, 1459) with a total exposure time of 23 ks. The star-shaped pattern is due to coarse support structure diffraction. Sirius A and B are separated by  ∼ 4 arcsec. The flux from Sirius A is due to the small, but non-zero, UV response of the detector.
images/letg_sirius.png
Figure 9.27: LETG/HRC-S zeroth order image of Sirius A and B. The two stars are separated by  ∼ 4 arcsec. Flux from Sirius A is due to the small but finite UV response of the detector. The star-shaped structure is due to coarse support diffraction.

9.4  Observation Planning

The purpose of this Section is to provide further information directly related to planning LETGS observations that is not explicitly presented in Sections 9.1 and 9.3, and to reiterate the most relevant issues of instrument performance that should be considered when preparing an observing proposal. Those proposing an LETG+ACIS-S observation should read the https://cxc.harvard.edu/cal/Letg/ACIS_params page. After an LETG proposal is accepted, CXC User Support scientists will work closely with observers to ensure an optimal instrument set-up.
Beginning in Cycle 24 due to new operational constraints, HRC observations are currently limited to durations of no more than 14.5 ks, with separations of at least 30 ks. Minimum separations and maximum durations may be further constrained by external factors such as target pointing direction.

9.4.1  Detector Choices

The best choice of detector will depend on the exact application; some considerations are listed below. For further details concerning the HRC and ACIS detectors, refer to Chapters 7 and 6, respectively. Note that contamination build-up on the ACIS detector has significantly reduced the effective area of the LETG+ACIS-S combination for wavelengths > 20 Å  compared to that at launch. In this regard please be sure to read the discussion in Section 6.5.1.
HRC-S  

   Summary   HRC-S is probably the best detector choice for spectroscopic observations in which one or more of the following observational goals apply:
HRC-I  

   Summary   HRC-I is possibly the best detector choice for sources in which signal longward of 73 Å (0.17 keV) is not of primary interest and accurate effective area knowledge for > 44 Å ( < 0.28 keV) is not a strong concern, and in addition one or more of the following observational goals apply:
ACIS-S  

   Summary   ACIS-S is possibly the best detector choice for sources for which signal longward of 25 Å (0.5 keV) is of little interest and one or more of the following observational goals apply:

9.4.2  Other Focal-Plane Detector Considerations

Instrument Features and Gaps

Attention should be paid to the locations of instrument edge features and detector gaps to make sure that spectral features required to achieve science goals are not compromised by these. Calibration in the vicinities of these features is generally much more uncertain. These features and gaps are listed for both HRMA+LETG+HRC-S and HRMA+LETG+ACIS-S  combinations in Tables 9.3 and 9.4. Note that intrinsic instrumental features, such as edges, are not affected by dithering and offset pointing (see below), but chip gaps in ACIS-S and HRC-S plate gaps, as well as the boundaries between "thick" and "thin" regions of Al that make the "T" shape of the HRC-S UVIS, are.

Dither

The standard LETG+HRC-S dither amplitude is 20 arcsec (40 arcsec peak-to-peak; 2 mm in the focal plane or 2.3 Å). As of Cycle 24, LETG+ACIS-S dither is 16 arcsec (32 arcsec peak-to-peak; 0.16 mm or 1.8 Å) for both axes (or half that in the cross-dispersed direction when using a 128-row subarray). Spectral features in dispersed LETG spectra will experience the same dither pattern, and allowance for the size of the dither must be made when considering if spectral features of interest will encounter detector gaps.
In special cases, different dither amplitudes can be specified by the observer, though it must be kept in mind that detector safety constraints, such as accumulated dose per pore in the HRC (see Section 7.14), must not be violated.

SIM-Z Offsets

The SIM permits movement of the focal-plane detectors in the spacecraft z direction (perpendicular to the LETG dispersion axis). This can be used to better position a source on the ACIS-S or HRC detectors, for example to accommodate multiple sources, or to place a source over the HRC-S LESF filter region. The default SIM-Z value is 0, which places the spectrum along the center of the ACIS-S array where contaminant on the Optical Blocking Filter is thinnest and effective area is highest. Placing the LESF (which has never been used in flight) at the aimpoint requires a SIM-Z offset of +7 mm.

Offset Pointing

Because of the changing thermal environment of the telescope, the aimpoint has drifted over time (see Section 6.11). For several years, observers wishing to make observations at the best focus had to specify small offsets in Y and/or Z pointing. As of late 2015, however, this is no longer necessary as aimpoint position and error are reviewed every two weeks and automatically incorporated into mission planning software. The default Z-offset is therefore 0.
Pointing off-axis in the observatory Y axis can be used to change the wavelengths at which detector gaps occur, or to change the wavelength corresponding to the ends of the detectors. Examples of offset pointings are shown in Chapter 3. When choosing offsets, an increase of +1 arcmin in Y-offset corresponds to a shift of +3.36 Å in wavelength. As an example, by invoking a +2 arcmin offset pointing (see Chapter 3 for the convention), the long-wavelength cut-off of the HRC-S can be extended in the + order from approximately 176 Å for on-axis pointing to 183 Å. This, of course, is obtained at the expense of a commensurate shortening of coverage in the − order.
Offset pointing leads to degradation of the PSF, and consequently the spectral resolution-see Figure 9.12. For offsets of 2 arcmin or less this degradation is very small. For offsets of > 4 arcmin, spatial and spectral resolution will be considerably degraded.
In the case of the LETG+ACIS-S configuration, certain offsets might be useful, e.g., to place features of interest on (or off) backside-illuminated chips for better low energy quantum efficiency. Table 9.3 and Figure 9.6 can be used to determine what offsets are required. There is also an extremely useful visualization tool on the `Checking Your LETG/ACIS-S Obscat Setup' page (https://cxc.harvard.edu/cal/Letg/ACIS_params), which incorporates the latest detector aimpoint calibration (see Section 6.11). Keeping in mind that exact values may change over time (and will be adjusted as necessary before any observation occurs), three particularly important Y-offsets (subsequent to the change in default dither and aimpoint in Cycle 24) are the following:
+0.0 arcmin:
This is the default Y-offset value and provides the highest possible resolution while avoiding dither across the node0/node1 boundary on the S3 chip.
+1.07 arcmin:
This is the most commonly recommended offset, as it keeps O K-edge features on the S3 backside chip. Spectral resolution is  ∼ 15% worse than with Y-offset=0.
+1.67 arcmin:
This approximately centers zeroth order in the gap between S2 and S3 (but keep in mind that pointing errors can be up to  ∼ 12 arcsec, with errors of 5 arcsec or less about 90% of the time); some zeroth order events will fall on each chip because of dither. This offset can be used to reduce CCD exposure and telemetry demands caused by very bright sources and also provides uninterrupted spectral coverage (apart from chip-edge dither effects around 29 Å) by the BI chips (S1 and S3) from 0 to 57 Å. Spectral resolution is degraded by  ∼ 25% (see Figure 9.12).

ACIS-S Modes

When using the LETG+ACIS-S configuration, a mode must be selected for the ACIS detector. The ACIS detector is very flexible but deciding the best set-up can be complicated. Prospective observers considering using ACIS-S for the focal-plane detector are urged to read Chapter 6 carefully. The most common modes used for LETG+ACIS-S observations are those using sub-arrays. The shorter frame times of subarrays can be a good way to both increase the time resolution and decrease pile-up. Care must be taken when defining subarrays to make sure that the choice of SIM-Z plus any offset pointing in the z direction places the source comfortably inside the subarray. Modes with 256 rows ([1/4] subarray) or fewer are recommended for observations of point (or small) sources, provided that the source position is known to within a few arcsec. Subarrays permit the use of shorter frame times, and thus less pile-up. As an example, a [1/8] subarray (using 6 chips and with the standard SIM-Z offset of −8 mm) requires a frame time of 0.7 s (vs 3.2 s for the full array).
Frame times as short as 0.6 s can be used with four ACIS-S chips, or 0.5 s with three chips. See Section 6.13.1 for further information on ACIS frame times. Users should always refer to "Checking your LETG/ACIS-S Obscat Setup" (https://cxc.harvard.edu/cal/Letg/ACIS_params) for the most current information regarding subarray setups.

Optional ACIS-S Chips and Scheduling Flexibility

As described in more detail in Section 6.20, the continuing gradual degradation of the Chandra thermal environment means that a steadily increasing fraction of observations are experiencing scheduling constraints with regard to the allowable exposure time per orbit. One way to increase the scheduling flexibility of LETG+ACIS-S observations is to use fewer than the full array of 6 CCDs, which reduces the temperature of the ACIS electronics and focal plane. To achieve this, users may denote some ACIS chips as "Optional." In cases where thermal limits might otherwise be breached, Optional chips will be turned off for an observation; this allows Mission Planning more flexibility when setting up observing schedules and makes the process more efficient. Problematic observations with Optional chips are thus less likely to be split into multiple pieces than they would be if all the chips are required.
Note that chips S0, S4, and S5 have negligible QE for LETG 1st order dispersed photons (see Figure 9.6); those outer chips are only useful for collecting higher-order spectra, or perhaps in other special circumstances. The web page "Checking your LETG/ACIS-S Obscat Setup" (https://cxc.harvard.edu/cal/Letg/ACIS_params) and the Spectrum Visualizer tool linked there are helpful in determining which CCDs may be unnecessary. The S0 and S5 chips will be turned off in all LETG+ACIS-S observations unless the observer explicitly requests and justifies their use. It is also recommended that S4 be turned off.

HRC-S Windowing

As described in Section 9.3.6, the HRC-S has a default spectroscopic "window" defined that limits the detector area from which events are telemetered to the ground. The window is a rectangle based on coarse position tap boundaries; the default rectangle comprises the central 6 taps in the cross-dispersion direction (corresponding to  ∼ 9.9 mm) and the whole detector length in the dispersion direction. This window can be defined to suit special observational goals, such as if the source is extended and the width of the read-out region must be increased (with increased risk of telemetry saturation during background flares).
Likewise, a smaller detector region can be used if, for example, the source is very bright and telemetry saturation is a concern. In such a case, the number of cross-dispersion taps could be reduced, since the source only dithers across 2 or 3 taps. There would be less area for the background extraction region, but with a bright source this would not be a problem.
One can also specify that a subset of taps along the dispersion direction be used, particularly if the source spectrum is expected to be cut off at long wavelengths and higher-order spectra are not needed. The most commonly used (though still rare) non-default configuration is simply to use only the central plate with the standard 6 cross-dispersion taps, usually referred to as the Imaging Mode.
When considering defining a special HRC-S window, it is reasonable to assume that the detector background is spatially uniform for the purposes of computing the total source plus background count rate. The telemetry capacity of 183 cts s1 should be kept in mind to avoid telemetry saturation by using a window that is too big.

9.4.3  General Considerations

PSF Artifact

Recently, a minor PSF anomaly has been identified (see Section 4.2.3). It contains only a few percent of the source flux at a separation of 0.8 arcsec from the main peak and is roughly aligned with the cross-dispersion axis. This anomaly has negligible impact on LETG observations.

Complications from Other Sources

Field sources coincident with the target source dispersed spectrum should be avoided. While some flexibility in roll angle of order several arcmin can often be accommodated in observation execution, this avoidance is most rigorously accomplished by imposing a roll angle constraint (see below). Note that it is also desirable to retain a pristine region either side of the dispersed spectrum to enable an accurate estimation of the background within the spectral extraction window.
In some circumstances, photons from bright sources outside of the direct field of view of the HRC or ACIS might be dispersed by the LETG onto the detector.
Particular attention should be paid to optically-bright and UV-bright sources, even if these are some distance off-axis. The ACIS-S and HRC-S filters are much more transparent to optical and UV light than are those of HRC-I and ACIS-I (the HRC-S central "T" segment is closer in performance to that of HRC-I, but has completely different thicknesses of polyimide and Al layers). As an example, an observation of the bright A0 V star Vega (V=0.03) in one of the outer HRC-S UVIS segments gave a count rate of about 475 cts s−1.
The energy resolution of the ACIS-S detector enables removal by filtering of all photons except those in a fairly narrow wavelength or energy range corresponding to the wavelength or energy of photons in a spectrum dispersed by the LETG. This means that contamination of the dispersed spectrum by, for example, the zeroth order or dispersed spectrum of other sources might not be a significant problem.
However, a much better solution to problems of source contamination is, if it is possible within other observation constraints, to choose a roll angle (Chapter 3) that avoids the source contamination issue.

Roll Angle Considerations

Roll angle constraints can be specified to avoid contamination by off-axis sources, as described above, or to help separate the dispersed spectra of multiple sources in the cross-dispersion direction. The maximum separation between dispersed LETG spectra of two sources is obviously one that places the sources in a line perpendicular to the dispersion axis.
Owing to spacecraft thermal degradation and increasing difficulty in scheduling constrained observations, proposers are reminded that only a very limited number of constrained observations can be accommodated. Technical justification for requested constraints must be provided. It is also important to remember that roll angle constraints will also impose restrictions on the dates of target availability as discussed in Chapter 3. Exact restrictions depend on celestial position. Their impact can be examined using the observation visualizer tool, downloadable from the CIAO home page at https://cxc.harvard.edu/ciao/.

High Order Throughput

It is expected that the majority of observations with the LETG will make use of the HRC-S as the read-out detector because of its wavelength coverage and high quantum efficiency at long wavelengths. Since the HRC-S has very little energy resolution, the overlapping of spectral orders could be a significant issue and prospective observers should assess the degree to which their observation might be affected. The following list summarizes some considerations:

   Scientific Utility:   Higher spectral orders provide higher spectral resolving power than the 1st order spectrum by the approximate factor of the order number m. For observations in which features are expected to be seen in higher orders, this capability could be scientifically useful.

   LESF:   The LESF (the region of thicker Al coating on the HRC-S UVIS) is untested in flight, but could be useful for obtaining a spectrum containing mostly higher order flux.

   Source Spectrum:   For some sources higher orders will contain very little flux and will not be an issue. Typical examples are hot white dwarfs or relatively cool stellar coronae with T ∼ 106 K. Sources whose spectra are fairly weak in the region where the effective area of the LETG+HRC-S is highest ( ∼ 8-20 Å ; 1.5-0.6 keV) but gain in strength toward longer wavelengths will also be less affected by higher order throughput. Typical examples are blackbody-type spectra with temperatures T ∼ 106 K or less, such as might characterize novae or isolated neutron stars.

   Estimates:   Figure 9.18 can be used to estimate high order contamination. PIMMS can be used for gross estimates of higher order count rates; the PIMMS higher order calculation uses an effective area curve for orders m > 1 combined.

   Instrumental Capabilities:   Order separation is straightforward with ACIS-S. With HRC-S orders cannot be separated.

   Spectral Modeling and Higher Orders:   Unlike ACIS-S, the HRC-S does not have enough energy resolution to allow order sorting of LETG spectra. However, by folding a spectral model through an LETG+HRC-S instrument response that includes all significant higher orders (generally ≤ 10), the whole spectrum can be modeled at once. The capability to generate and simultaneously utilize response matrices for multiple orders (which can be created for plus and minus orders 1-25) is available within Sherpa/CIAO , and these response matrices can also be used with other spectral analysis software such as XSPEC. Note that the response matrices do not include the small-scale wavelength distortions discussed in Section 9.3.2, and hence care must be taken when analyzing some details of line-dominated spectra, particularly line profiles.

Interstellar Medium (ISM) Absorption

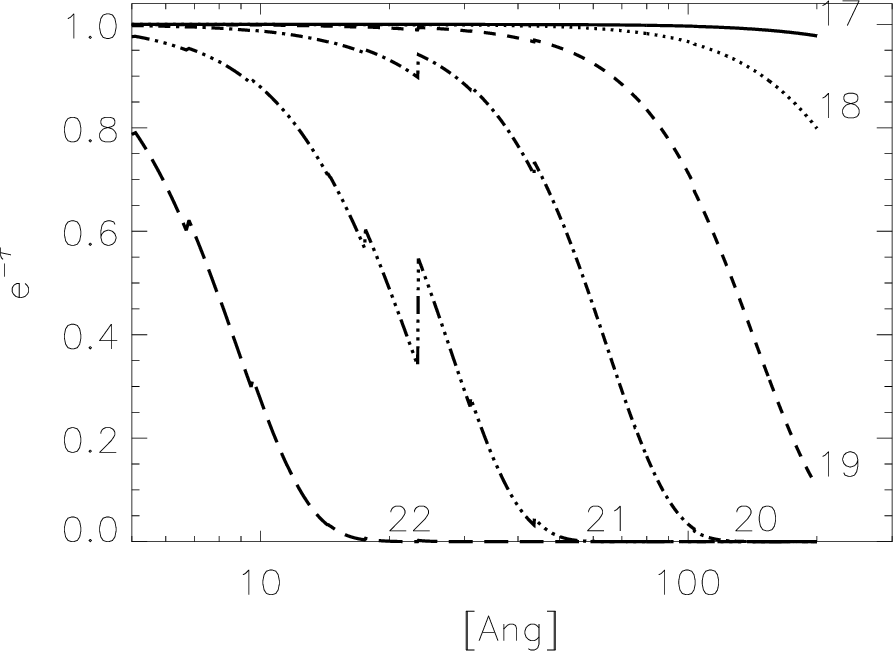
The long wavelength cutoff of the LETGS in tandem with the HRC-S  detector of  ∼ 175 Å (which can be extended with offset pointing as described in Section 9.4.2), reaches well into the extreme ultraviolet (EUV). In this wavelength regime, the spectra of even very nearby sources with relatively low ISM absorbing columns can be appreciably attenuated by H and He bound-free photoionizing transitions. Therefore observers should be aware that the effective long wavelength cutoff for anything but the nearest sources ( ∼ 100 parsec or less) will probably be determined by ISM absorption. It is also important to remember that neutral and once-ionized He can dominate the ISM absorption cross-section in the 44–200 Å (0.28–0.062 keV) range, and consideration of the neutral H absorption alone is generally not sufficient. Shortward of the C edge near 44 Å (0.28 keV), metals become the dominant absorbers. For illustration, the ISM transmittance for a "typical" mixture of neutral and ionized H and He with H:He:He+ ratios of 1:0.1:0.01 is shown in Figure 9.28 for the 5–200 Å range with different values of the neutral hydrogen column.
images/letg_ismtrans.png
Figure 9.28: The ISM transmittance within the LETGS bandpass for different values of neutral hydrogen column density 1017-1022 cm−2.
The CXC web page has a tool Colden (https://cxc.harvard.edu/toolkit/colden.jsp) that provides the total Galactic neutral hydrogen column for a given line-of-sight. The Ahelp page for Colden is located at https://cxc.harvard.edu/ciao/ahelp/colden.html. An IDL routine from the PINTofALE data analysis package for computing the ISM optical depth is available from https://hea-www.harvard.edu/PINTofALE/pro/ismtau.pro.

9.5  Technical Feasibility

Proposers should always be aware of possible limitations in the physical models and methods they are using for observation planning purposes. For example, older XSPEC versions might not include ISM absorption edges or spectral models at the high resolutions appropriate for Chandra grating observations. Available optically thin, collision-dominated plasma radiative loss models have also generally only been tested in any detail for strong lines of abundant elements. Some prominent transitions in Fe ions with n=2 ("L-shell") and n=3 ("M-shell") ground states are not yet well-represented by some models. The spectral region 25–75 Å (0.5–0.17 keV) still remains largely unexplored, and both total radiative loss and predicted strengths of lines in this region are more uncertain than at shorter wavelengths.
Some additional technical limitations in MARX modeling of LETG+HRC-S spectra are detailed below.

9.5.1  Simple Calculation of Exposure Times and Signal-to-Noise Ratio for Line and Continuum Sources

There is a discussion in Chapter 8 (HETG), Section 8.5.5, concerning the detection of an isolated emission line or absorption line that is also relevant to the LETG+HRC-S combination. This discussion is based on line equivalent width, which is appropriate for broadened lines and continuum features but which is more difficult to apply to simple modeled estimates of expected line fluxes. Additional formulae which are simple to apply are presented below. The units are Å rather than keV, Å being a much more natural unit of choice for dispersed spectra, and especially for the LETG range.
Emission Line Sources  
The source signal S in a bin is the difference between the total counts and the background counts B. The estimated standard deviation of the source counts S in a spectral bin is given by Poisson statistics as:
Equation 9.3
(9.3)
This estimate assumes that there is effectively no additional uncertainty in the estimation of the background B. Such an assumption may only be valid if, for example, the detector region used to estimate the background within the spectrum extraction window is much larger than the window itself.
Spectrometer count rates for emission features are given by
Equation 9.4
(9.4)
where sl is the source count rate in the resolution element centered at λ, in cts s1, Aeff is the effective area in cm2, and Fl is the source flux at the telescope aperture, in photons/cm2/s. For Aeff, it is reasonable to use the total area obtained from the sum of + and − orders as illustrated in Figure 9.17. Raw source counts are estimated by multiplying this instrument count rate by an integration time.
Using Equations 9.3 and 9.4, the signal-to-noise ratio for an integration time t is then
Equation 9.5
(9.5)
where b is the background count rate within the spectrum extraction window (i.e. "underneath" the spectrum) in the same resolution element centered at λ, in cts s1. Equation 9.5 provides the expected relation that is valid in the limit where the background count rate b is small compared with the source count rate sl, that the signal-to-noise ratio scales with the square root of the exposure time.
The exposure time required to achieve a given signal-to-noise ratio is then provided by inversion of equation 9.5,
Equation 9.6
(9.6)
To make the exposure time estimate one needs to determine the background count rate, b. Since the spectrometer does not have infinite resolution, the flux from an otherwise narrow spectral line is spread over a typical line width, wl. For LETG+HRC-S spectra, a good estimate for wl is 0.07Å. This is somewhat larger than the FWHM value of 0.05Å listed in Table 9.1, but is more appropriate for calculations of signal-to-noise because it includes more of the line flux. For lines that are additionally broadened, simply use a value of wl that covers the region under the feature of interest. The background rate b is then given by the quantity b=wlb′, where b′ is the background rate in units of cts/Å /s. Background spectra for LETG+HRC-S from which one can readily estimate b are illustrated in Figure 9.22 Two scales are shown, one corresponding to b′ and one corresponding to b where a width wl=0.07 Å was assumed. Note the y-axis units are per 10 ks.
Using the signal count rate sl, provided by the product of source flux (at the telescope aperture) and effective area as stated in equation 9.4, results in the two equations for the signal-to-noise ratio S/σS resulting from an exposure time t,
Equation 9.7
(9.7)
and for the exposure time t required for a signal-to-noise ratio S/σS
Equation 9.8
(9.8)
These simple equations, which include the effects of instrumental background, can also be easily applied to observations of lines on top of continua, as well as to situations in which features of interest lie on top of higher (or lower) spectral orders (HRC). In these cases, the continuum or higher order flux acts as an additional background term-the count rate/Å due to these additional terms is simply added to b′.
Continuum Sources  
Model fluxes for continuum sources can be expressed as flux densities in units of photons/cm2/s/Å. To compute instrument count rates sc from a continuum source spectrum, the Aeff function and spectrum must be partitioned with some bin size w, large enough to give adequate count rates. The product of the source spectrum with the Aeff function is then summed over some wavelength region of interest. Equation 9.4 becomes the sum
Equation 9.9
(9.9)
where Fc is the model source flux in photons/cm2/s/Å , Aeffj) is the effective area of the jth bin in cm2. The region of interest spans bins 1 through N, and w is the bin width in Å. In using this formula for planning purposes, proposers must choose a spectral bin width that will demonstrate the viability of the program proposed. For fairly narrow spectral ranges in which Aeff is nearly constant, the sum over 1-N reduces to
Equation 9.10
(9.10)
In this case one can of course simply chose a new bin size w′=Nw.
The difference between the continuum and the emission line case above lies in the units of Fc, which is a flux density. The equations corresponding to the line source Equations 9.7 and 9.8 are, for the signal-to-noise resulting from an exposure time t
Equation 9.11
(9.11)
and for the exposure time t required for a signal-to-noise ratio S/σS
Equation 9.12
(9.12)
Note also in the above equations that the background b′ is in units of cts/Å/s.

PIMMS for Rough Planning Purposes

PIMMS is best suited to performing rough estimates of total or zeroth order count rates, or estimating the fraction of zeroth order events that would be piled up. Some degree of caution should accompany PIMMS calculations of detailed quantities such as count rates within narrow spectral bands using the Raymond-Smith model. For example, line positions and intensities in this model were only designed to represent total radiative loss and do not stand up to high resolution scrutiny. Calculations using power-law and featureless continua are not prone to such difficulties, but are susceptible to other PIMMS limitations. One particular limitation concerns the background model for HRC-S, which in PIMMS is assumed to be a single average number per spectral resolution element of 20 cts/100 ks. This approximation overestimates the background at medium energies, and underestimates the background at lower and higher energies; see Figure 9.22.

MARX Simulations

The best tool for simulating LETG observations, including cases where there are multiple targets in the field of view, is the MARX ray trace simulator, which permits study of any of the available Chandra instrument combinations. For cases requiring higher fidelity modeling of the PSF, simulations can be performed by first simulating the response of the HRMA using ChaRT (https://cxc.harvard.edu/chart) and then feeding those ray trace results into MARX to simulate the LETG and detector responses.
MARX has an important limitation for LETG+HRC-S observations in that instrument, sky, and particle backgrounds are almost always significant (see Section 9.3.6 and Figure 9.22) but are not directly included and need to be simulated or otherwise accounted for by the user. Background can be simulated by approximating it as a flat field and adding this simulation to that of the source (see https://space.mit.edu/CXC/MARX/). Another way of simulating background is to scale the background in Figure 9.22 after adjusting for solar cycle variations in the background rate.
images/fig_ea_letg_color2.png
Figure 9.29: This figure shows the extracted 1st order spectrum for an 80 ks observation of the AGN NGC5548. The input spectrum consists of a power-law plus a "warm" absorber (shown in the top panel). The simulated spectrum (bottom panel) has been corrected for the instrument response to give the flux from the source.
images/letg_houck.png
Figure 9.30: MARX simulation of spectra showing the effect of source extent. The panels show (a) computed input spectrum, (b) a MARX output of LETG spectrum of a point source, (c) the same as (b) except that the source is a disc of uniform brightness with radius of 4 arcsec, and (d) the same but with radius of 8 arcsec. See Figure 9.11 and Section 9.3.3 for a discussion of extended sources.

9.6  References

Further information on LETGS performance and calibration can be found on https://cxc.harvard.edu/cal/letg/ and https://cxc.harvard.edu/cal/letg/ detailed_info.html, and in yearly Chandra Newsletter articles at https://cxc.harvard.edu/newsletters/.
PREVIOUS INDEX NEXT