- ACIS DOSE registered-photon-map
- OCT registered-photon-map in fits
Statistics:
#                IMAGE        NPIX      MEAN          RMS              MIN    MAX
  ACIS_oct01_total.fits     6004901    7.84          12.84             0.0    6032.0

 ACIS_oct01_total I2 Node 0  262654  3.493608        3.990899           0.0   142.0
 ACIS_oct01_total I2 Node 1  262654  4.544328        7.554691           0.0   276.0
 ACIS_oct01_total I2 Node 2  262654  5.417972        11.517954          0.0   358.0
 ACIS_oct01_total I2 Node 3  262654  5.829529        14.349971          0.0   419.0

 ACIS_oct01_total I3 Node 0  262654  5.633198        13.171044          0.0   423.0
 ACIS_oct01_total I3 Node 1  262654  5.242521        10.398813          0.0   317.0
 ACIS_oct01_total I3 Node 2  262654  4.263853        6.752839           0.0   251.0
 ACIS_oct01_total I3 Node 3  262654  3.116282        3.159323           0.0   132.0

 ACIS_oct01_total S2 Node 0  262397  9.034551        5.272741           0.0    48.0
 ACIS_oct01_total S2 Node 1  262397  11.566394       18.741227          0.0   409.0
 ACIS_oct01_total S2 Node 2  262397  18.031144       16.135902          0.0  3887.0
 ACIS_oct01_total S2 Node 3  262397  15.780340       14.022792          0.0    68.0

 ACIS_oct01_total S3 Node 0  262397  13.109292       6.954909           0.0    82.0
 ACIS_oct01_total S3 Node 1  262397  13.222224       7.470783           0.0    77.0
 ACIS_oct01_total S3 Node 2  262397  13.536199       6.383826           0.0    63.0
 ACIS_oct01_total S3 Node 3  262397  22.829556       17.405599          0.0    97.0
- Jul 1999 - Oct 2001 registered-photon-map in fits
Statistics:
#                IMAGE        NPIX      MEAN          RMS              MIN    MAX
 ACIS_total.fits            6004901   249.64         466.82            0.0   400226.0

 ACIS_total       I2 node 0  262654  147.212949      118.665719        38.0  9323.0
 ACIS_total       I2 node 1  262654  175.703031      248.059244        95.0  8016.0
 ACIS_total       I2 node 2  262654  200.455333      382.287864       105.0  11212.0
 ACIS_total       I2 node 3  262654  216.486225      506.436570         0.0  13809.0

 ACIS_total       I3 node 0  262654  233.208651      499.499250       123.0  13500.0
 ACIS_total       I3 node 1  262654  214.186142      372.031197       118.0  10695.0
 ACIS_total       I3 node 2  262654  180.021325      240.647141        44.0  7754.0
 ACIS_total       I3 node 3  262654  144.927741      106.076368         0.0  4298.0

 ACIS_total       S2 node 0  262397  300.304805      331.655976       102.0  51433.0
 ACIS_total       S2 node 1  262397  380.538611      971.919909       112.0  19009.0
 ACIS_total       S2 node 2  262397  343.628315      250.386285       134.0  122583.0
 ACIS_total       S2 node 3  262397  335.654916      75.143948          0.0   748.0

 ACIS_total       S3 node 0  262397  678.695926      613.375053       170.0  4568.0
 ACIS_total       S3 node 1  262397  813.916752      672.815903         0.0  69405.0
 ACIS_total       S3 node 2  262397  547.407265      138.138557       165.0  3201.0
 ACIS_total       S3 node 3  262397  484.108427      133.256419         0.0  2959.0
- OCT 2001 dose GIF image
- OCT I3 dose GIF image
- OCT S3 dose GIF image
- TOTAL JUL 1999 - OCT 2001 dose GIF image
- TOTAL I3 dose GIF image
- TOTAL S3 dose GIF image
- OCT registered-photon-map in fits
- The Mean CTI
Observations with cold radiator temperature deviation larger than 0.5 C
from the nominal value of -127.92905 C are dropped (after DOM 200).


Mean CTI observed when FPT~ -119 C and no testing modes (Squeegy, cuckoo, etc.) (average of 4 nodes per chip).
CTI's are computed for Mn K aplha, and defined as slope/intercept x10^4 of row # vs ADU.
Data file here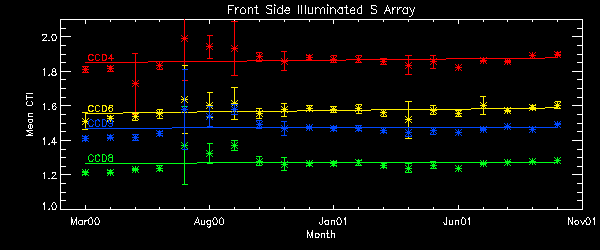
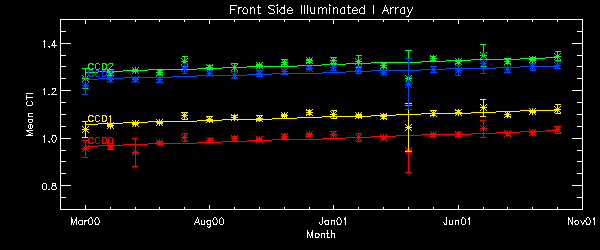
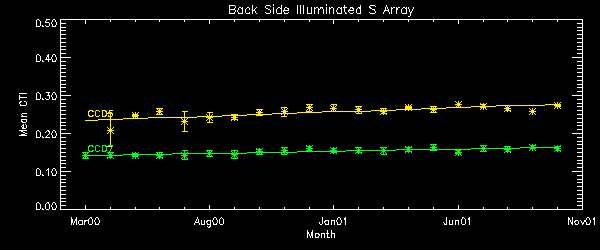
CTI Slope (after DOM 200) CTI slopes were computed for data point after DOM 200 and inside of 1 sigma deviation. Using only data point in 1 sigma range, we drop high temperature observations, squeegy observations, and other outliers. A independent variable is date, and a dependent variable is CTI. Note: Unit is cti/day from this month report. Front Side Illuminated S Array Node 0 Node 1 Node 2 Node 3 CCD4 1.524e-8 1.892e-8 1.952e-8 1.719e-8 CCD6 1.424e-8 1.736e-8 1.649e-8 1.531e-8 CCD8 1.287e-8 1.330e-8 1.299e-8 1.202e-8 CCD9 1.312e-8 1.633e-8 1.528e-8 1.156e-8 AVG 1.296e-8 Front Side Illuminated I Array Node 0 Node 1 Node 2 Node 3 CCD0 1.364e-8 1.757e-8 1.747e-8 1.498e-8 CCD1 1.497e-8 1.609e-8 1.661e-8 1.280e-8 CCD2 1.429e-8 1.696e-8 1.665e-8 1.308e-8 CCD3 1.334e-8 1.564e-8 1.550e-8 1.423e-8 AVG 1.364e-8 Detrended AVG 1.258e-8 Back Side Illuminated S Array Node 0 Node 1 Node 2 Node 3 CCD5 5.282e-9 6.164e-9 6.370e-9 2.623e-9 AVG: 4.752e-9 CCD7 3.070e-9 4.661e-9 4.824e-9 3.177e-9 AVG 3.981e-9
- Focal Plane Temperature
       The Mean (max) FPT: -117.92      std dev: 0.87
               mean width:    0.37      std dev: 0.09
DOY Focal Temp S.D. 275.12 -118.58 0.30 277.79 -118.25 0.30 280.45 -117.12 0.57 283.14 -118.41 0.40 285.71 -117.28 0.46 288.40 -118.09 0.35 290.99 -118.74 0.27 293.64 -117.77 0.43 296.29 -115.83 0.39 301.60 -118.58 0.26 304.27 -118.41 0.31

- Bad Pixel Candidates
The following pixels consistently showed a bias level more than 5 sigma away the chip's mean level during this period.
CCD0 CCD2 CCD3 CCD4 CCD5 CCD6 CCD7 CCD8 New for This Month (995,200) (483,816) (514,971) Previously Reported Warm Pixels (526,66) (247,364) (1-3,775-1022)
(226,565)
(232-245,313)
(510-511,775-1022)
(512,775)
(513,776-1024)
(607,281)
(1022,166)
(360,249)
(766,501)
(1-3, 1-1024)
(510-515,775-1024)
(1022,775)(62,482)
(587,544)
Previously Reported - Healed ? Flickering ? (509,spurious rows) (4,spurious rows)
(509,spurious rows)
(516,spurious rows)
Hot Pixels - No new hot pixels observed this month.
Previously reported:
Pixel 1022,166 of Quad 4 CCD 5. We define a hot pixel as a pixel with the count rate 1000 counts above the average- Acis Count Rate Plot This monitors the ACIS count Rate vs. EPHIN count Rate.
No sources are removed. For daily updates see: Ephin/Acis Info - Focal Plane Temperature
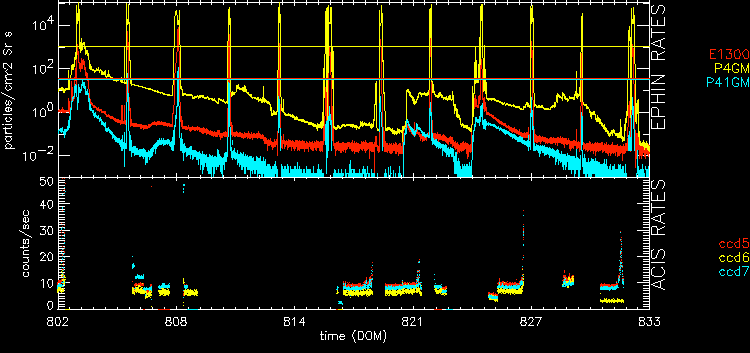
-
DOSE of central 4K pore-pairs
- OCT HRC-I dose fits image
        IMAGE                NPIX      MEAN    STDDEV      MIN       MAX
HRCI_10_2001.fits          16777216  0.02150   0.114823    0.0        7.0
- SEP 1999 - OCT 2001 HRC-I dose fits image
        IMAGE                NPIX      MEAN    STDDEV      MIN       MAX
HRCI_08_1999_10_2001.fits  16777216  1.20711   3.17771     0.0        462.0
- :OCT HRC-S dose fits image
        IMAGE                NPIX      MEAN    STDDEV      MIN       MAX
HRCS_10_2001.fits          16777216  0.17287   0.49556     0.0       14.0
- AUG 1999 - OCT 2001 HRC-S dose fits image
IMAGE NPIX MEAN STDDEV MIN MAX HRCS_08_1999_10_2001.fits 16777216 4.05214 10.22725 0.0 1810.0 - OCT HRC-I dose PNG image
- AUG 1999 - OCT 2001 HRC-I dose PNG image
- OCT HRC-S dose PNG image
- AUG 1999 - OCT 2001 HRC-S dose PNG image
DOSE is now calculated in RAW coordinates instead of DET.
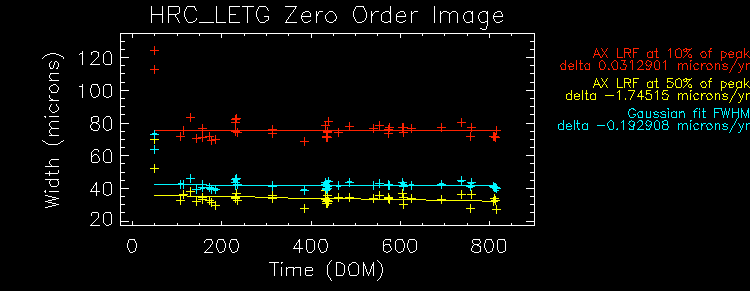
We plot the width of the zero order streak of ACIS/HETG observations and
the width of the zero order image for HRC/LETG observations of point sources.
No significant defocussing trend is seen at this time. See
Gratings Focus
pages.

OCT01
| Motion | Monthly total | Annual Total | Mission Total | Monthly Delta |
|---|---|---|---|---|
| Nov00 thru Oct01 | Jul99 thru Oct01 | current - previous | ||
| SIM | ||||
| SIM FA (STEPS) | 4234.00 | 60296.0 | 221345. | 172.000 |
| SIM TSC (STEPS) | 4.16640e+06 | 5.84409e+07 | 1.27672e+08 | -76585.0 |
| SIM TSC (# Moves) | 28 | 475 | 1140 | -6 |
| mean SIM TSC at ACIS-I/sdev/# obs | 92903.0/ 0.00000/ 4 | 92903.0/ 0.00000/ 74 | 92970.7/ 270.518/ 196 | 0.00000/ -1 |
| mean SIM TSC at ACIS-S/sdev/# obs | 75623.5/ 0.527046/ 10 | 75405.8/ 482.667/ 160 | 75426.2/ 459.717/ 390 | 184.805/ -3 |
| mean SIM TSC at HRC-I/sdev/# obs | -50504.5/ 0.707107/ 2 | -50504.3/ 0.737112/ 25 | -50504.5/ 0.623494/ 74 | 0.500000/ 1 |
| mean SIM TSC at HRC-S/sdev/# obs | -99615.9/ 0.333333/ 9 | -99621.3/ 45.7332/ 146 | -99614.2/ 59.9425/ 314 | 0.109375/ -2 |
| GRATINGS | ||||
| No. HETG insertions | 2.00000 | 36.0000 | 99.0000 | -1.00000 |
| No. LETG insertions | 2.00000 | 18.0000 | 59.0000 | 2.00000 |
| mean HETG inserted angles/sdev (A) | 6.33750/ 0.00000 | 6.34791/ 0.00390625 | 6.71629/ 0.420426 | 0.00000 |
| mean HETG inserted angles/sdev (B) | 6.33750/ 0.00000 | 6.33750/ 0.00000 | 6.45493/ 0.0678629 | 0.00000 |
| mean LETG inserted angles/sdev (A) | 7.08750/ 0.00000 | 7.23333/ 0.0519301 | 8.51373/ 4.41478 | *** |
| mean LETG inserted angles/sdev (B) | 4.46250/ 0.00000 | 4.46250/ 0.00000 | 5.07943/ 6.79655 | *** |
| mean HETG retracted angles/sdev (A) | 79.8375/ 0.00000 | 79.8896/ 0.0172991 | 80.5268/ 0.687935 | 0.00000 |
| mean HETG retracted angles/sdev (B) | 80.5875/ 0.00000 | 80.6396/ 0.0172991 | 81.1518/ 0.595142 | 0.00000 |
| mean LETG retracted angles/sdev (A) | 79.0875/ 0.00000 | 79.2958/ 0.0367647 | 80.4031/ 2.51366 | 0.00000 |
| mean LETG retracted angles/sdev (B) | 78.3375/ 0.00000 | 78.4625/ 0.0330882 | 79.1489/ 0.755533 | 0.375000 |
| Reaction Wheel Rotations | Past 12 Months | Jan00 thru current | ||
| AORWDAY1 | 8.72721e+07 | 9.77196e+08 | 1.61484e+09 | 2.62113e+06 |
| AORWDAY2 | 7.80265e+07 | 9.59573e+08 | 1.56548e+09 | -1.04188e+06 |
| AORWDAY3 | 9.75935e+07 | 1.04760e+09 | 1.72186e+09 | 7.91620e+05 |
| AORWDAY4 | 8.56301e+07 | 9.93237e+08 | 1.62518e+09 | -3.26576e+05 |
| AORWDAY5 | 7.96659e+07 | 9.50261e+08 | 1.55747e+09 | 1.90308e+06 |
| AORWDAY6 | 9.58395e+07 | 1.06004e+09 | 1.72137e+09 | -2.15114e+06 |
Previous Months
| Year | Month | |||||||||||
|---|---|---|---|---|---|---|---|---|---|---|---|---|
| 1999 | Jul | Aug | Sep | Oct | Nov | Dec | ||||||
| 2000 | Jan | Feb | Mar | Apr | May | Jun | Jul | Aug | Sep | Oct | Nov | Dec |
| 2001 | Jan | Feb | Mar | Apr | May | Jun | Jul | Aug | Sep | Oct | Nov | Dec |