- ACIS DOSE registered-photon-map
- NOV registered-photon-map in fits
Statistics:
#                IMAGE        NPIX      MEAN          RMS              MIN    MAX
  ACIS_nov01_total.fits     6004901    5.905         14.294            0.0    14331.0

 ACIS_nov01_total I2 Node 0  262654  5.332285        4.630499           0.0   175.0
 ACIS_nov01_total I2 Node 1  262654  6.409459        8.562094           0.0   303.0
 ACIS_nov01_total I2 Node 2  262654  7.448263        13.059591          0.0   404.0
 ACIS_nov01_total I2 Node 3  262654  8.156453        17.050854          0.0   506.0

 ACIS_nov01_total I3 Node 0  262654  8.495412        17.983638          0.0   502.0
 ACIS_nov01_total I3 Node 1  262654  7.650540        13.657848          0.0   545.0
 ACIS_nov01_total I3 Node 2  262654  6.488144        9.005573           0.0   312.0
 ACIS_nov01_total I3 Node 3  262654  5.238881        4.496267           0.0   174.0

 ACIS_nov01_total S2 Node 0  262397  6.106297        51.337795          0.0  14331.0
 ACIS_nov01_total S2 Node 1  262397  6.899862        14.868258          0.0   303.0
 ACIS_nov01_total S2 Node 2  262397  6.112642        7.455193           0.0  3469.0
 ACIS_nov01_total S2 Node 3  262397  5.837445        2.702221           0.0    37.0

 ACIS_nov01_total S3 Node 0  262397  10.835135       3.859614           0.0    82.0
 ACIS_nov01_total S3 Node 1  262397  12.967328       6.325135           0.0    69.0
 ACIS_nov01_total S3 Node 2  262397  13.115421       5.178487           0.0    79.0
 ACIS_nov01_total S3 Node 3  262397  10.972130       4.054595           0.0   180.0
- Jul 1999 - Nov 2001 registered-photon-map in fits
Statistics:
#                IMAGE        NPIX      MEAN          RMS              MIN    MAX
 ACIS_total.fits            6004901   255.59         474.17            0.0   404123.0

 ACIS_total       I2 node 0  262654  152.545234      122.420427        40.0  9330.0
 ACIS_total       I2 node 1  262654  182.112490      256.131781       100.0  8275.0
 ACIS_total       I2 node 2  262654  207.903596      394.983931       108.0  11559.0
 ACIS_total       I2 node 3  262654  224.642678      523.162252         0.0  14302.0

 ACIS_total       I3 node 0  262654  241.704063      517.203810       125.0  13943.0
 ACIS_total       I3 node 1  262654  221.836682      385.335458       123.0  11030.0
 ACIS_total       I3 node 2  262654  186.509469      249.251098        46.0  8038.0
 ACIS_total       I3 node 3  262654  150.166622      109.904024         0.0  4453.0

 ACIS_total       S2 node 0  262397  306.411102      335.725447       104.0  51434.0
 ACIS_total       S2 node 1  262397  387.438473      986.476460       114.0  19302.0
 ACIS_total       S2 node 2  262397  349.740957      257.077932       139.0  126052.0
 ACIS_total       S2 node 3  262397  341.492361      75.415179          0.0   757.0

 ACIS_total       S3 node 0  262397  689.531062      613.759180       174.0  4575.0
 ACIS_total       S3 node 1  262397  826.884080      673.787660         0.0  69416.0
 ACIS_total       S3 node 2  262397  560.522685      139.472073       170.0  3212.0
 ACIS_total       S3 node 3  262397  495.080557      134.206874         0.0  2968.0
- NOV 2001 dose GIF image
- NOV I3 dose GIF image
- NOV S3 dose GIF image
- TOTAL JUL 1999 - NOV 2001 dose GIF image
- TOTAL I3 dose GIF image
- TOTAL S3 dose GIF image
- NOV registered-photon-map in fits
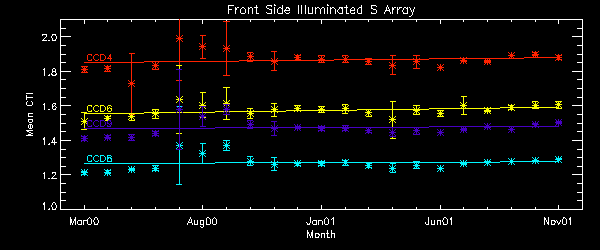
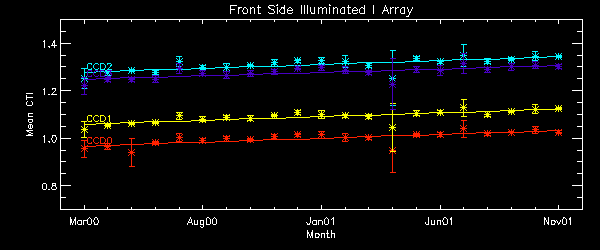
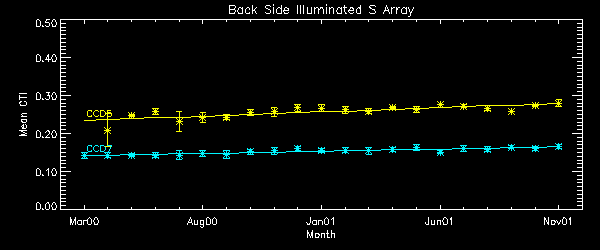
- The Mean CTI
Observations with cold radiator temperature deviation larger than 0.5 C
from the nominal value of -127.92905 C are dropped (after DOM 200).


Mean CTI observed when FPT~ -119 C and no testing modes (Squeegy, cuckoo, etc.) (average of 4 nodes per chip).
CTI's are computed for Mn K alpha, and defined as slope/intercept x10^4 of row # vs ADU.
Data file here


CTI Slope (after DOM 200) CTI slopes were computed for data point after DOM 200 and inside of 1 sigma deviation. Using only data point in 1 sigma range, we drop high temperature observations, squeegy observations, and other outliers. A independent variable is date, and a dependent variable is CTI. Note: Unit is cti/day from this month report. Front Side Illuminated S Array Node 0 Node 1 Node 2 Node 3 CCD4 1.415e-8 1.797e-8 1.848e-8 1.645e-8 CCD6 1.406e-8 1.700e-8 1.607e-8 1.498e-8 CCD8 1.257e-8 1.306e-8 1.273e-8 1.171e-8 CCD9 1.298e-8 1.632e-8 1.496e-8 1.102e-8 AVG 1.264e-8 Front Side Illuminated I Array Node 0 Node 1 Node 2 Node 3 CCD0 1.288e-8 1.724e-8 1.706e-8 1.451e-8 CCD1 1.367e-8 1.570e-8 1.620e-8 1.245e-8 CCD2 1.406e-8 1.643e-8 1.630e-8 1.269e-8 CCD3 1.299e-8 1.536e-8 1.484e-8 1.373e-8 AVG 1.336e-8 Detrended AVG 1.246e-8 Back Side Illuminated S Array Node 0 Node 1 Node 2 Node 3 CCD5 5.414e-9 6.310e-9 6.508e-9 2.852e-9 AVG: 4.930e-9 CCD7 3.138e-9 4.633e-9 4.813e-9 3.075e-9 AVG 3.979e-9
- Focal Plane Temperature
       The Mean (max) FPT: -118.06      std dev: 1.22
               mean width:    0.32      std dev: 0.11
DOY Focal Temp S.D. 306.92 -118.58 0.32 309.49 -118.41 0.24 312.02 -118.90 0.23 314.41 -119.22 0.16 314.86 -117.93 0.48 317.48 -117.61 0.38 320.09 -118.25 0.31 325.39 -114.86 0.51 328.05 -118.74 0.26
New Plots!
From this month, we are using 10 period moving averages to show trends of peak temperatures and peak widths. Note, the gaps in the width plot are due to missing/corrupted data.
- Bad Pixel Candidates
The following pixels consistently showed a bias level more than 5 sigma away the chip's mean level during this period.
CCD0 CCD2 CCD3 CCD4 CCD5 CCD6 CCD7 CCD8 New for This Month (811,637) Previously Reported Warm Pixels (526,66) (247,364) (1-3,775-1022)
(226,565)
(232-245,313)
(510-511,775-1022)
(512,775)
(513,776-1024)
(607,281)
(1022,166)
(360,249)
(766,501)
(1-3, 1-1024)
(510-515,775-1024)
(1022,775)(64,482)
(587,544)Previously Reported - Healed ? (483,816) (453,1) Flickering ? (995,200) (509,spurious rows) (360,249) (4,spurious rows)
(509,spurious rows)
(516,spurious rows)
Hot Pixels - No new hot pixels observed this month.
Previously reported:
Pixel 1022,166 of Quad 4 CCD 5. We define a hot pixel as a pixel with the count rate 1000 counts above the average- Acis Count Rate Plot This monitors the ACIS count Rate vs. EPHIN count Rate.
No sources are removed. For daily updates see: Ephin/Acis Info
- FEP operational Change
From: Royce Buehler
Subject: FEP Power cycling commands

Here are the specifics on the changes we've just made to add FEP power
cycling to the ACIS tables. Dan, let me know who else to forward this
to.

What was changed:
  Every science run which actually calls for a bias, and which
  previously called out a WSVIDALLDN command.

What was not changed:
  Science runs which do not actually call for a bias. (This includes
  configurations like TN_00156B, which do not call for a bias although
  the offline system thinks they do.  Such exceptional simodes all begin with
  TN or CN.)

  Science runs which did not previously call out a WSVIDALLDN command.
  There were around 150 of these, all archaic. The parameter
  generation system can no longer assign any of these to an observation.

What exactly changed:

  The command WSVIDALLDN, followed by a delay of 18 seconds on orbit,
  was replaced by the 3 commands

  AA00000000  (stop science) followed by 4 second delay
  AA00000000     "     "      "          "
  WSPOW00000 (power down all feps and video boards)
		followed by a 24 second delay.

The next command in all of these science runs is a WSPOW
which tells the BEP to power up all FEPs and the specific video
boards needed for the run. We had a premonition long ago that we wouldn't
always be certain of having juice to the FEPs at the start of a
science runt, so we decided to explicitly power on the FEPs and to
provide sufficient following delay (63 seconds) to power up six video
boards, and six FEPs, and to load all the FEPs.  Consequently, there
was no need to adjust this or any of the remaining commands.

Next week, we'll be saving ourselves 27 seconds of science on each
bias run by moving the two dump commands (dump sys config and dump
Huffman tables) to run after the start science command.
- Focal Plane Temperature
-
DOSE of central 4K pore-pairs
- NOV HRC-I dose fits image
        IMAGE                NPIX      MEAN    STDDEV      MIN       MAX
HRCI_11_2001.fits          16777216  0.01685   0.13099     0.0       6.0
- SEP 1999 - NOV 2001 HRC-I dose fits image
        IMAGE                NPIX      MEAN    STDDEV      MIN       MAX
HRCI_08_1999_11_2001.fits  16777216  1.22396   3.18807     0.0        462.0
- :NOV HRC-S dose fits image
        IMAGE                NPIX      MEAN    STDDEV      MIN       MAX
HRCS_11_2001.fits          16777216  0.05182   0.31624     0.0        37.0
- AUG 1999 - NOV 2001 HRC-S dose fits image
IMAGE NPIX MEAN STDDEV MIN MAX HRCS_08_1999_11_2001.fits 16777216 4.10397 10.34303 0.0 1815.0 - NOV HRC-I dose PNG image
- AUG 1999 - NOV 2001 HRC-I dose PNG image
- NOV HRC-S dose PNG image
- AUG 1999 - NOV 2001 HRC-S dose PNG image
DOSE is now calculated in RAW coordinates instead of DET.
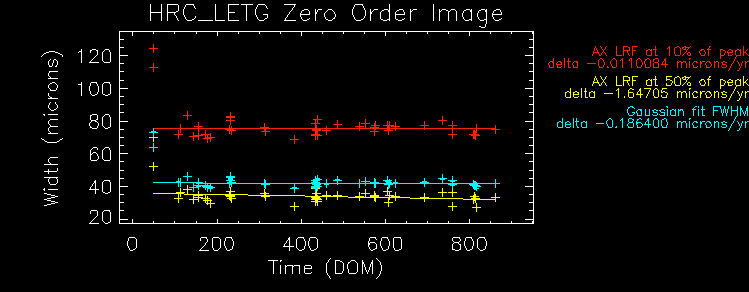
We plot the width of the zero order streak of ACIS/HETG observations and
the width of the zero order image for HRC/LETG observations of point sources.
No significant defocusing trend is seen at this time. See
Gratings Focus
pages.


NOV01
| Motion | Monthly total | Annual Total | Mission Total | Monthly Delta |
|---|---|---|---|---|
| Nov00 thru Nov01 | Jul99 thru Nov01 | current - previous | ||
| SIM | ||||
| SIM FA (STEPS) | 8488.00 | 63806.0 | 229239. | 4848.00 |
| SIM TSC (STEPS) | 5.43387e+06 | 5.91151e+07 | 1.32925e+08 | 1.42224e+06 |
| SIM TSC (# Moves) | 46 | 484 | 1185 | 19 |
| mean SIM TSC at ACIS-I/sdev/# obs | 92903.0/ 0.00000/ 7 | 92903.0/ 0.00000/ 77 | 92968.4/ 266.077/ 203 | 0.00000/ 3 |
| mean SIM TSC at ACIS-S/sdev/# obs | 75473.4/ 409.854/ 16 | 75413.3/ 476.600/ 160 | 75427.6/ 457.953/ 405 | -150.117/ 7 |
| mean SIM TSC at HRC-I/sdev/# obs | -50504.0/ 0.00000/ 1 | -50504.3/ 0.690410/ 25 | -50504.5/ 0.621535/ 75 | 0.500000/ -1 |
| mean SIM TSC at HRC-S/sdev/# obs | -99615.9/ 0.363137/ 14 | -99621.2/ 45.2743/ 149 | -99614.3/ 58.6464/ 328 | 0.0312500/ 5 |
| GRATINGS | ||||
| No. HETG insertions | 2.00000 | 35.0000 | 100.000 | 0.00000 |
| No. LETG insertions | 4.00000 | 21.0000 | 65.0000 | 2.00000 |
| mean HETG inserted angles/sdev (A) | 6.33750/ 0.00000 | 6.34821/ 0.00401785 | 6.71250/ 0.428978 | 0.00000 |
| mean HETG inserted angles/sdev (B) | 6.33750/ 0.00000 | 6.33750/ 0.00000 | 6.48230/ 0.143354 | 0.00000 |
| mean LETG inserted angles/sdev (A) | 7.08750/ 0.00000 | 7.18125/ 0.0277549 | 8.67841/ 6.56852 | 0.00000 |
| mean LETG inserted angles/sdev (B) | 4.46250/ 0.00000 | 5.19464/ 11.2567 | 4.57383/ 0.0566057 | 0.00000 |
| mean HETG retracted angles/sdev (A) | 79.8375/ 0.00000 | 79.8482/ 0.00401786 | 80.5237/ 0.687656 | 0.00000 |
| mean HETG retracted angles/sdev (B) | 80.5875/ 0.00000 | 80.6089/ 0.00779937 | 81.1407/ 0.589484 | 0.00000 |
| mean LETG retracted angles/sdev (A) | 79.0875/ 0.00000 | 79.2482/ 0.0361607 | 80.3624/ 2.44248 | 0.00000 |
| mean LETG retracted angles/sdev (B) | 78.3375/ 0.00000 | 78.4268/ 0.0267857 | 79.1048/ 0.753359 | 0.00000 |
| Reaction Wheel Rotations | Past 12 Months | Jan00 thru current | ||
| AORWDAY1 | 6.50341e+07 | 9.65357e+08 | 1.83934e+09 | -1.73500e+07 |
| AORWDAY2 | 7.60810e+07 | 9.53524e+08 | 1.80955e+09 | -1.27631e+07 |
| AORWDAY3 | 5.79744e+07 | 1.03597e+09 | 1.96097e+09 | -4.40048e+07 |
| AORWDAY4 | 7.00865e+07 | 9.72498e+08 | 1.85409e+09 | -8.72968e+06 |
| AORWDAY5 | 7.10277e+07 | 9.46432e+08 | 1.79712e+09 | -2.13856e+07 |
| AORWDAY6 | 6.29508e+07 | 1.04169e+09 | 1.96460e+09 | -3.53428e+07 |
Radiation Report.
Since September 24, space weather forced 7 radiation-protection actions --- 4 autonomous and 3 commanded. All recoveries proceeded nominally. A total of about 1106 Ksec of scheduled science observing time has been lost due to radiation triggered (autonomous or manual) activations of SCS 107.
- Auto-SCS107 @ 267 (Sep24); resume @ 273 (Sep30). [X2.5, S4]
- Auto-SCS107 @ 275 (Oct02); resume @ 276 (Oct03). [M8, S3]
- Com-SCS107 @ 294 (Oct21); resume @ 296 (Oct23). [X1.6 & X1.6, S1]
- Com-SCS107 @ 298 (Oct25); resume @ 300 (Oct27). [X1.4, S0]
- Auto-SCS107 @ 308 (Nov04); resume @ 312 (Nov08). [X1.0, S4]
- Com-SCS107 @ 324 (Nov20); resume @ 325 (Nov21). [M2.8, S1]
- Auto-SCS107 @ 327 (Nov23); resume @ 329 (Nov25). [X1.0, S4]
The most recent solar-proton storm reached severe (S4) levels. This is the 7th >=S3 event of this solar cycle and the 4th since September 24, of 7 expected for the solar cycle.
Rate of increase of the ACIS CCD CTI continues to fall within allocation. MIT/ Catherine Grant's most recent analysis (data through Nov 18 and consistent with SOT analysis through Nov 29) gives the following:
- FI: 4.7*10^-6 dCTI/y (3.7%/y)
- BI: 1.45*10^-6 dCTI/y (9.9%/y)
There is a natural desire to reduce this rate, especially to minimize the amount of gain re-calibration. After some initial discussions, the CXC SOT is examining quantitatively the potential benefits of scheduling the HRC or gratings during periods of high geomagnetic vulnerability.
SvT has completed software for generating the next Chandra Radiation Model database. This version incorporates Polar data with the Geotail data, to interpolate better the proton fluxes at high GSM latitudes, where Chandra spends much of its time. The database will be interchangeable with the existing one and contains version identifiers for CXC configuration management. SvT is currently exercising software to generate CRM database. We expect that SvT will complete populating the database by the end of 2002 January.
* This memo was originally sent out on Fri, 30 Nov 2001 16:43:18 by Steve O'Dell
Previous Months
| Year | Month | |||||||||||
|---|---|---|---|---|---|---|---|---|---|---|---|---|
| 1999 | Jul | Aug | Sep | Oct | Nov | Dec | ||||||
| 2000 | Jan | Feb | Mar | Apr | May | Jun | Jul | Aug | Sep | Oct | Nov | Dec |
| 2001 | Jan | Feb | Mar | Apr | May | Jun | Jul | Aug | Sep | Oct | Nov | Dec |