- ACIS DOSE registered-photon-map
- DEC registered-photon-map in fits
Statistics:
#                IMAGE        NPIX      MEAN          RMS              MIN    MAX
  ACIS_dec01_total.fits     6004901    6.172         13.244            0.0    12073.0

 ACIS_dec01_total I2 Node 0  262654  5.135144        4.740940          0.0   181.0
 ACIS_dec01_total I2 Node 1  262654  6.367522        9.440790          0.0   330.0
 ACIS_dec01_total I2 Node 2  262654  7.512457        14.461029         0.0   456.0
 ACIS_dec01_total I2 Node 3  262654  8.035533        18.674637         0.0   553.0

 ACIS_dec01_total I3 Node 0  262654  7.991803        18.082663         0.0   534.0
 ACIS_dec01_total I3 Node 1  262654  7.295084        13.746289         0.0   430.0
 ACIS_dec01_total I3 Node 2  262654  6.450703        9.078964          0.0   300.0
 ACIS_dec01_total I3 Node 3  262654  4.754498        4.317640          0.0   172.0

 ACIS_dec01_total S2 Node 0  262397  7.137997        3.211387          0.0   146.0
 ACIS_dec01_total S2 Node 1  262397  9.573177        30.078663         0.0   589.0
 ACIS_dec01_total S2 Node 2  262397  7.903208        9.944571          0.0  4745.0
 ACIS_dec01_total S2 Node 3  262397  7.360557        3.142590          0.0   130.0

 ACIS_dec01_total S3 Node 0  262397  10.829152       5.651104          0.0   201.0
 ACIS_dec01_total S3 Node 1  262397  15.024772       12.535788         0.0   184.0
 ACIS_dec01_total S3 Node 2  262397  11.591680       4.214182          0.0   221.0
 ACIS_dec01_total S3 Node 3  262397  10.226889       4.156365          0.0   800.0
- Jul 1999 - Dec 2001 registered-photon-map in fits
Statistics:
#                IMAGE        NPIX      MEAN          RMS              MIN    MAX
 ACIS_total.fits            6004901   261.72         485.03            0.0   411597.0

 ACIS_total.fits I2 node 0  262654  157.680378      126.464278        42.0  9334.0
 ACIS_total.fits I2 node 1  262654  188.480012      265.185716       102.0  8579.0
 ACIS_total.fits I2 node 2  262654  215.416053      409.146042       113.0  11978.0
 ACIS_total.fits I2 node 3  262654  232.678212      541.567484         0.0  14761.0

 ACIS_total.fits I3 node 0  262654  249.695866      535.026877       130.0  14449.0
 ACIS_total.fits I3 node 1  262654  229.131767      398.768541       127.0  11400.0
 ACIS_total.fits I3 node 2  262654  192.960172      257.896612        48.0  8300.0
 ACIS_total.fits I3 node 3  262654  154.921121      113.560996         0.0  4582.0

 ACIS_total.fits S2 node 0  262397  313.549099      335.927103       106.0  51435.0
 ACIS_total.fits S2 node 1  262397  397.011650      1016.226339      117.0  19816.0
 ACIS_total.fits S2 node 2  262397  357.644165      266.208184       141.0  130797.0
 ACIS_total.fits S2 node 3  262397  348.852918      75.748721          0.0   759.0

 ACIS_total.fits S3 node 0  262397  700.360214      613.325511       179.0  4584.0
 ACIS_total.fits S3 node 1  262397  841.908852      675.841028         0.0  69428.0
 ACIS_total.fits S3 node 2  262397  572.114365      140.409111       178.0  3222.0
 ACIS_total.fits S3 node 3  262397  505.307446      134.861181         0.0  2980.0
- DEC 2001 dose GIF image
- DEC I3 dose GIF image
- DEC S3 dose GIF image
- TOTAL JUL 1999 - DEC 2001 dose GIF image
- TOTAL I3 dose GIF image
- TOTAL S3 dose GIF image
- DEC registered-photon-map in fits
- The Mean CTI
Observations with cold radiator temperature deviation larger than 0.5 C
from the nominal value of -127.92905 C are dropped (after DOM 200).


Mean CTI observed when FPT~ -119 C and no testing modes (Squeegy, cuckoo, etc.) (average of 4 nodes per chip).
CTI's are computed for Mn K alpha, and defined as slope/intercept x10^4 of row # vs ADU.
Data file here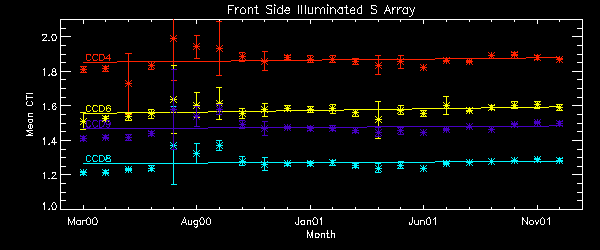
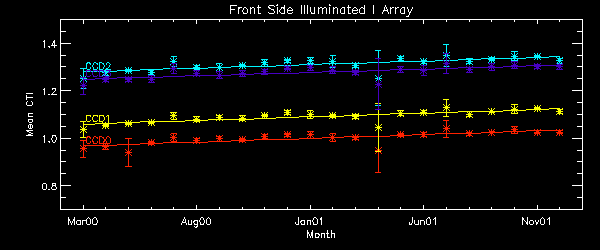
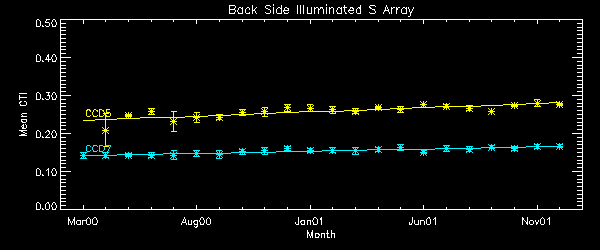
CTI Slope (after DOM 200) CTI slopes were computed for data point after DOM 200 and inside of 1 sigma deviation. Using only data point in 1 sigma range, we drop high temperature observations, squeegy observations, and other outliers. A independent variable is date, and a dependent variable is CTI. Note: Unit is cti/day from this month report. Front Side Illuminated S Array Node 0 Node 1 Node 2 Node 3 CCD4 1.266e-8 1.683e-8 1.789e-8 1.559e-8 CCD6 1.330e-8 1.621e-8 1.530e-8 1.416e-8 CCD8 1.196e-8 1.289e-8 1.191e-8 1.124e-8 CCD9 1.257e-8 1.589e-8 1.448e-8 1.056e-8 AVG 1.230e-8 Front Side Illuminated I Array Node 0 Node 1 Node 2 Node 3 CCD0 1.220e-8 1.631e-8 1.603e-8 1.333e-8 CCD1 1.281e-8 1.467e-8 1.544e-8 1.188e-8 CCD2 1.289e-8 1.532e-8 1.507e-8 1.195e-8 CCD3 1.223e-8 1.421e-8 1.396e-8 1.240e-8 AVG 1.243e-8 Detrended AVG 1.181e-8 Back Side Illuminated S Array Node 0 Node 1 Node 2 Node 3 CCD5 5.396e-9 6.310e-9 6.246e-9 3.005e-9 AVG: 4.924e-9 CCD7 3.205e-9 4.648e-9 4.850e-9 3.134e-9 AVG 4.006e-9
- Focal Plane Temperature
       The Mean (max) FPT: -116.76      std dev: 2.52
               mean width:    0.23      std dev: 0.08
DOY Focal Temp S.D. 349.31 -119.06 0.15 354.32 -114.05 0.33 356.98 -115.19 0.28 364.81 -118.74 0.18
We are using 10 period moving averages to show trends of peak temperatures and peak widths. Note, the gaps in the width plot are due to missing/corrupted data.
- Bad Pixels
Warm pixels consistently showed a bias level more than 5 sigma away the chip's mean level during this period.
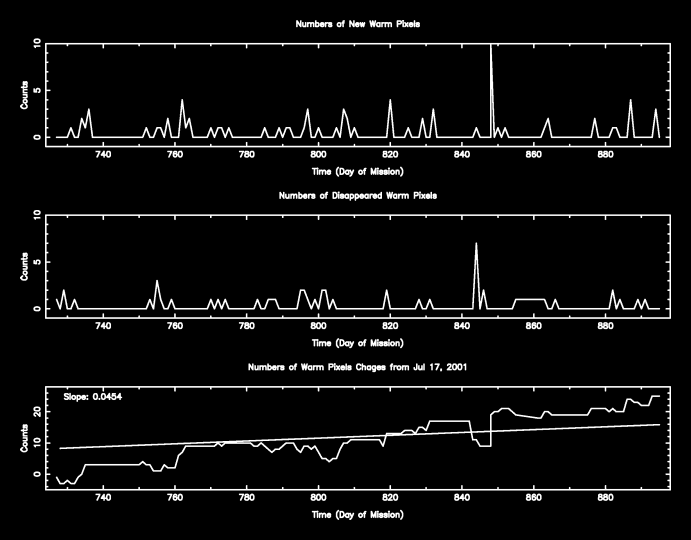
Hot Pixels - No new hot pixels observed this month.
Previously reported:
Pixel 1022,166 of Quad 4 CCD 5. We define a hot pixel as a pixel with the count rate 1000 counts above the average- Acis Count Rate Plot This monitors the ACIS count Rate vs. EPHIN count Rate.
No sources are removed. For daily updates see: Ephin/Acis Info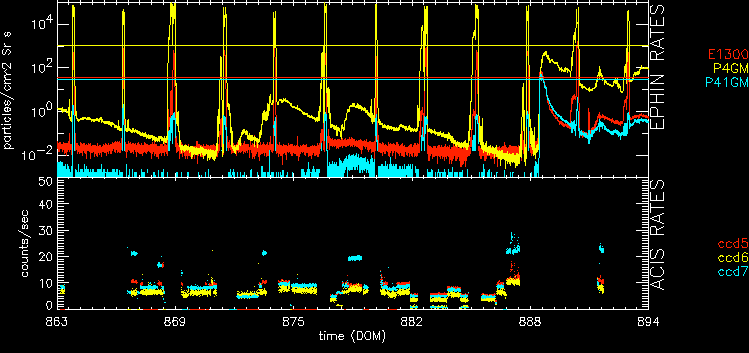
- Focal Plane Temperature
-
DOSE of central 4K pore-pairs
- DEC HRC-I dose fits image
        IMAGE                NPIX      MEAN    STDDEV      MIN       MAX
HRCI_12_2001.fits          16777216  0.01262   0.11243     0.0        3.0
- SEP 1999 - DEC 2001 HRC-I dose fits image
        IMAGE                NPIX      MEAN    STDDEV      MIN       MAX
HRCI_08_1999_12_2001.fits  16777216  1.23658   3.19057     0.0        462.0
- :DEC HRC-S dose fits image
        IMAGE                NPIX      MEAN    STDDEV      MIN       MAX
HRCS_12_2001.fits          16777216  0.05193   0.24342     0.0       11.0
- AUG 1999 - DEC 2001 HRC-S dose fits image
IMAGE NPIX MEAN STDDEV MIN MAX HRCS_08_1999_12_2001.fits 16777216 4.15517 10.40676 0.0 1816.0 - DEC HRC-I dose PNG image
- AUG 1999 - DEC 2001 HRC-I dose PNG image
- DEC HRC-S dose PNG image
- SEP 1999 - DEC 2001 HRC-S dose PNG image
See Maximum Dose Trends
DOSE is now calculated in RAW coordinates instead of DET.
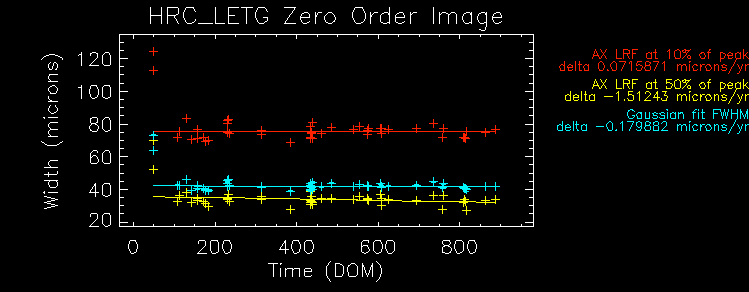
We plot the width of the zero order streak of ACIS/HETG observations and
the width of the zero order image for HRC/LETG observations of point sources.
No significant defocusing trend is seen at this time. See
Gratings Focus
pages.

DEC01
| Motion | Monthly total | Annual Total | Mission Total | Monthly Delta |
|---|---|---|---|---|
| Jan01 thru Dec01 | Jul99 thru Dec01 | current - previous | ||
| SIM | ||||
| SIM FA (STEPS) | 5141.00 | 64145.0 | 234312. | -3279.00 |
| SIM TSC (STEPS) | 4.71555e+06 | 5.90105e+07 | 1.37426e+08 | -503595. |
| SIM TSC (# Moves) | 41 | 484 | 1224 | -3 |
| mean SIM TSC at ACIS-I/sdev/# obs | 92903.0/ 0.00000/ 5 | 92903.0/ 0.00000/ 74 | 92966.8/ 263.035/ 208 | 0.00000/ -2 |
| mean SIM TSC at ACIS-S/sdev/# obs | 75463.4/ 422.199/ 15 | 75411.2/ 459.197/ 164 | 75428.9/ 456.304/ 420 | -10.0391/ -1 |
| mean SIM TSC at HRC-I/sdev/# obs | -50504.5/ 0.707107/ 2 | -50504.4/ 0.646899/ 24 | -50504.5/ 0.618688/ 77 | -0.500000/ 1 |
| mean SIM TSC at HRC-S/sdev/# obs | -99615.8/ 0.404520/ 11 | -99621.2/ 45.5793/ 147 | -99614.4/ 57.7703/ 338 | 0.0234375/ -2 |
| GRATINGS | ||||
| No. HETG insertions | 2.00000 | 35.0000 | 102.000 | 0.00000 |
| No. LETG insertions | 4.00000 | 23.0000 | 68.0000 | 1.00000 |
| mean HETG inserted angles/sdev (A) | 6.33750/ 0.00000 | 6.34791/ 0.00390625 | 6.70515/ 0.423212 | 0.00000 |
| mean HETG inserted angles/sdev (B) | 6.33750/ 0.00000 | 6.33750/ 0.00000 | 6.47949/ 0.140946 | 0.00000 |
| mean LETG inserted angles/sdev (A) | 7.08750/ 0.00000 | 7.15568/ 0.0219156 | 8.60924/ 6.38555 | 0.00000 |
| mean LETG inserted angles/sdev (B) | 4.46250/ 0.00000 | 4.46250/ 0.00000 | 4.56884/ 0.0545708 | 0.00000 |
| mean HETG retracted angles/sdev (A) | 79.8375/ 0.00000 | 79.8375/ 0.00000 | 80.5102/ 0.683181 | 0.00000 |
| mean HETG retracted angles/sdev (B) | 80.5875/ 0.00000 | 80.5982/ 0.00401786 | 81.1299/ 0.583810 | 0.00000 |
| mean LETG retracted angles/sdev (A) | 79.0875/ 0.00000 | 79.2179/ 0.0333498 | 80.3062/ 2.40269 | 0.00000 |
| mean LETG retracted angles/sdev (B) | 78.3375/ 0.00000 | 78.4027/ 0.0211215 | 79.0709/ 0.744824 | 0.00000 |
| Reaction Wheel Rotations | Past 12 Months | Jan00 thru current | ||
| AORWDAY1 | 6.50341e+07 | 9.65357e+08 | 1.83934e+09 | -1.73500e+07 |
| AORWDAY2 | 7.60810e+07 | 9.53524e+08 | 1.80955e+09 | -1.27631e+07 |
| AORWDAY3 | 5.79744e+07 | 1.03597e+09 | 1.96097e+09 | -4.40048e+07 |
| AORWDAY4 | 7.00865e+07 | 9.72498e+08 | 1.85409e+09 | -8.72968e+06 |
| AORWDAY5 | 7.10277e+07 | 9.46432e+08 | 1.79712e+09 | -2.13856e+07 |
| AORWDAY6 | 6.29508e+07 | 1.04169e+09 | 1.96460e+09 | -3.53428e+07 |
Previous Months
| Year | Month | |||||||||||
|---|---|---|---|---|---|---|---|---|---|---|---|---|
| 1999 | Jul | Aug | Sep | Oct | Nov | Dec | ||||||
| 2000 | Jan | Feb | Mar | Apr | May | Jun | Jul | Aug | Sep | Oct | Nov | Dec |
| 2001 | Jan | Feb | Mar | Apr | May | Jun | Jul | Aug | Sep | Oct | Nov | Dec |
