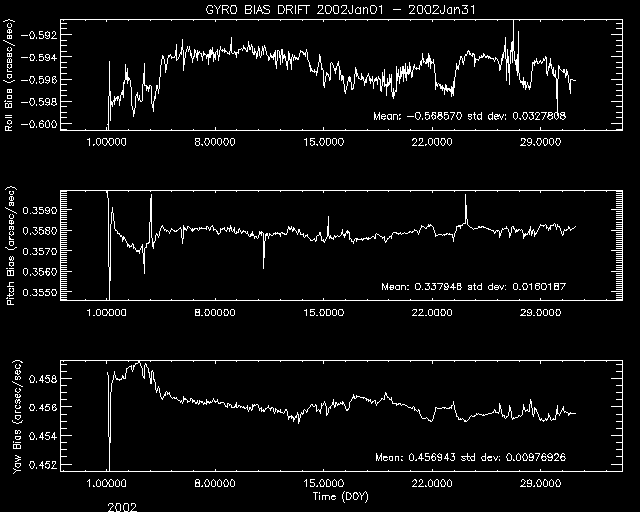
- ACIS DOSE registered-photon-map
- JAN registered-photon-map in fits
Statistics:
#                IMAGE        NPIX      MEAN          RMS              MIN    MAX
  ACIS_jan02_total.fits     6004901    4.598         8.5899            0.0    13144.0

 ACIS_jan02_total I2 Node 0  262654  3.876031        2.975968          0.0    100.0
 ACIS_jan02_total I2 Node 1  262654  4.413639        4.835803           0.0   162.0
 ACIS_jan02_total I2 Node 2  262654  4.904764        6.959165           0.0   232.0
 ACIS_jan02_total I2 Node 3  262654  5.384887        9.173664           0.0   265.0

 ACIS_jan02_total I3 Node 0  262654  5.462277        8.730965           0.0   261.0
 ACIS_jan02_total I3 Node 1  262654  4.902804        6.614133           0.0   207.0
 ACIS_jan02_total I3 Node 2  262654  4.337642        4.589853           0.0   148.0
 ACIS_jan02_total I3 Node 3  262654  3.686458        2.706013           0.0    83.0

 ACIS_jan02_total S2 Node 0  262397  5.648616        2.576728           0.0    41.0
 ACIS_jan02_total S2 Node 1  262397  6.430577        11.359793          0.0   256.0
 ACIS_jan02_total S2 Node 2  262397  5.808085        8.660591           0.0  4211.0
 ACIS_jan02_total S2 Node 3  262397  5.688041        2.645374           0.0    39.0

 ACIS_jan02_total S3 Node 0  262397  9.765043        3.216447           0.0    32.0
 ACIS_jan02_total S3 Node 1  262397  10.437490       3.933245           0.0    52.0
 ACIS_jan02_total S3 Node 2  262397  10.038327       3.286107           0.0    62.0
 ACIS_jan02_total S3 Node 3  262397  9.498195        3.325460           0.0   212.0
- Jul 1999 - Jan 2002 registered-photon-map in fits
Statistics:
#                IMAGE        NPIX      MEAN          RMS              MIN    MAX
 ACIS_total.fits            6004901   266.32         491.36            0.0   416576.0

 ACIS_total.fits I2 node 0  262654  161.556409      128.563513        42.0  9336.0
 ACIS_total.fits I2 node 1  262654  192.893651      269.484591       106.0  8717.0
 ACIS_total.fits I2 node 2  262654  220.320818      415.700854       115.0  12190.0
 ACIS_total.fits I2 node 3  262654  238.063098      550.402288         0.0  14975.0

 ACIS_total.fits I3 node 0  262654  255.158143      543.408642       136.0  14655.0
 ACIS_total.fits I3 node 1  262654  234.034570      404.977517       130.0  11562.0
 ACIS_total.fits I3 node 2  262654  197.297814      261.967215        49.0  8404.0
 ACIS_total.fits I3 node 3  262654  158.607579      115.428282         0.0  4665.0

 ACIS_total.fits S2 node 0  262397  319.197716      336.041980       110.0  51440.0
 ACIS_total.fits S2 node 1  262397  403.442227      1027.264112      123.0  20018.0
 ACIS_total.fits S2 node 2  262397  363.452250      274.274834       147.0  135008.0
 ACIS_total.fits S2 node 3  262397  354.540959      76.170210          0.0   767.0

 ACIS_total.fits S3 node 0  262397  710.125257      613.354274       182.0  4596.0
 ACIS_total.fits S3 node 1  262397  852.346342      676.492274         0.0  69435.0
 ACIS_total.fits S3 node 2  262397  582.152692      140.748090       180.0  3230.0
 ACIS_total.fits S3 node 3  262397  514.805642      135.474915         0.0  2990.0
- JAN 2002 dose GIF image
- JAN I3 dose GIF image
- JAN S3 dose GIF image
- TOTAL JUL 1999 - JAN 2002 dose GIF image
- TOTAL I3 dose GIF image
- TOTAL S3 dose GIF image
- JAN registered-photon-map in fits
- The Mean CTI
Observations with cold radiator temperature deviation larger than 0.5 C
from the nominal value of -127.92905 C are dropped (after DOM 200).


Mean CTI observed when FPT~ -119 C and no testing modes (Squeegy, cuckoo, etc.) (average of 4 nodes per chip).
CTI's are computed for Mn K alpha, and defined as slope/intercept x10^4 of row # vs ADU.
Data file here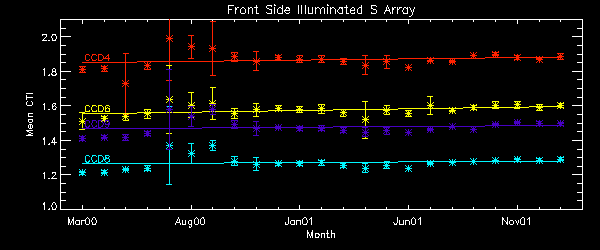
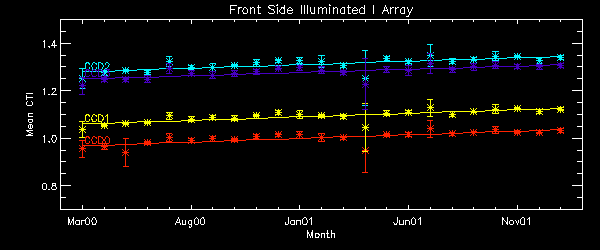
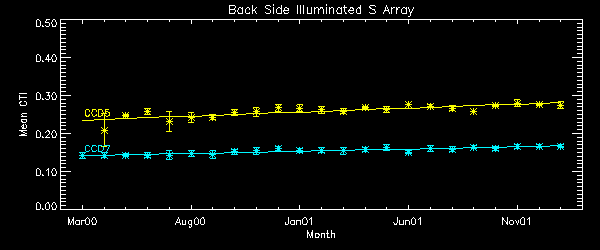
CTI Slope (after DOM 200) CTI slopes were computed for data point after DOM 200 and inside of 1 sigma deviation. Using only data point in 1 sigma range, we drop high temperature observations, squeegy observations, and other outliers. A independent variable is date, and a dependent variable is CTI. Note: Unit is cti/day from this month report. Front Side Illuminated S Array Node 0 Node 1 Node 2 Node 3 CCD4 1.220e-8 1.615e-8 1.763e-8 1.492e-8 CCD6 1.295e-8 1.585e-8 1.482e-8 1.380e-8 CCD8 1.164e-8 1.255e-8 1.157e-8 1.102e-8 CCD9 1.222e-8 1.538e-8 1.434e-8 1.053e-8 AVG 1.195e-8 Front Side Illuminated I Array Node 0 Node 1 Node 2 Node 3 CCD0 1.164e-8 1.561e-8 1.565e-8 1.248e-8 CCD1 1.233e-8 1.407e-8 1.482e-8 1.129e-8 CCD2 1.235e-8 1.472e-8 1.444e-8 1.095e-8 CCD3 1.168e-8 1.314e-8 1.347e-8 1.229e-8 AVG 1.198e-8 Detrended AVG 1.121e-8 Back Side Illuminated S Array Node 0 Node 1 Node 2 Node 3 CCD5 5.289e-9 6.234e-9 6.175e-9 3.031e-9 AVG: 4.885e-9 CCD7 3.227e-9 4.703e-9 4.728e-9 3.094e-9 AVG 3.987e-9
- Focal Plane Temperature
       The Mean (max) FPT: -118.07      std dev: 1.01
               mean width:    0.50      std dev: 0.22
DOY Focal Temp S.D. 2.25 -119.22 0.21 4.78 -118.74 0.43 10.18 -117.93 0.65 13.03 -116.96 0.95 15.37 -118.09 0.94 18.18 -118.58 0.52 20.93 -118.25 0.38 23.53 -115.35 0.32 26.26 -117.93 0.37 28.85 -118.74 0.38 29.72 -119.06 0.48 31.49 -117.93 0.40
We are using 10 period moving averages to show trends of peak temperatures and peak widths. Note, the gaps in the width plot are due to missing/corrupted data.
- Bad Pixels
Many of the S1 and S3 "bad pixels" are not bad at all. The bias frames have a lot of real structure in them and since the hot pixel finder is comparing pixels to a global average across the CCD, the extremes of the bias structure are getting picked up. - Catherine GrantWarm pixels consistently showed a bias level more than 5 sigma away the chip's mean level during this period.
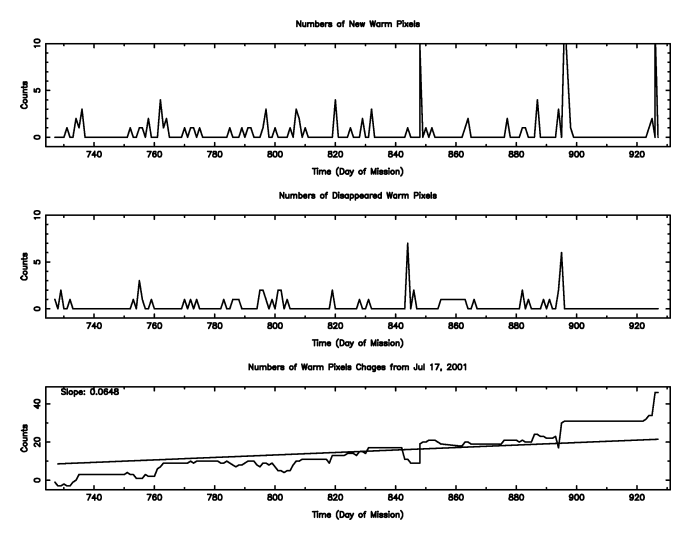
Hot Pixels - No new hot pixels observed this month.
Previously reported:
Pixel 1022,166 of Quad 4 CCD 5. We define a hot pixel as a pixel with the count rate 1000 counts above the average- Acis Count Rate Plot This monitors the ACIS count Rate vs. EPHIN count Rate.
No sources are removed. For daily updates see: Ephin/Acis Info
- Focal Plane Temperature
-
DOSE of central 4K pore-pairs
- JAN HRC-I dose fits image
        IMAGE                NPIX      MEAN    STDDEV      MIN       MAX
HRCI_01_2002.fits          16777216  0.05612   0.29513     0.0        20.0
- SEP 1999 - JAN 2002 HRC-I dose fits image
        IMAGE                NPIX      MEAN    STDDEV      MIN       MAX
HRCI_08_1999_01_2002.fits  16777216  1.29270   3.28482     0.0        464.0
- :JAN HRC-S dose fits image
        IMAGE                NPIX      MEAN    STDDEV      MIN       MAX
HRCS_01_2002.fits          16777216  0.23522   0.68339     0.0        34.0
- AUG 1999 - JAN 2002 HRC-S dose fits image
IMAGE NPIX MEAN STDDEV MIN MAX HRCS_08_1999_01_2002.fits 16777216 4.39039 10.75958 0.0 1819.0 - JAN HRC-I dose PNG image
- AUG 1999 - JAN 2002 HRC-I dose PNG image
- JAN HRC-S dose PNG image
- AUG 1999 - JAN 2002 HRC-S dose PNG image
See Maximum Dose Trends
DOSE is now calculated in RAW coordinates instead of DET.
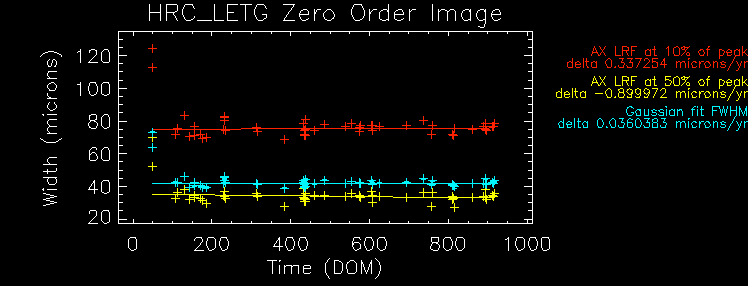
We plot the width of the zero order streak of ACIS/HETG observations and
the width of the zero order image for HRC/LETG observations of point sources.
No significant defocusing trend is seen at this time. See
Gratings Focus
pages.

JAN02
| Motion | Monthly total | Annual Total | Mission Total | Monthly Delta |
|---|---|---|---|---|
| Jan01 thru Jan02 | Jul99 thru Jan02 | current - previous | ||
| SIM | ||||
| SIM FA (STEPS) | 6939.00 | 62356.0 | 241251. | 1798.00 |
| SIM TSC (STEPS) | 4.74701e+06 | 5.74537e+07 | 1.42173e+08 | 31461.0 |
| SIM TSC (# Moves) | 48 | 478 | 1272 | 7 |
| mean SIM TSC at ACIS-I/sdev/# obs | 92903.0/ 0.00000/ 8 | 92903.0/ 0.00000/ 71 | 92964.5/ 258.376/ 216 | 0.00000/ 3 |
| mean SIM TSC at ACIS-S/sdev/# obs | 75481.7/ 580.898/ 17 | 75405.2/ 482.607/ 165 | 75431.0/ 461.068/ 437 | 18.3047/ 2 |
| mean SIM TSC at HRC-I/sdev/# obs | -50504.5/ 0.577350/ 4 | -50504.3/ 0.637022/ 24 | -50504.5/ 0.613380/ 81 | 0.00000/ 2 |
| mean SIM TSC at HRC-S/sdev/# obs | -99615.9/ 0.301511/ 11 | -99621.4/ 46.3686/ 142 | -99614.4/ 56.8508/ 349 | -0.0859375/ 0 |
| GRATINGS | ||||
| No. HETG insertions | 2.00000 | 35.0000 | 102.000 | 0.00000 |
| No. LETG insertions | 4.00000 | 23.0000 | 68.0000 | 1.00000 |
| mean HETG inserted angles/sdev (A) | 6.33750/ 0.00000 | 6.34791/ 0.00390625 | 6.70515/ 0.423212 | 0.00000 |
| mean HETG inserted angles/sdev (B) | 6.33750/ 0.00000 | 6.33750/ 0.00000 | 6.47949/ 0.140946 | 0.00000 |
| mean LETG inserted angles/sdev (A) | 7.08750/ 0.00000 | 7.15568/ 0.0219156 | 8.60924/ 6.38555 | 0.00000 |
| mean LETG inserted angles/sdev (B) | 4.46250/ 0.00000 | 4.46250/ 0.00000 | 4.56884/ 0.0545708 | 0.00000 |
| mean HETG retracted angles/sdev (A) | 79.8375/ 0.00000 | 79.8375/ 0.00000 | 80.5102/ 0.683181 | 0.00000 |
| mean HETG retracted angles/sdev (B) | 80.5875/ 0.00000 | 80.5982/ 0.00401786 | 81.1299/ 0.583810 | 0.00000 |
| mean LETG retracted angles/sdev (A) | 79.0875/ 0.00000 | 79.2179/ 0.0333498 | 80.3062/ 2.40269 | 0.00000 |
| mean LETG retracted angles/sdev (B) | 78.3375/ 0.00000 | 78.4027/ 0.0211215 | 79.0709/ 0.744824 | 0.00000 |
| Reaction Wheel Rotations | Past 12 Months | Jan00 thru current | ||
| AORWDAY1 | 6.50341e+07 | 9.65357e+08 | 1.83934e+09 | -1.73500e+07 |
| AORWDAY2 | 7.60810e+07 | 9.53524e+08 | 1.80955e+09 | -1.27631e+07 |
| AORWDAY3 | 5.79744e+07 | 1.03597e+09 | 1.96097e+09 | -4.40048e+07 |
| AORWDAY4 | 7.00865e+07 | 9.72498e+08 | 1.85409e+09 | -8.72968e+06 |
| AORWDAY5 | 7.10277e+07 | 9.46432e+08 | 1.79712e+09 | -2.13856e+07 |
| AORWDAY6 | 6.29508e+07 | 1.04169e+09 | 1.96460e+09 | -3.53428e+07 |
Previous Months
| Year | Month | |||||||||||
|---|---|---|---|---|---|---|---|---|---|---|---|---|
| 1999 | Jul | Aug | Sep | Oct | Nov | Dec | ||||||
| 2000 | Jan | Feb | Mar | Apr | May | Jun | Jul | Aug | Sep | Oct | Nov | Dec |
| 2001 | Jan | Feb | Mar | Apr | May | Jun | Jul | Aug | Sep | Oct | Nov | Dec |
