- ACIS DOSE registered-photon-map
- FEB registered-photon-map in fits
Statistics:
#                IMAGE        NPIX      MEAN          RMS              MIN    MAX
  ACIS_feb02_total.fits     6004901    7.716         19.394            0.0    5759.0

 ACIS_feb02_total I2 Node 0  262654  5.126828        5.710425           0.0   222.0
 ACIS_feb02_total I2 Node 1  262654  6.870156        12.114602          0.0   439.0
 ACIS_feb02_total I2 Node 2  262654  8.124476        18.998071          0.0   589.0
 ACIS_feb02_total I2 Node 3  262654  8.956041        25.292520          0.0   767.0

 ACIS_feb02_total I3 Node 0  262654  9.466378        24.692216          0.0   716.0
 ACIS_feb02_total I3 Node 1  262654  8.628500        18.573323          0.0   582.0
 ACIS_feb02_total I3 Node 2  262654  6.776105        11.937039          0.0   390.0
 ACIS_feb02_total I3 Node 3  262654  4.755332        5.409434           0.0   219.0

 ACIS_feb02_total S2 Node 0  262397  5.157814        2.600915           0.0    40.0
 ACIS_feb02_total S2 Node 1  262397  7.042432        23.723017          0.0   513.0
 ACIS_feb02_total S2 Node 2  262397  5.479247        7.831944           0.0  3765.0
 ACIS_feb02_total S2 Node 3  262397  5.387108        2.993383           0.0    39.0

 ACIS_feb02_total S3 Node 0  262397  12.233116       17.930966          0.0   274.0
 ACIS_feb02_total S3 Node 1  262397  35.358731       40.722145          0.0   318.0
 ACIS_feb02_total S3 Node 2  262397  34.734856       39.775611          0.0   274.0
 ACIS_feb02_total S3 Node 3  262397  7.335838        3.471905           0.0   381.0
- Jul 1999 - Feb 2002 registered-photon-map in fits
Statistics:
#                IMAGE        NPIX      MEAN          RMS              MIN    MAX
 ACIS_total.fits            6004901   274.03         503.61            0.0   422335.0

 ACIS_total.fits I2 node 0  262654  166.683237      133.677465        42.0   9342.0
 ACIS_total.fits I2 node 1  262654  199.763807      281.260710       107.0   9089.0
 ACIS_total.fits I2 node 2  262654  228.445293      434.449174       126.0  12751.0
 ACIS_total.fits I2 node 3  262654  247.019139      575.463509         0.0  15707.0

 ACIS_total.fits I3 node 0  262654  264.624521      567.832973       140.0  15295.0
 ACIS_total.fits I3 node 1  262654  242.663070      423.246488       132.0  12106.0
 ACIS_total.fits I3 node 2  262654  204.073919      273.574994        53.0   8741.0
 ACIS_total.fits I3 node 3  262654  163.362911      120.317933         0.0   4824.0

 ACIS_total.fits S2 node 0  262397  324.355530      336.187572       111.0  51441.0
 ACIS_total.fits S2 node 1  262397  410.484659      1050.779488      126.0  20504.0
 ACIS_total.fits S2 node 2  262397  368.931497      281.477559       152.0 138773.0
 ACIS_total.fits S2 node 3  262397  359.928067      76.734106          0.0    786.0

 ACIS_total.fits S3 node 0  262397  722.358373      615.057640       186.0   4611.0
 ACIS_total.fits S3 node 1  262397  887.705073      682.315107         0.0  69505.0
 ACIS_total.fits S3 node 2  262397  616.887548      162.673456       187.0   3237.0
 ACIS_total.fits S3 node 3  262397  522.141480      136.248420         0.0   3003.0
- FEB 2002 dose GIF image
- FEB I3 dose GIF image
- FEB S3 dose GIF image
- TOTAL JUL 1999 - FEB 2002 dose GIF image
- TOTAL I3 dose GIF image
- TOTAL S3 dose GIF image
- FEB registered-photon-map in fits
- The Mean CTI
Observations with cold radiator temperature deviation larger than 0.5 C
from the nominal value of -127.92905 C are dropped (after DOM 200).


Mean CTI observed when FPT~ -119 C and no testing modes (Squeegy, cuckoo, etc.) (average of 4 nodes per chip).
CTI's are computed for Mn K alpha, and defined as slope/intercept x10^4 of row # vs ADU.
Data file here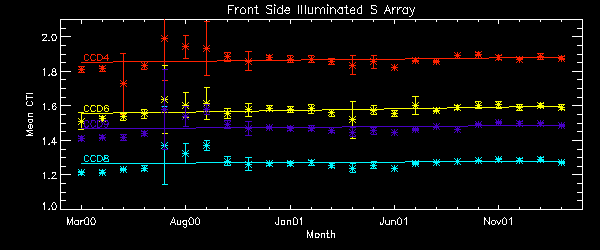
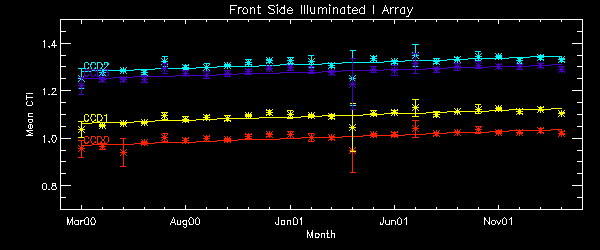
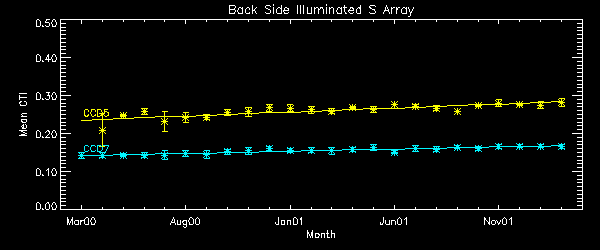
CTI Slope (after DOM 200) CTI slopes were computed for data point after DOM 200 and inside of 1 sigma deviation. Using only data point in 1 sigma range, we drop high temperature observations, squeegy observations, and other outliers. A independent variable is date, and a dependent variable is CTI. Note: Unit is cti/day from this month report. Front Side Illuminated S Array Node 0 Node 1 Node 2 Node 3 CCD4 1.145e-8 1.494e-8 1.632e-8 1.385e-8 CCD6 1.241e-8 1.484e-8 1.401e-8 1.315e-8 CCD8 1.084e-8 1.196e-8 1.075e-8 1.014e-8 CCD9 1.155e-8 1.450e-8 1.341e-8 1.004e-8 AVG 1.108e-8 Front Side Illuminated I Array Node 0 Node 1 Node 2 Node 3 CCD0 1.125e-8 1.488e-8 1.459e-8 1.195e-8 CCD1 1.173e-8 1.318e-8 1.387e-8 1.076e-8 CCD2 1.182e-8 1.415e-8 1.375e-8 1.047e-8 CCD3 1.104e-8 1.240e-8 1.314e-8 1.176e-8 AVG 1.142e-8 Detrended AVG 1.106e-8 Back Side Illuminated S Array Node 0 Node 1 Node 2 Node 3 CCD5 5.327e-9 6.258e-9 6.136e-9 3.016e-9 AVG: 4.900e-9 CCD7 3.191e-9 4.707e-9 4.654e-9 3.108e-9 AVG 3.951e-9
- Focal Plane Temperature
       The Mean (max) FPT: -114.99      std dev: 2.47
               mean width:    0.69      std dev: 0.22
DOY Focal Temp S.D. 34.17 -118.58 0.44 36.85 -114.22 0.61 39.49 -113.73 0.58 42.16 -113.25 0.59 44.73 -117.77 0.43 47.27 -117.28 0.77 50.08 -112.60 0.87 52.75 -111.79 0.66 55.37 -113.41 0.85
We are using 10 period moving averages to show trends of peak temperatures and peak widths. Note, the gaps in the width plot are due to missing/corrupted data.
- Bad Pixels
Many of the S1 and S3 "bad pixels" are not bad at all. The bias frames have a lot of real structure in them and since the hot pixel finder is comparing pixels to a global average across the CCD, the extremes of the bias structure are getting picked up. - Catherine GrantWarm pixels consistently showed a bias level more than 5 sigma away the chip's mean level during this period.
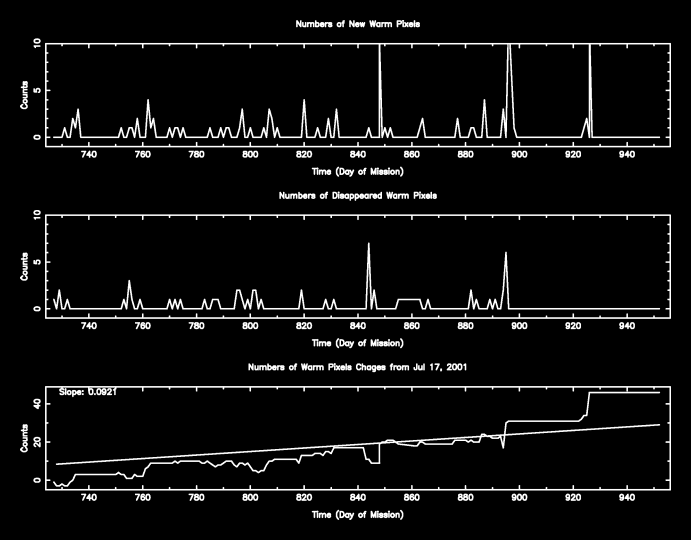
Hot Pixels - No new hot pixels observed this month.
Previously reported:
Pixel 1022,166 of Quad 4 CCD 5. We define a hot pixel as a pixel with the count rate 1000 counts above the average- Acis Count Rate Plot This monitors the ACIS count Rate vs. EPHIN count Rate.
No sources are removed. For daily updates see: Ephin/Acis Info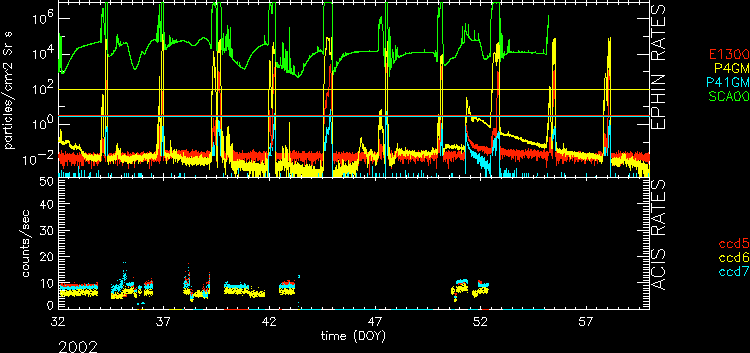
- Focal Plane Temperature
-
DOSE of central 4K pore-pairs
- FEB HRC-I dose fits image
        IMAGE                NPIX      MEAN    STDDEV      MIN       MAX
HRCI_02_2002.fits          16777216  0.03559   0.21181     0.0       15.0
- SEP 1999 - FEB 2002 HRC-I dose fits image
        IMAGE                NPIX      MEAN    STDDEV      MIN       MAX
HRCI_08_1999_02_2002.fits  16777216  1.32829   3.33511     0.0        464.0
- :FEB HRC-S dose fits image
        IMAGE                NPIX      MEAN    STDDEV      MIN       MAX
HRCS_02_2002.fits          16777216  0.01738   0.13274     0.0       4.0
- AUG 1999 - FEB 2002 HRC-S dose fits image
IMAGE NPIX MEAN STDDEV MIN MAX HRCS_08_1999_02_2002.fits 16777216 4.40777 10.76617 0.0 1819.0 - FEB HRC-I dose PNG image
- AUG 1999 - FEB 2002 HRC-I dose PNG image
- FEB HRC-S dose PNG image
- SEP 1999 - FEB 2002 HRC-S dose PNG image
See Maximum Dose Trends
DOSE is now calculated in RAW coordinates instead of DET.
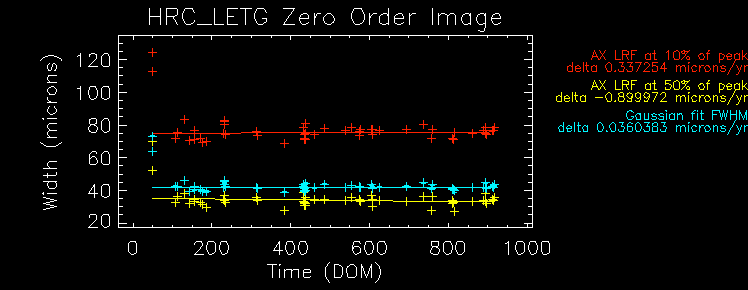
We plot the width of the zero order streak of ACIS/HETG observations and
the width of the zero order image for HRC/LETG observations of point sources.
No significant defocusing trend is seen at this time. See
Gratings Focus
pages.

Feb 2002 Timing Plots Entire Mission Timing Plots
