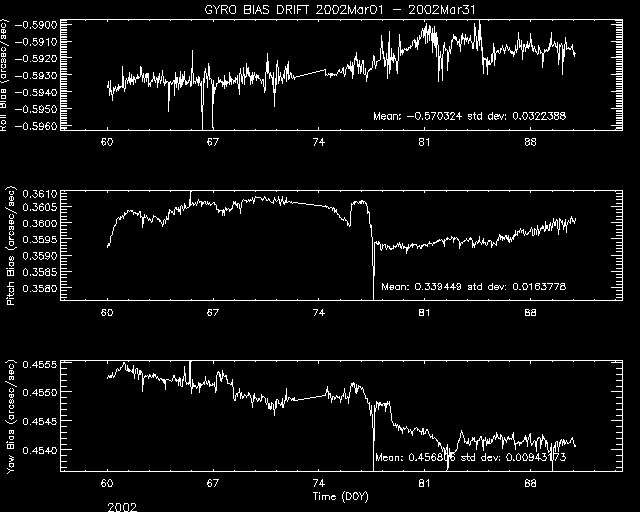
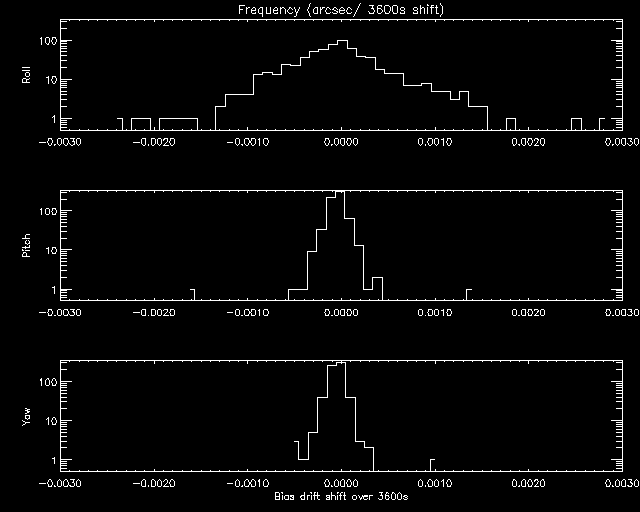
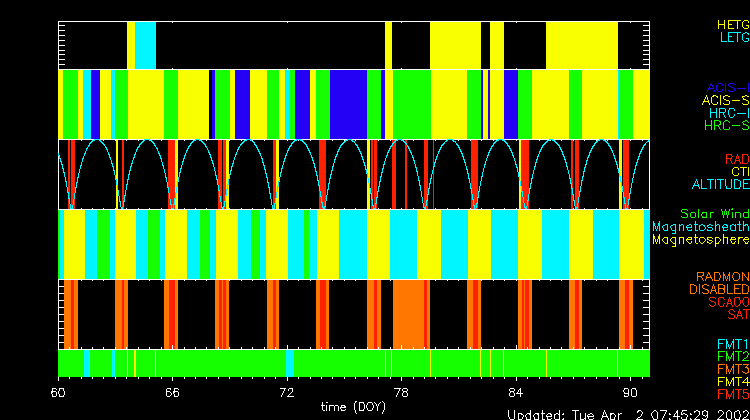
Configuration/Radiation Overview for March 2002
ACIS
- ACIS DOSE registered-photon-map
- MAR registered-photon-map in fits
Statistics:
# IMAGE     NPIX      MEAN          RMS              MIN    MAX
ACIS Mar03 6004901    7.851         20.322            0.0   37764.0

 I2 Node 0  262654  5.479391        4.735589           0.0   168.0
 I2 Node 1  262654  6.587179        8.804329           0.0   305.0
 I2 Node 2  262654  7.511521        13.389416          0.0   394.0
 I2 Node 3  262654  8.152432        17.156435          0.0   503.0

 I3 Node 0  262654  8.123478        16.748288          0.0   501.0
 I3 Node 1  262654  7.299592        12.719946          0.0   398.0
 I3 Node 2  262654  6.325078        8.522193           0.0   277.0
 I3 Node 3  262654  5.109185        4.350224           0.0   169.0

 S2 Node 0  262397  9.943323        4.065224           0.0   221.0
 S2 Node 1  262397  12.364676       29.956557          0.0   590.0
 S2 Node 2  262397  10.781366       6.721263           0.0  2316.0
 S2 Node 3  262397  10.914252       4.315635           0.0    47.0

 S3 Node 0  262397  16.095588       7.422229           0.0   166.0
 S3 Node 1  262397  20.133294       8.489734           0.0   141.0
 S3 Node 2  262397  20.091000       7.874727           1.0   115.0
 S3 Node 3  262397  14.349131       5.250872           0.0   458.0
- Jul 1999 - Mar 2002 registered-photon-map in fits
Statistics:
 IMAGE        NPIX      MEAN          RMS              MIN    MAX
 ACIS_total 6004901   281.89         517.78            0.0   432150.0

 I2 node 0  262654  172.162628      137.633126        42.0   9347.0
 I2 node 1  262654  206.350986      289.608582       112.0   9349.0
 I2 node 2  262654  235.956814      447.501860       134.0  13122.0
 I2 node 3  262654  255.171572      592.337095         0.0  16147.0

 I3 node 0  262654  272.747999      584.301649       145.0  15680.0
 I3 node 1  262654  249.962662      435.646314       136.0  12459.0
 I3 node 2  262654  210.398996      281.695820        53.0   9016.0
 I3 node 3  262654  168.472096      124.002768         0.0   4975.0

 S2 node 0  262397  334.298853      336.465215       112.0  51453.0
 S2 node 1  262397  422.849335      1079.92983       128.0  21058.0
 S2 node 2  262397  379.712863      286.555800       157.0 141089.0
 S2 node 3  262397  370.842319      78.759360          0.0    811.0

 S3 node 0  262397  738.453961      617.352632       192.0   4627.0
 S3 node 1  262397  907.838367      684.831452         0.0  69530.0
 S3 node 2  262397  636.978548      165.064466       199.0   3252.0
 S3 node 3  262397  536.490612      137.996398         0.0   3025.0
- MAR 2002 dose GIF image
- MAR I3 dose GIF image
- MAR S3 dose GIF image
- TOTAL JUL 1999 - MAR 2002 dose GIF image
- TOTAL I3 dose GIF image
- TOTAL S3 dose GIF image
- MAR registered-photon-map in fits
- The Mean CTI
Observations with cold radiator temperature deviation larger than 0.5 C
from the nominal value of -127.92905 C are dropped (after DOM 200).


Mean CTI observed when FPT~ -119 C and no testing modes (Squeegy, cuckoo, etc.) (average of 4 nodes per chip).
CTI's are computed for Mn K alpha, and defined as slope/intercept x10^4 of row # vs ADU.
Data file here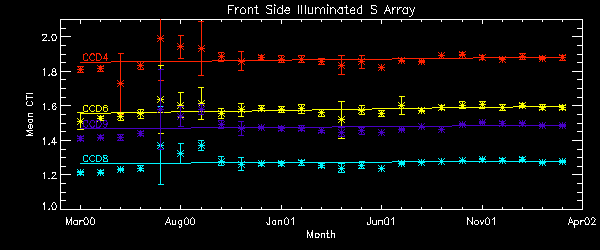
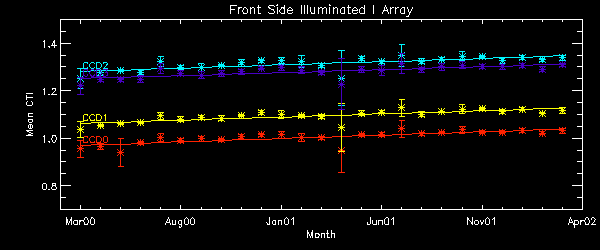
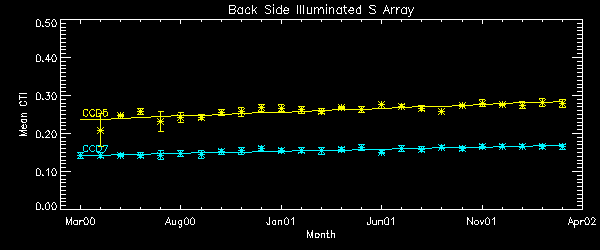
CTI Slope (after DOM 200) CTI slopes were computed for data point after DOM 200 and inside of 1 sigma deviation. Using only data point in 1 sigma range, we drop high temperature observations, squeegy observations, and other outliers. A independent variable is date, and a dependent variable is CTI. Note: Unit is cti/day from this month report. Front Side Illuminated S Array Node 0 Node 1 Node 2 Node 3 CCD4 1.117e-8 1.430e-8 1.551e-8 1.352e-8 CCD6 1.187e-8 1.401e-8 1.357e-8 1.284e-8 CCD8 R1.046-8 1.142e-8 1.035e-8 9.714e-9 CCD9 1.117e-8 1.410e-8 1.330e-8 9.883e-9 AVG 1.072e-8 Front Side Illuminated I Array Node 0 Node 1 Node 2 Node 3 CCD0 1.091e-8 1.435e-8 1.408e-8 1.146e-8 CCD1 1.122e-8 1.276e-8 1.330e-8 1.041e-8 CCD2 1.138e-8 1.371e-8 1.345e-8 9.993e-9 CCD3 1.117e-8 1.430e-8 1.551e-8 1.352e-8 AVG 1.111e-8 Detrended AVG 1.086e-8 Back Side Illuminated S Array Node 0 Node 1 Node 2 Node 3 CCD5 5.288e-9 6.276e-9 5.979e-9 3.077e-9 AVG: 4.876e-9 CCD7 3.136e-9 4.588e-9 4.586e-9 3.044e-9 AVG 3.873e-9
- Focal Plane Temperature
       The Mean (max) FPT: -114.99      std dev: 2.47
               mean width:    0.69      std dev: 0.22
DOY Focal Temp S.D. 60.70 -110.33 1.15 63.32 -114.54 0.33 65.05 -118.90 0.74 65.98 -113.08 0.37 67.75 -119.06 0.20 68.58 -114.86 0.54 71.20 -116.96 0.50 73.91 -114.54 0.36 76.60 -110.17 0.40 79.17 -113.41 0.44 81.46 -118.09 1.18 84.55 -109.85 0.42 87.15 -112.44 0.35
We are using 10 period moving averages to show trends of peak temperatures and peak widths. Note, the gaps in the width plot are due to missing/corrupted data.
- Bad Pixels
Many of the S1 and S3 "bad pixels" are not bad at all. The bias frames have a lot of real structure in them and since the hot pixel finder is comparing pixels to a global average across the CCD, the extremes of the bias structure are getting picked up. - Catherine GrantWarm pixels consistently showed a bias level more than 5 sigma away the chip's mean level during this period.
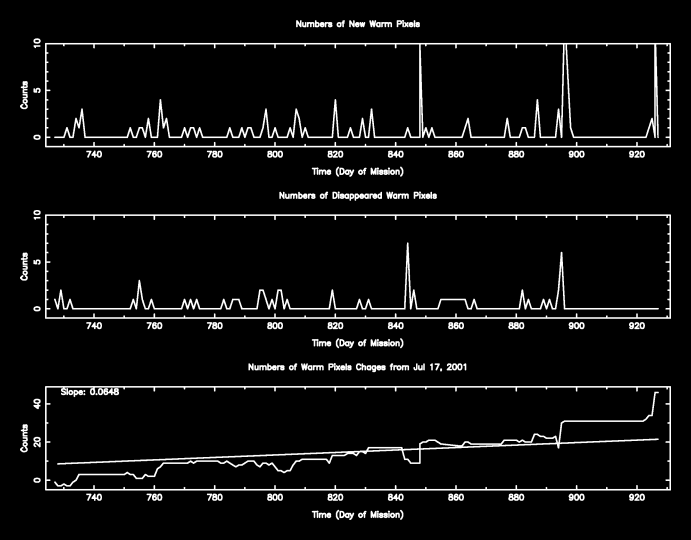
Hot Pixels - No new hot pixels observed this month.
Previously reported:
Pixel 1022,166 of Quad 4 CCD 5. We define a hot pixel as a pixel with the count rate 1000 counts above the average- Acis Count Rate Plot This monitors the ACIS count Rate vs. EPHIN count Rate.
No sources are removed. For daily updates see: Ephin/Acis Info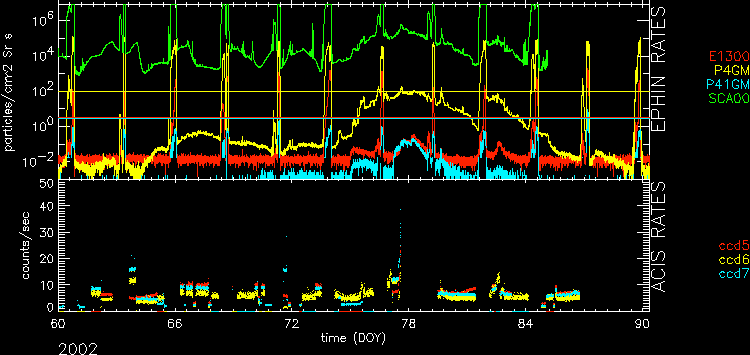
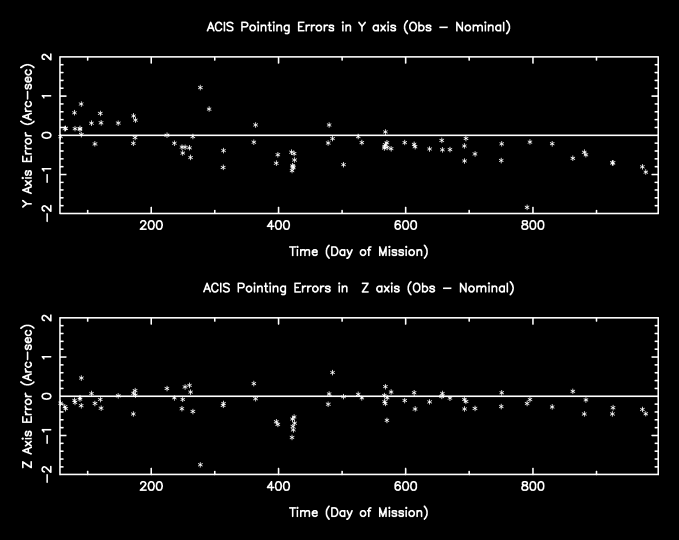
- ACIS-S Celestial Location Monitoring
The following plots are the difference between coordinates obtained from Chandra observations and those obtained from existing catalogs vs time in day of mission.
The following steps are taken to generate these plots
* all observations with grating are selected
* observed ra, dec, target ra, dec, nominal ra, dec and a ratio of a target elliptical to psf (psfratio) are extracted from src fits files.
* the observations with psfratio smaller than 4 are selected
* the differences between observed coordinates and targeted coordinates are computed
* if the differences are larger than 6 arcsec, the points are dropped
- Focal Plane Temperature
HRC
-
DOSE of central 4K pore-pairs
- MAR HRC-I dose fits image
        IMAGE                NPIX      MEAN    STDDEV      MIN       MAX
HRCI_03_2002.fits          16777216  0.01604   0.13264     0.0       10.0
- SEP 1999 - MAR 2002 HRC-I dose fits image
        IMAGE                NPIX      MEAN    STDDEV      MIN       MAX
HRCI_08_1999_03_2002.fits  16777216  1.34433   3.35718     0.0        464.0
- :MAR HRC-S dose fits image
        IMAGE                NPIX      MEAN    STDDEV      MIN       MAX
HRCS_03_2002.fits          16777216  0.01380   0.11819     0.0       4.0
- MAR 1999 - MAR 2002 HRC-S dose fits image
IMAGE NPIX MEAN STDDEV MIN MAX HRCS_08_1999_03_2002.fits 16777216 4.42157 10.77327 0.0 1819.0 - MAR HRC-I dose PNG image
- AUG 1999 - MAR 2002 HRC-I dose PNG image
- MAR HRC-S dose PNG image
- AUG 1999 - MAR 2002 HRC-S dose PNG image
See Maximum Dose Trends
From this month, we display a max dose trend plot corrected for events that "pile-up" in the center of the taps due to bad position information. Because of this correction, count rates are much lower than the previous month (see Feb plot).

DOSE is now calculated in RAW coordinates instead of DET.
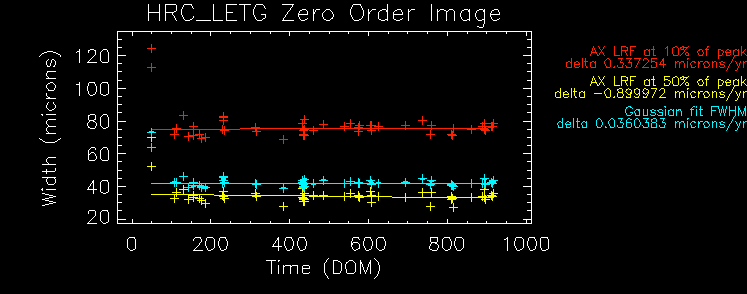
Gratings Focus
We plot the width of the zero order streak of ACIS/HETG observations and
the width of the zero order image for HRC/LETG observations of point sources.
No significant defocusing trend is seen at this time. See
Gratings Focus
pages.

PCAD
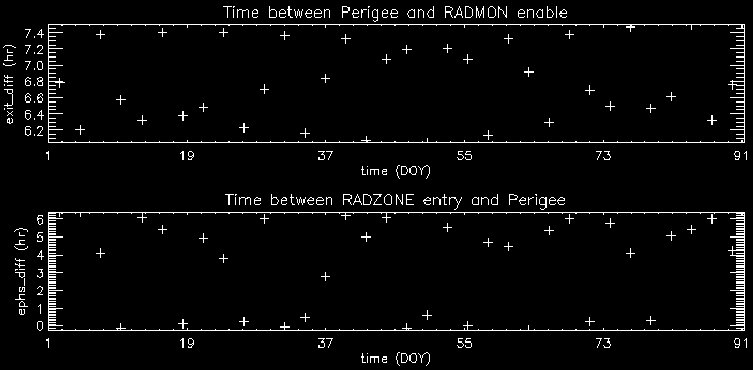
Radiation Zone Timing
Plotted below are radiation zone timing plots based on the following definitions of radiation zone:
RADZONE - Ephin levels (in any of the E1300,P4GM,P41GM channels) are more than 1/3 of RADMON safing thresholds.
RADMON - Radmon is disabled for radiation zone (as commanded based on OFLS model, for comparison with actual radiation levels).
PERIGEE - Time of closest earth approach (for comparison).
Mar 2002 Timing Plots Entire Mission Timing Plots
