From this month, we report CTIs with a refined data definition. CTIs were computed for the data
taken during the focal plane temperature < -119.7 C, and the integration time longer than 7,000 sec.
This eliminates a CTI temperature dependency, and the shows CTI degradation with time much more cleanly.
Please see
new CTI page
for detailed explanation.
CTI's are computed for Mn K alpha, and defined as slope/intercept x10^4 of row # vs ADU.
Data file here
CTI Slope (after DOM 200)
CTI slopes were computed for data point after DOM 200 and inside of 1 sigma deviation.
Using only data point in 1 sigma range, we drop high temperature observations, squeegy
observations, and other outliers. A independent variable is date, and a dependent
variable is CTI.
Front Side Illuminated S Array

	Node 0		Node 1		Node 2		Node 3

CCD4	9.294e-9        1.173e-8        1.200e-8        1.051e-8
CCD6	8.738e-9        9.279e-9        9.579e-9        8.752e-9
CCD8	7.762e-9        8.392e-9        7.921e-9        7.617e-9
CCD9	8.794e-9        1.042e-8        1.042e-8        7.344e-9

AVG	8.678e-9


Front Side Illuminated I Array

	Node 0		Node 1		Node 2		Node 3

CCD0	6.661e-9        8.405e-9        8.552e-9        7.080e-9
CCD1	7.041e-9        8.108e-9        7.959e-9        6.163e-9
CCD2	7.216e-9        8.369e-9        8.139e-9        6.571e-9
CCD3	6.690e-9        8.279e-9        8.141e-9        7.256e-9

AVG	7.049e-9

Back Side Illuminated S Array (not detrended)

	Node 0		Node 1		Node 2		Node 3

CCD5	3.269e-9       3.457e-9        3.490e-9        2.424e-9
AVG:	3.070e-9

CCD7	2.067e-9       2.944e-9        2.982e-9        2.012e-9
AVG	2.511e-9
Focal Plane Temperature
       The Mean (max) FPT: -115.14      std dev: 1.67
               mean width:    0.31 days std dev: 0.09
We are using 10 period moving averages to show
trends of peak temperatures and peak widths.
Note, the gaps in the width plot are due to missing/corrupted data.
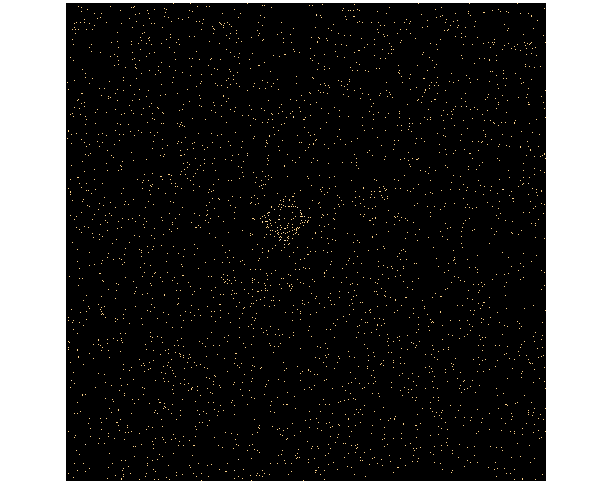
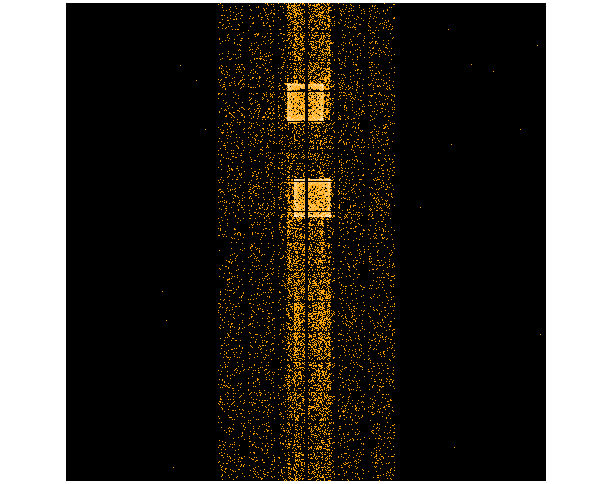
Bad Pixels
The plots below were generated with a new warm pixel finding script. Please see
Acis Bad Pixel Page
for details.
Front Side CCDs
Back Side CCD (CCD5)
Acis Count Rate Plot
This monitors the ACIS count Rate vs. EPHIN count Rate.
No sources are removed. For daily updates see:
Ephin/Acis Info
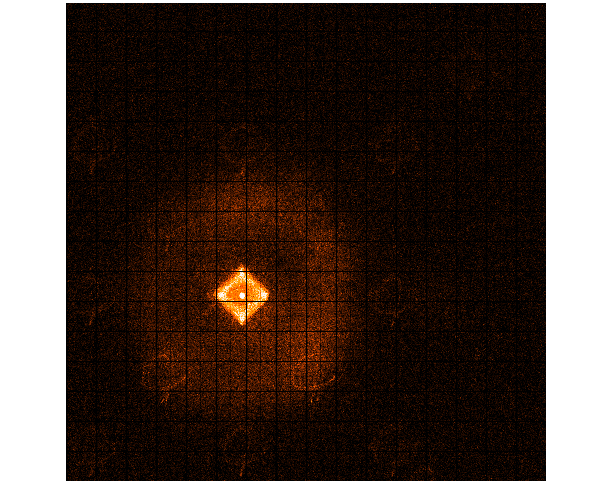
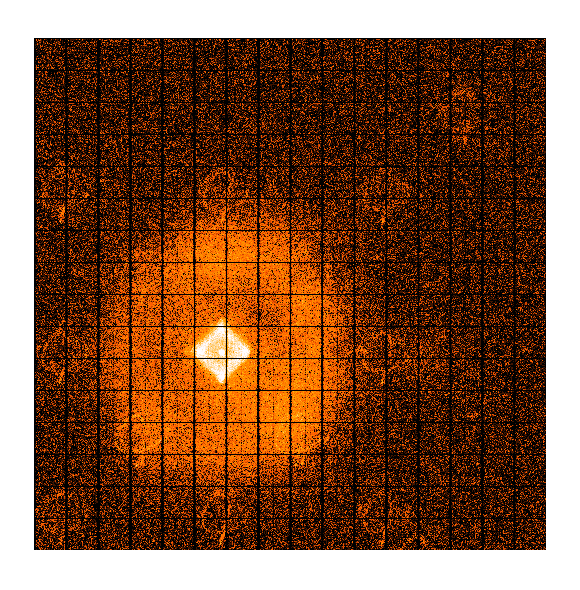
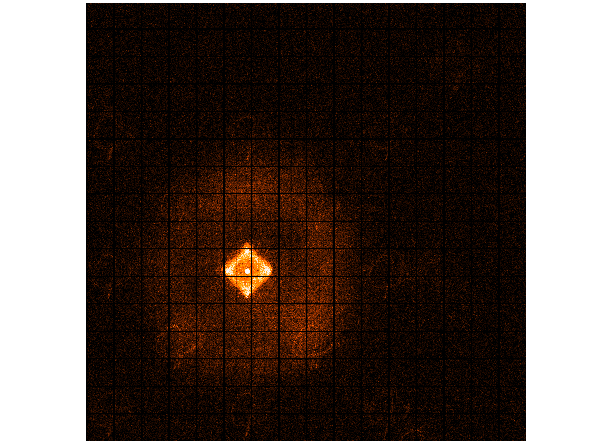
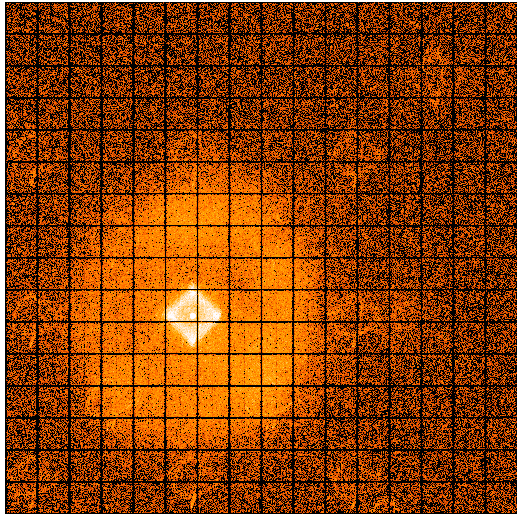
ACIS Corner Pixels
We plot the average corner pixel centroid slope and mean for ACIS observations. Separate
plots are shown for FAINT MODE (3X3) and VFAINT MODE (5X5) observations.
Metric is the centroid of a gaussian fit to the histogram of corner pixel PHA values
of detected events.
Plus signs are FAINT observations, diamonds are VFAINT observations,
and boxes are VFAINT observations with centroids computed using
only the corner pixels of a 3X3 event island (referred to as AFAINT).
We see a very small upward trend.
I3
S3
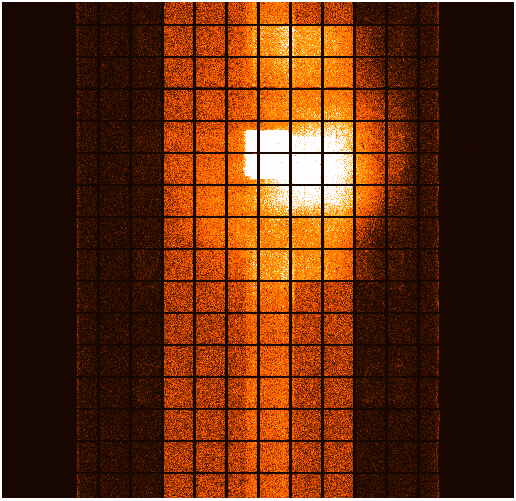
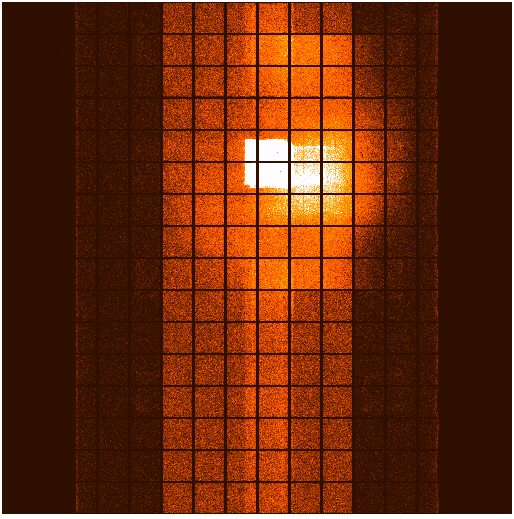
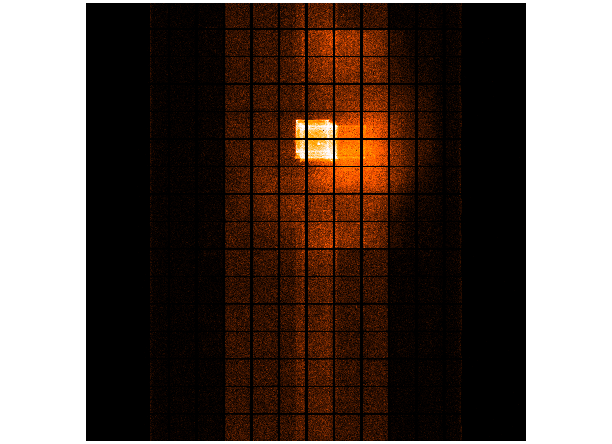
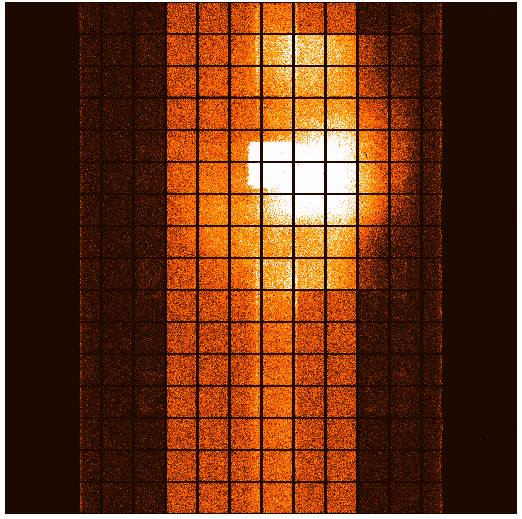
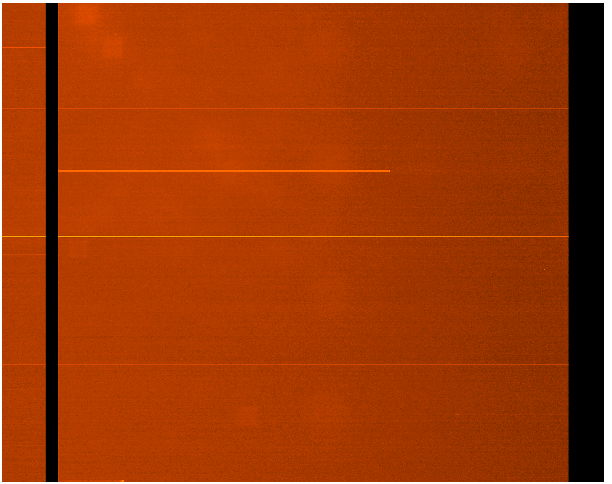
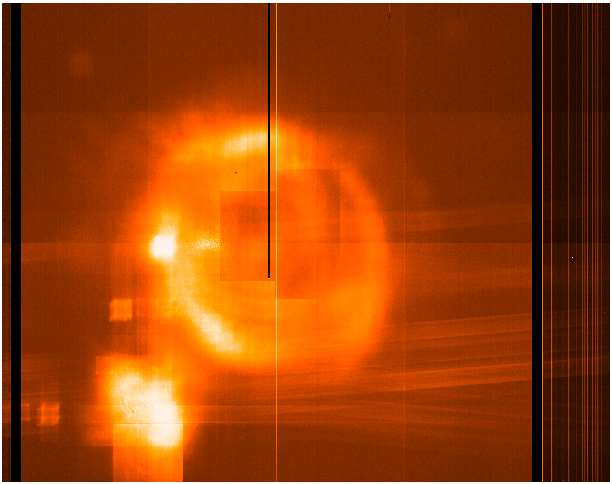
ACIS Bias Trends
The bias plus overclock level was calculated as follows:
- Get acisf*bias0.fits is obtained from a database or /dsops/ap/sdp/cache/*/acis/
- Data with timed mode exposure is selected.
- Fits files were divided into 4 quads, then an average of bias level for each quad is computed.
No corrections for dead spots, columns etc were included.
CCDS 0,
2 and
8 are the most
extreme.
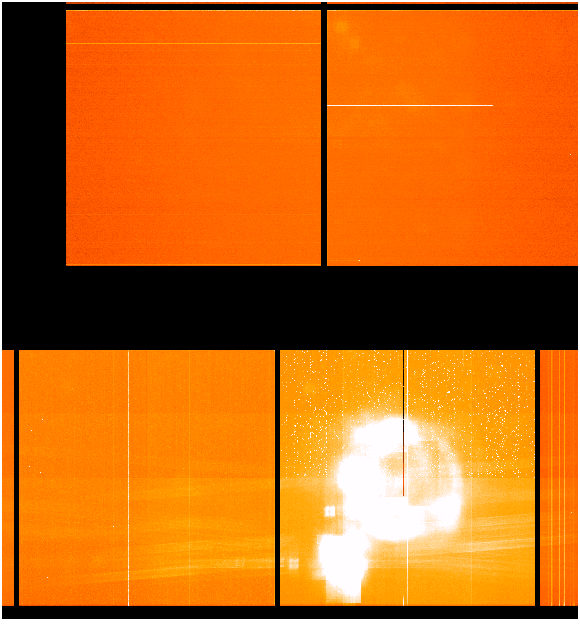
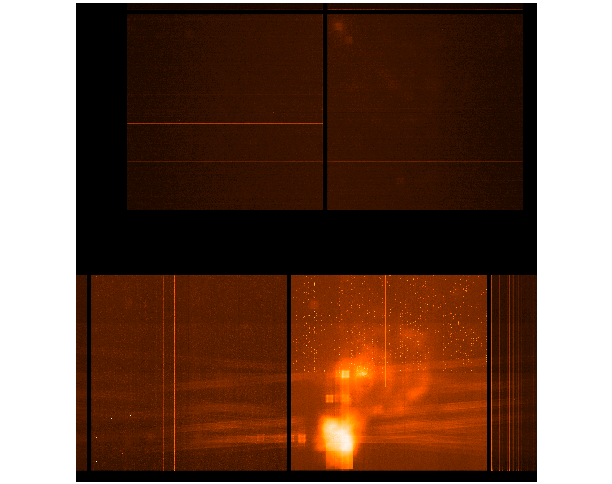
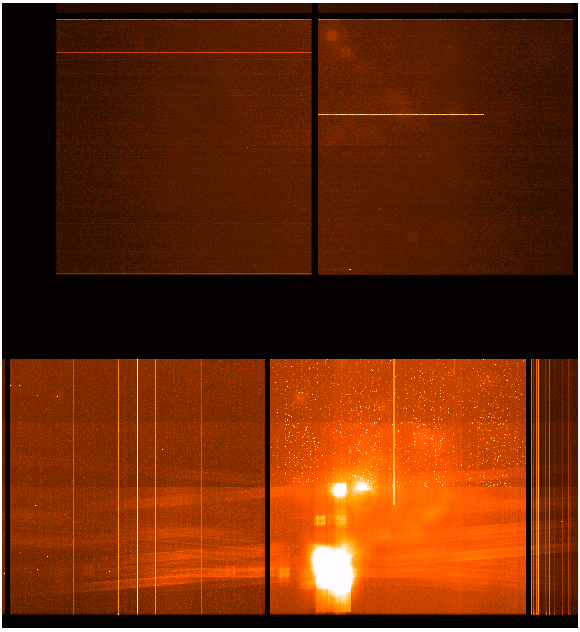
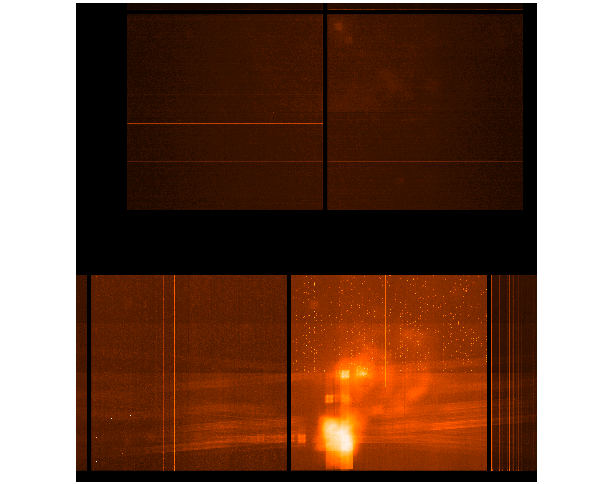
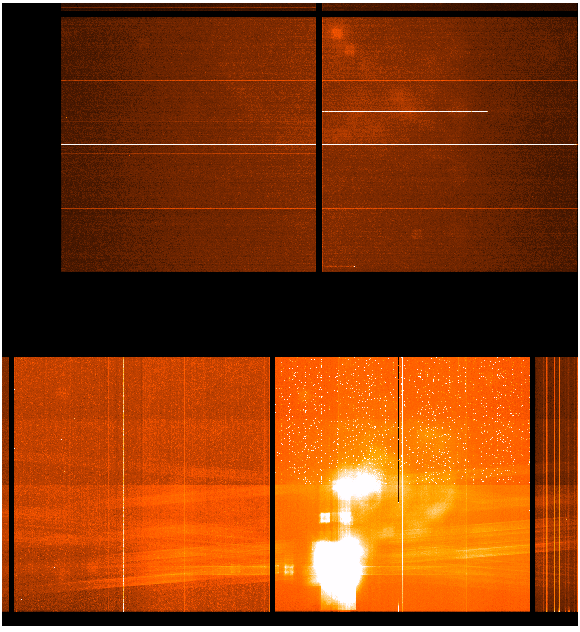
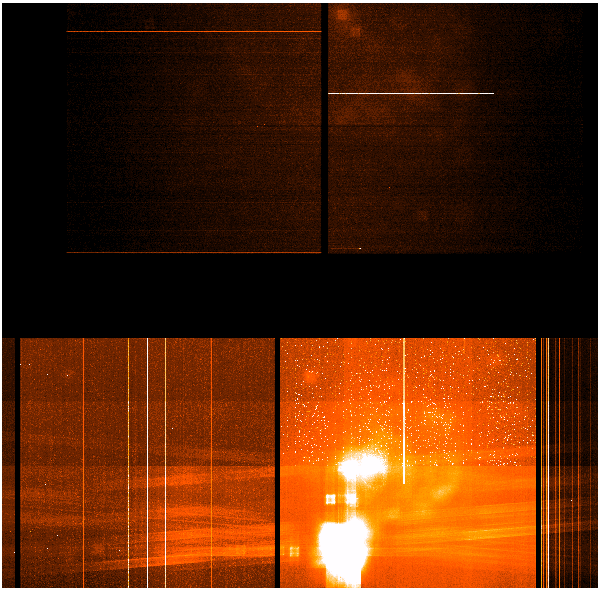
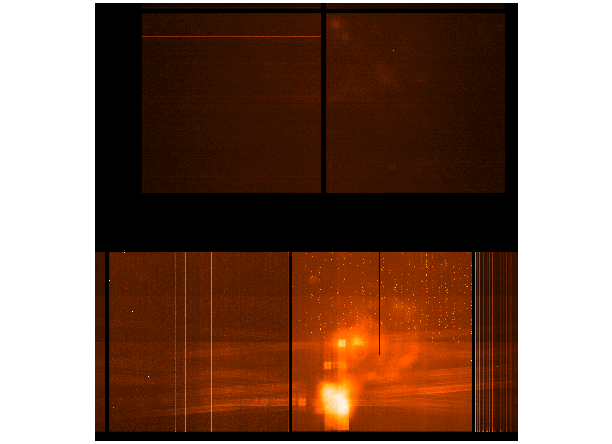
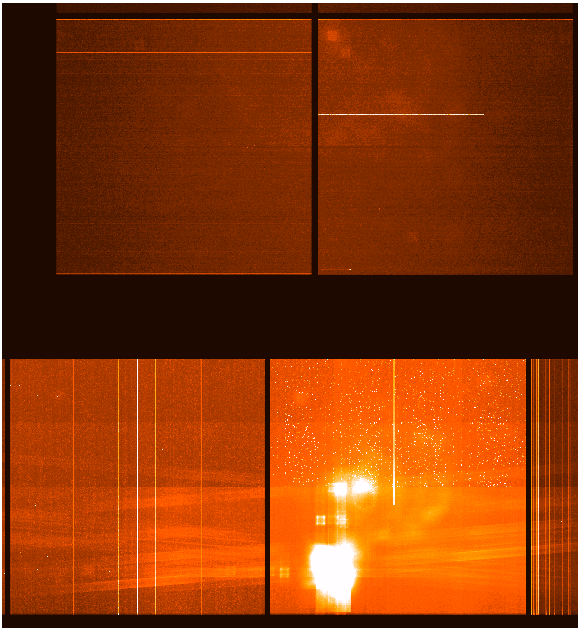
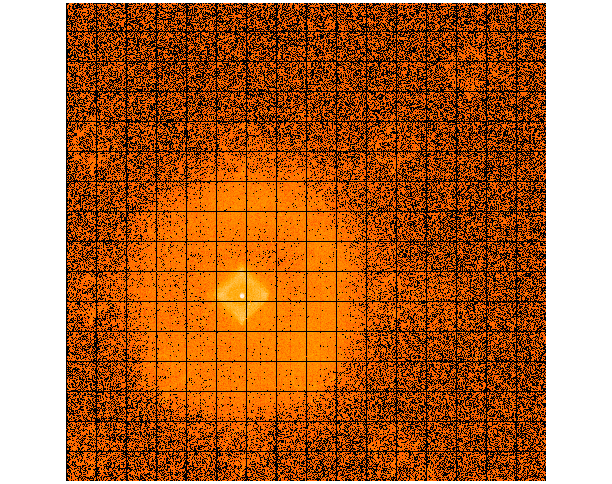
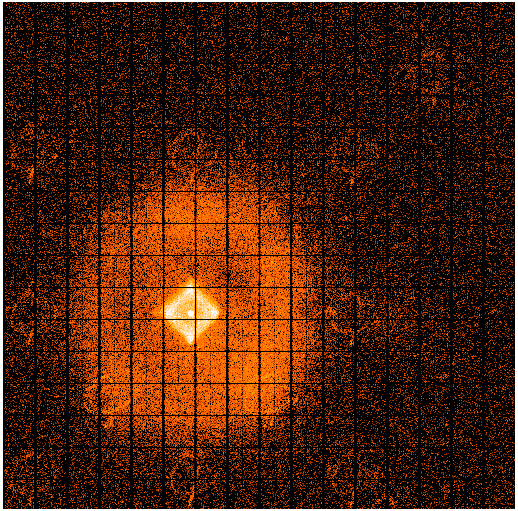
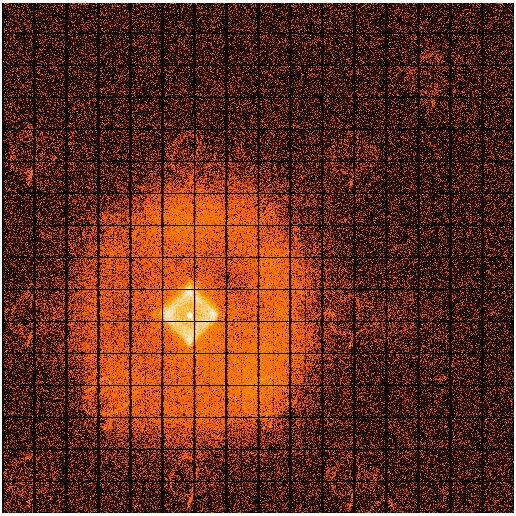
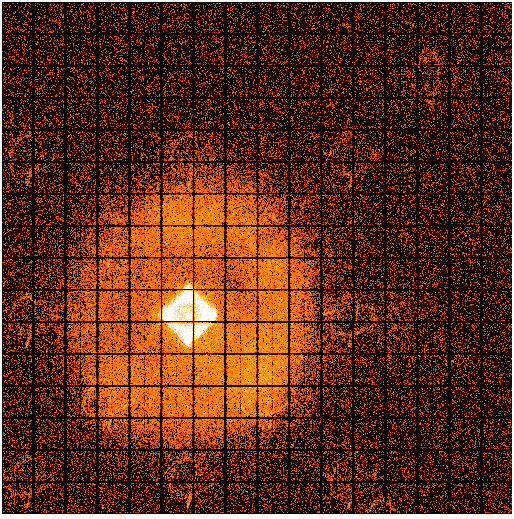
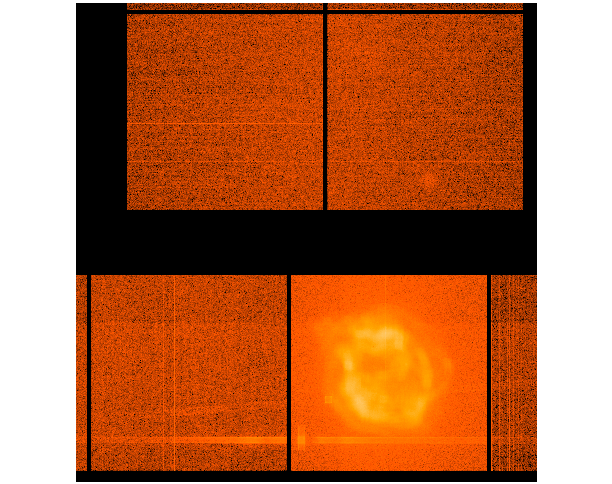
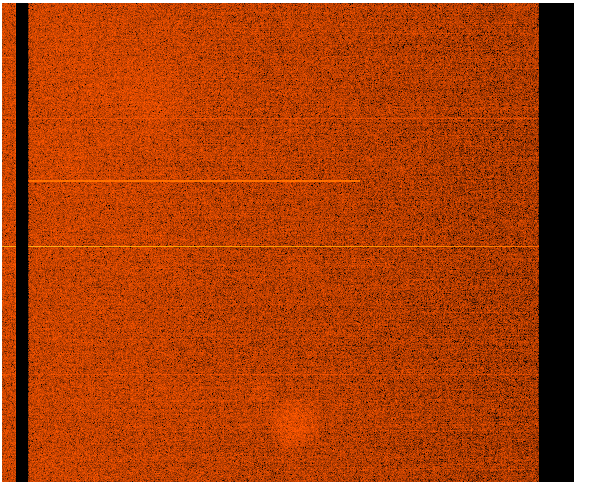
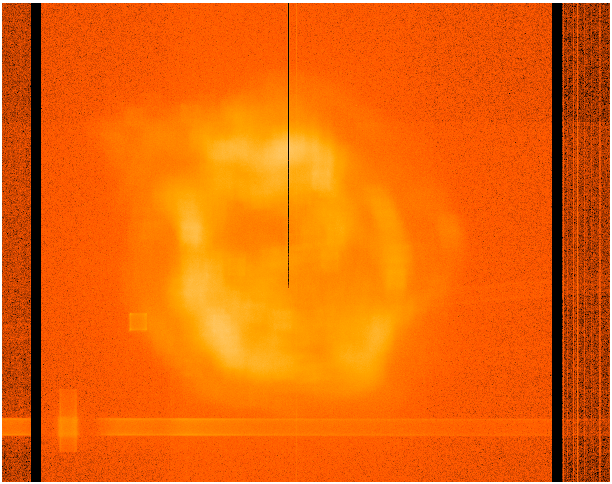
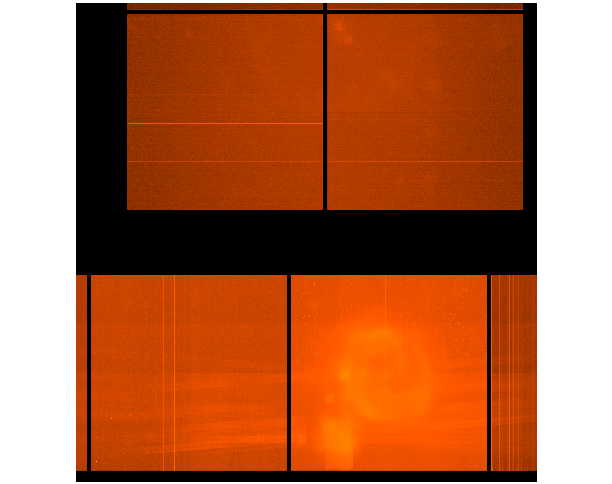
An example of Overclock values as reported in FITS file header:
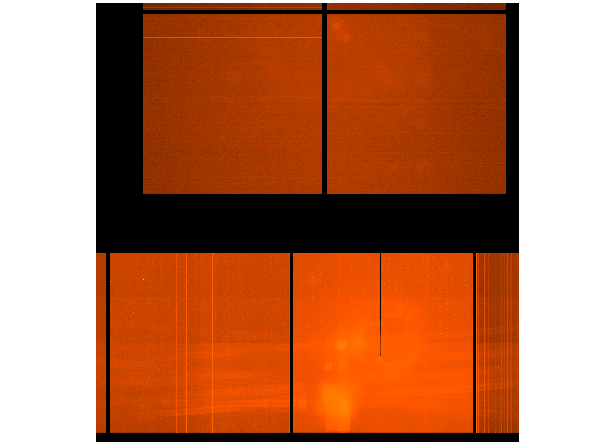
 An example of mean bias minus overclock value:
 TOP
TOP


)
)
)
)