From this month, we report CTIs with a refined data definition. CTIs were computed for the temperature
dependency corrected data.
Please see
new CTI page
for detailed explanation.
CTI's are computed for Mn K alpha, and defined as slope/intercept x10^4 of row # vs ADU.
Data file here
CTI Slope (after DOM 200)
CTI slopes were computed for data point after DOM 200 and inside of 1 sigma deviation.
Using only data point in 1 sigma range.
A independent variable is date, and a dependent variable is CTI.
Front Side Illuminated S Array

	Node 0		Node 1		Node 2		Node 3

CCD4	9.188e-9        1.162e-8        1.182e-8        1.033e-8
CCD6	8.491e-9        8.959e-9        9.250e-9        8.543e-9
CCD8	7.705e-9        8.278e-9        7.878e-9        7.549e-9
CCD9	8.671e-9        1.029e-8        1.028e-8        7.308e-9

AVG	8.602e-9


Front Side Illuminated I Array

	Node 0		Node 1		Node 2		Node 3

CCD0	6.459e-9        8.243e-9        8.352e-9        6.872e-9
CCD1	6.897e-9        7.887e-9        7.685e-9        5.965e-9
CCD2	6.966e-9        8.147e-9        7.879e-9        6.450e-9
CCD3	6.516e-9        8.027e-9        7.881e-9        6.988e-9

AVG	6.835e-9

Back Side Illuminated S Array (not detrended)

	Node 0		Node 1		Node 2		Node 3

CCD5	3.203e-9       3.455e-9        3.458e-9        2.412e-9
AVG:	3.051e-9

CCD7	2.082e-9       2.897e-9        2.933e-9        1.980e-9
AVG	2.483e-9
Focal Plane Temperature
       The Mean (max) FPT: -117.78      std dev: 1.35
               mean width:    0.41 days std dev: 0.19
We are using 10 period moving averages to show
trends of peak temperatures and peak widths.
Note, the gaps in the width plot are due to missing/corrupted data.
Bad Pixels
The plots below were generated with a new warm pixel finding script. Please see
Acis Bad Pixel Page
for details.
Front Side CCDs
Back Side CCD (CCD5)
Acis Count Rate Plot
This monitors the ACIS count Rate vs. EPHIN count Rate.
No sources are removed. For daily updates see:
Ephin/Acis Info
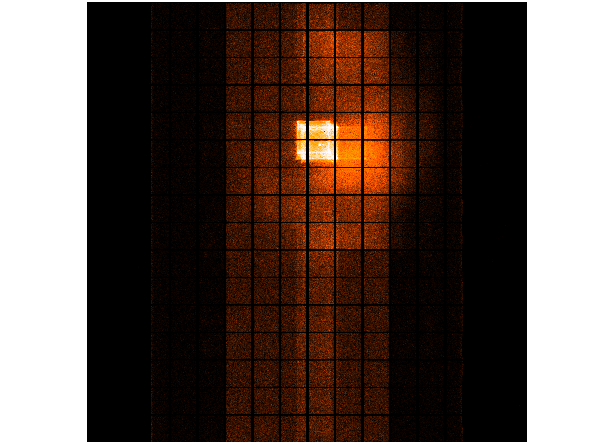
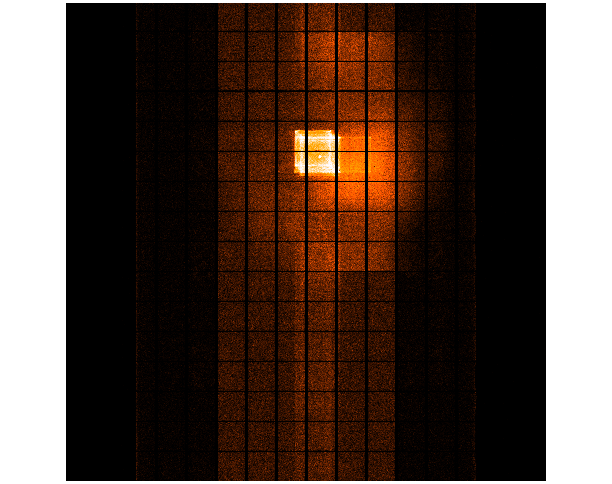
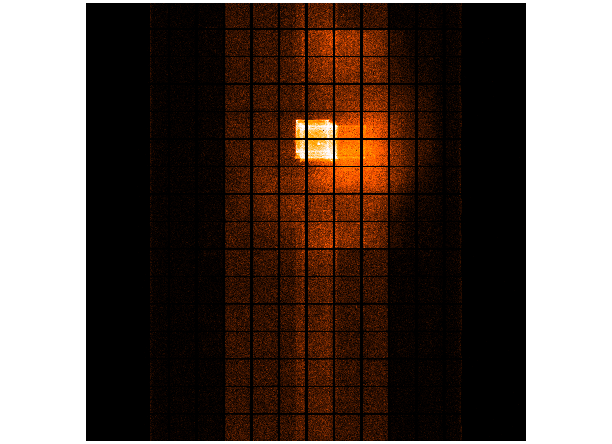
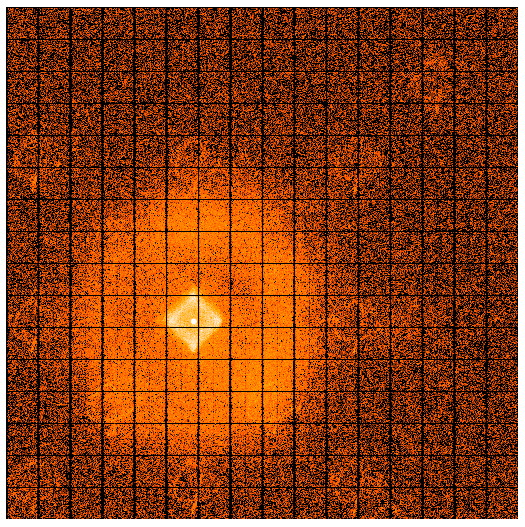
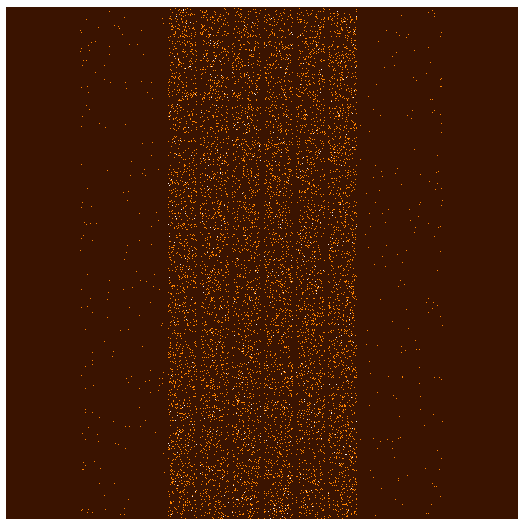
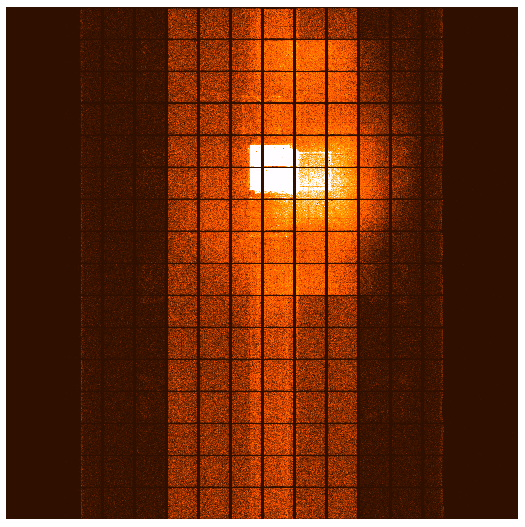
Science instrument background rates
This page shows scientific instrument background data based on Acis
observations. A source region file is generated using get_srcregions
and then the input event file is filtered using the regions in that file
to remove the sources.
ACIS Rejected Events
The links below are plots of stat1 quantities, showing on-board rejected
events. The average EVTSENT,
DROP_AMP, DROP_POS, DROP_GRD, THR_PIX, and maximum BERR_SUM obtained from
L1 acis*stat1.fits files are plotted
for each observation. CTI observations are plotted separately from regular
science observations.
Column definitions:
- EVTSENT - number of events sent in data record
- DROP_AMP - number of discarded events due to corrected amplitude
- DROP_POS - number of discarded events due to CCD position
- DROP_GRD - number of discarded events due to grade code
- THR_PIX - number of pixels above respective threshold level
- BERR_SUM - number of pixel bias errors so far in science run
Note the half-life decay of the CTI source is clearly evidenced in the steady
decline of EVTSENT.
CCD7 CTI Observations
CCD7 Science Observations


)
)
)
)
)
)
)
)
)
)
)
)
)
)