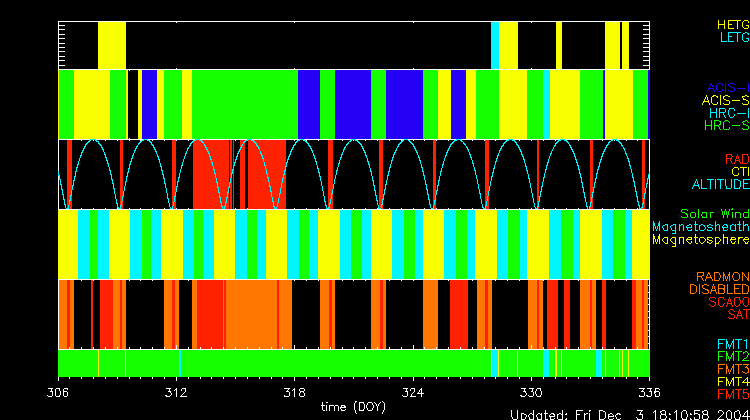

Statistics:
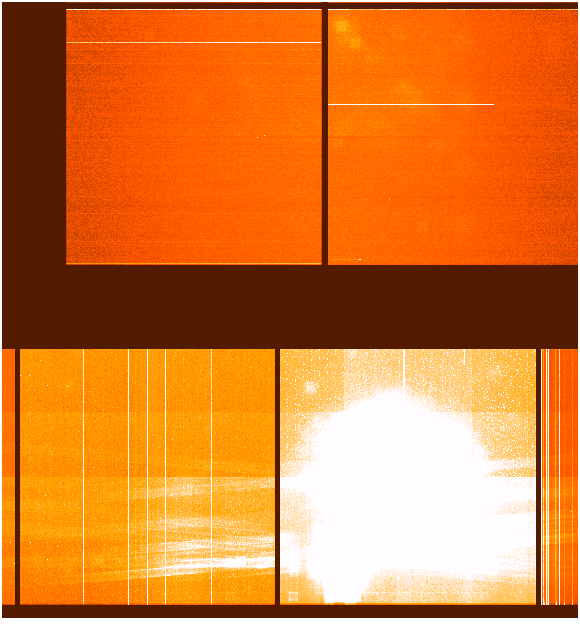
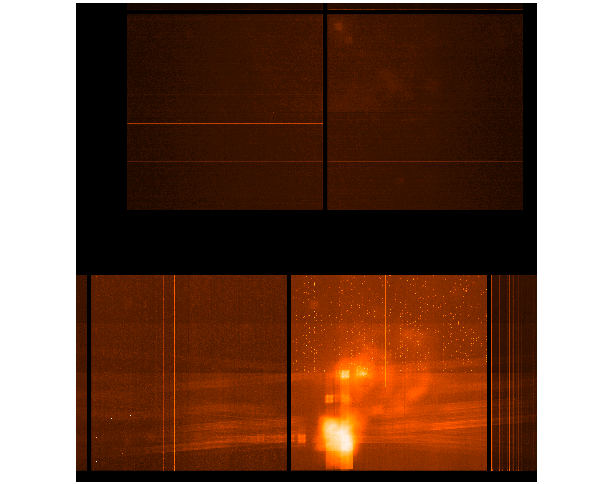
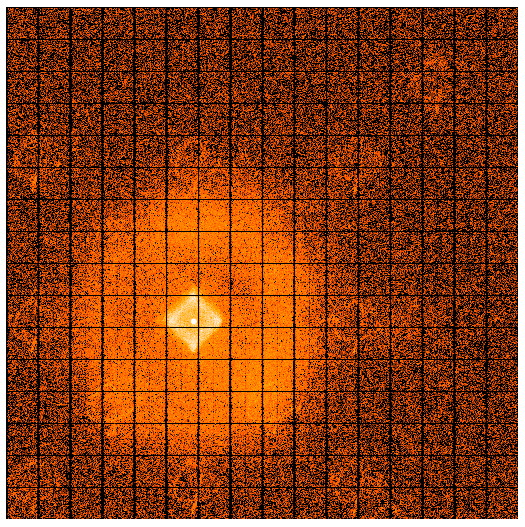
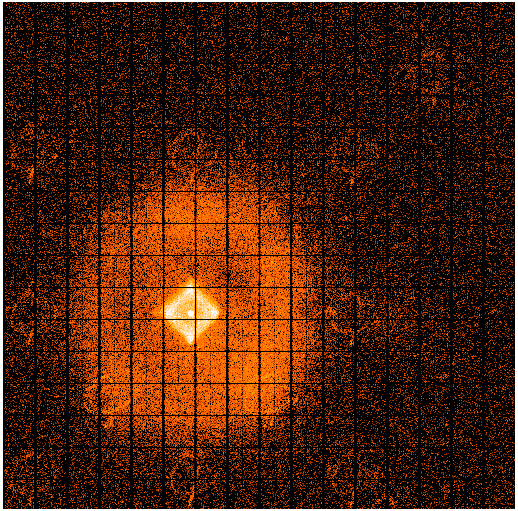
# IMAGE     NPIX      MEAN           RMS               MIN   MAX
ACIS_nov04 6004901    26.07         55.21              0.0   33001.0

 I2 node 0  262654  7.990942        5.959731           0.0   219.0
 I2 node 1  262654  9.320513        10.991806          0.0   368.0
 I2 node 2  262654  10.640961       16.623592          0.0   700.0
 I2 node 3  262654  11.703682       22.263229          0.0   668.0

 I3 node 0  262654  11.586540       21.348214          0.0   613.0
 I3 node 1  262654  10.452066       16.063287          0.0   475.0
 I3 node 2  262654  9.023678        10.708131          0.0   355.0
 I3 node 3  262654  7.492020        5.420140           0.0   201.0

 S2 node 0  262397  12.153714       4.017297           0.0    57.0
 S2 node 1  262397  14.881809       33.140628          0.0   699.0
 S2 node 2  262397  12.721361       4.281404           0.0    80.0
 S2 node 3  262397  12.402013       4.548852           0.0   390.0

 S3 node 0  262397  12.028720       4.290004           0.0    86.0
 S3 node 1  262397  12.967987       4.849701           0.0   105.0
 S3 node 2  262397  12.511565       3.677415           1.0    34.0
 S3 node 3  262397  11.674105       3.783601           0.0    56.0
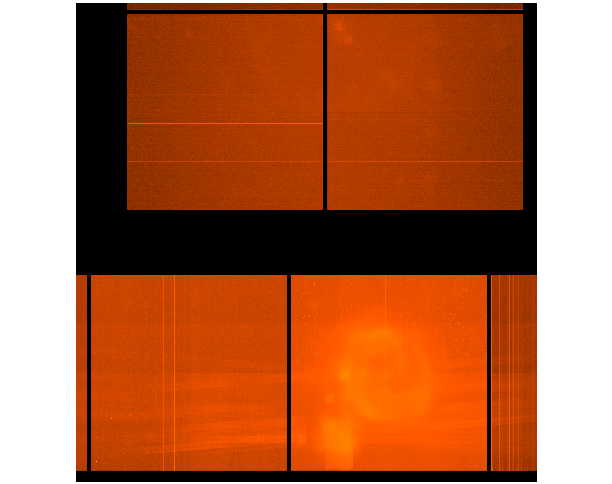
Statistics:
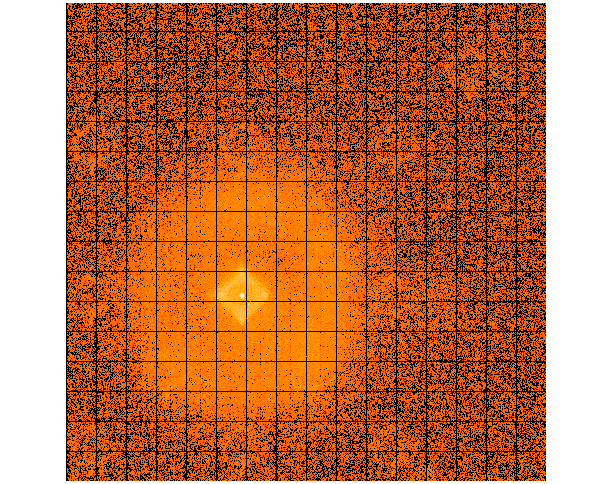
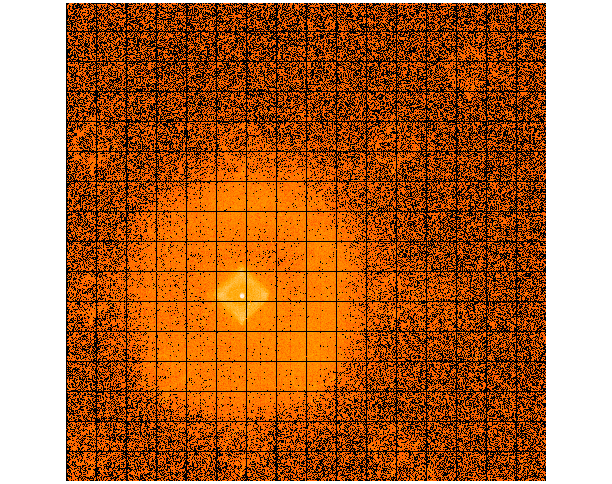
 IMAGE        NPIX      MEAN          RMS              MIN    MAX
 ACIS_total 6004901   565.876        978.463           0.0  758901.0

 I2 node 0  262654  336.814094      255.012707        78.0  9967.0
 I2 node 1  262654  404.199418      538.163857       238.0  17352.0
 I2 node 2  262654  467.802394      832.199109       285.0  24249.0
 I2 node 3  262654  511.804865      1104.239407        0.0  29625.0

 I3 node 0  262654  550.344773      1110.441669      261.0  29497.0
 I3 node 1  262654  502.276424      830.670723       310.0  23404.0
 I3 node 2  262654  419.100927      537.350905       121.0  16881.0
 I3 node 3  262654  334.215748      237.561815         0.0  9390.0

 S2 node 0  262397  631.191386      345.836709       288.0  51741.0
 S2 node 1  262397  811.268669      1926.279176      287.0  36496.0
 S2 node 2  262397  753.491911      350.228306       385.0  158627.0
 S2 node 3  262397  730.801804      156.237457         0.0  2251.0

 S3 node 0  262397  1323.983628     787.690703       415.0  6335.0
 S3 node 1  262397  2209.223551     1205.413494        0.0  72831.0
 S3 node 2  262397  1482.723282     559.167037       396.0  28897.0
 S3 node 3  262397  1022.563131     235.292245         0.0  5897.0
|
|
|
|
| Aug 2004 | May 2004 | Feb 2004 | Nov 2003 |
|---|
From this month, we report CTIs with a refined data definition. CTIs were computed for the temperature dependency corrected data. Please see new CTI page for detailed explanation. CTI's are computed for Mn K alpha, and defined as slope/intercept x10^4 of row # vs ADU. Data file here
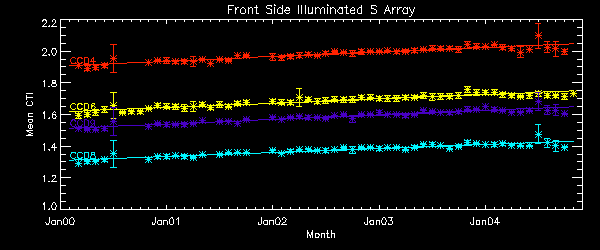
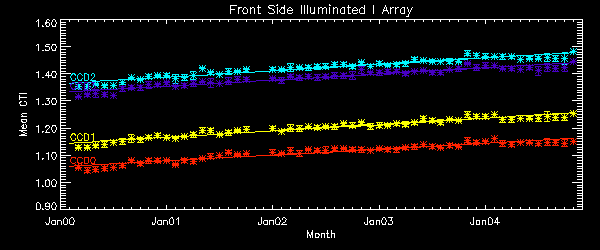

CTI slopes were computed for data point after DOM 200 and inside of 1 sigma deviation. Using only data point in 1 sigma range. A independent variable is date, and a dependent variable is CTI.
Front Side Illuminated S Array

	Node 0		Node 1		Node 2		Node 3

CCD4	8.964e-9        1.131e-8        1.158e-8        1.007e-8
CCD6	8.088e-9        8.671e-9        8.836e-9        8.158e-9
CCD8	7.513e-9        8.045e-9        7.724e-9        7.435e-9
CCD9	8.508e-9        1.010e-8        9.962e-9        7.152e-9

AVG	8.355e-9


Front Side Illuminated I Array

	Node 0		Node 1		Node 2		Node 3

CCD0	6.186e-9        7.915e-9        8.095e-9        6.645e-9
CCD1	6.603e-9        7.584e-9        7.327e-9        5.788e-9
CCD2	6.671e-9        7.843e-9        7.426e-9        6.125e-9
CCD3	6.211e-9        7.706e-9        7.556e-9        6.670e-9

AVG	6.525e-9

Back Side Illuminated S Array (not detrended)

	Node 0		Node 1		Node 2		Node 3

CCD5	3.163e-9       3.401e-9        3.450e-9        2.373e-9
AVG:	2.993e-9

CCD7	2.038e-9       2.917e-9        2.914e-9        1.973e-9
AVG	2.473e-9
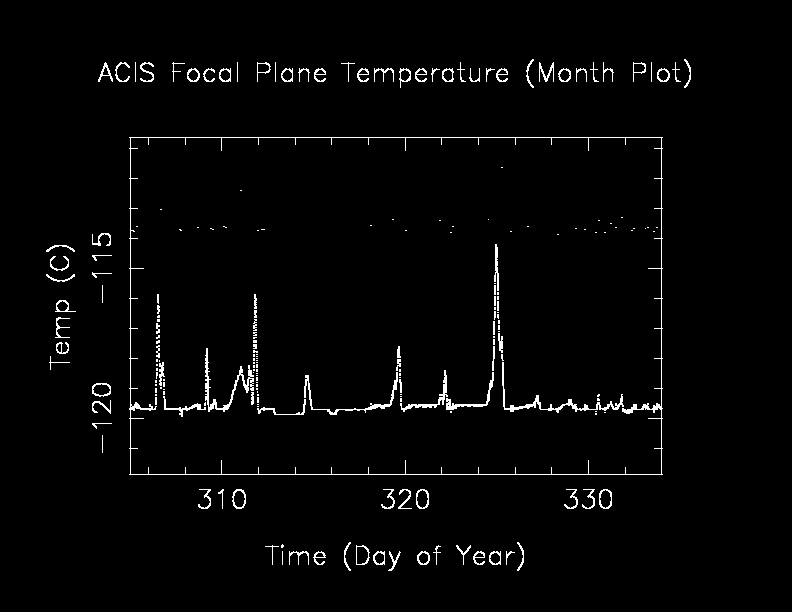
       The Mean (max) FPT: -117.45      std dev: 1.36
               mean width:    0.45 days std dev: 0.26

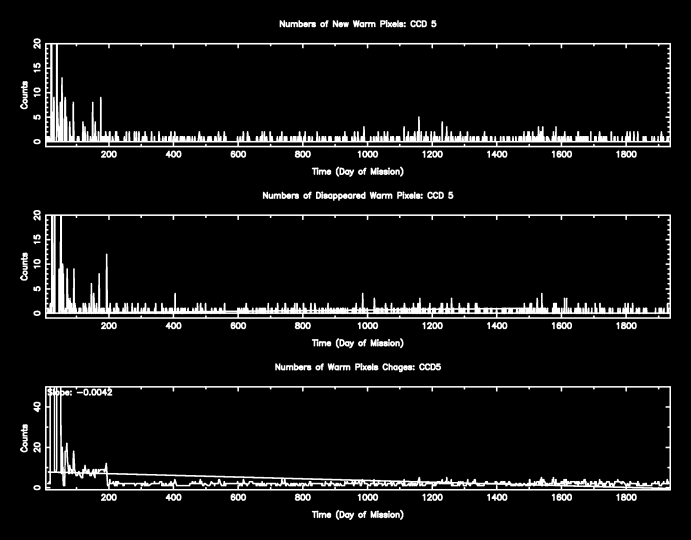
The plots below were generated with a new warm pixel finding script. Please see Acis Bad Pixel Page for details.
Front Side CCDs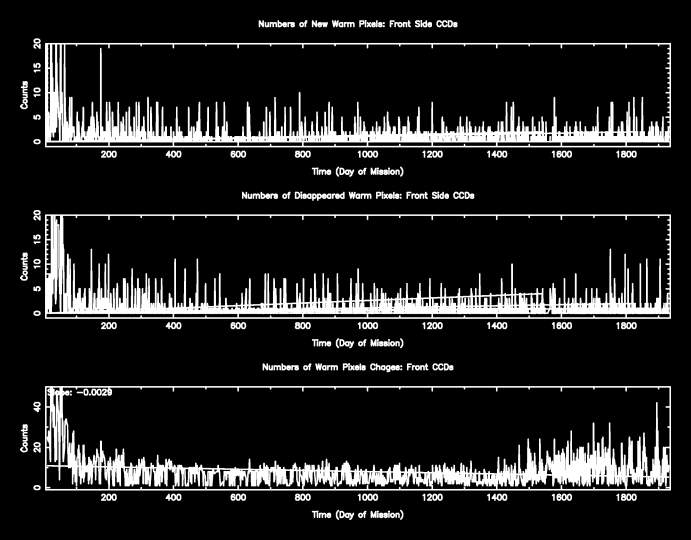
Back Side CCD (CCD5)
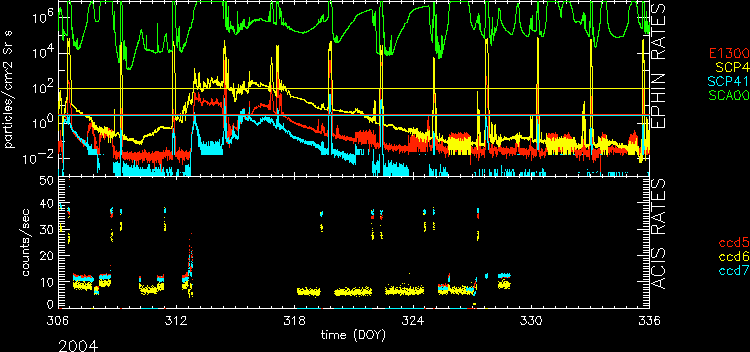
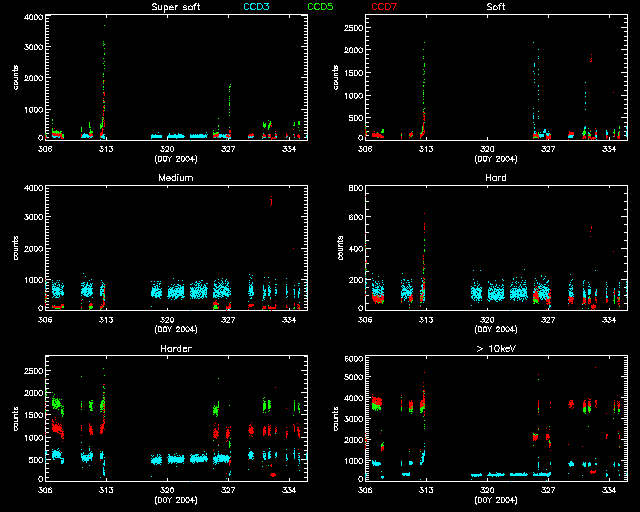
| Name | Low (keV) | Hight(KeV) | Description |
|---|---|---|---|
| SSoft | 0.00 | 0.50 | Super soft photons |
| Soft | 0.50 | 1.00 | Soft photons |
| Med | 1.00 | 3.00 | Moderate energy photons |
| Hard | 3.00 | 5.00 | Hard Photons |
| Harder | 5.00 | 10.00 | Very Hard photons |
| Hardest | 10.00 | Beyond 10 keV |
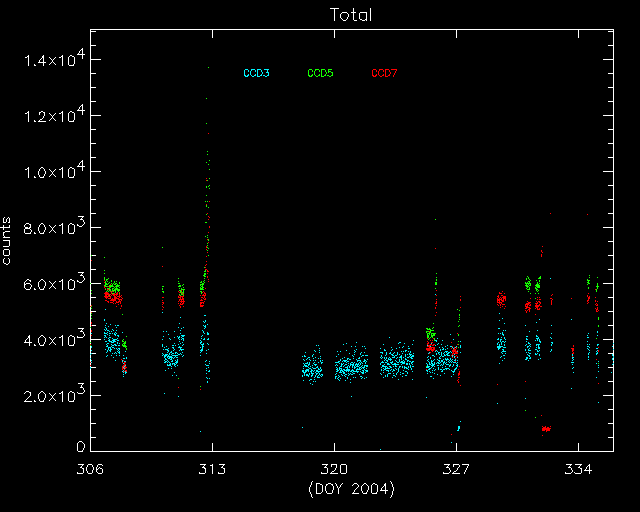
The following three plots show trends of SIB for the past one year. CCDs shown here are CCD3, CCD5, and CCD7. Fitted lines are linear fit after eliminating extreme out layers. For >10 keV plots, 2 lines are fitted. One is with a 13 keV filter, and another without.
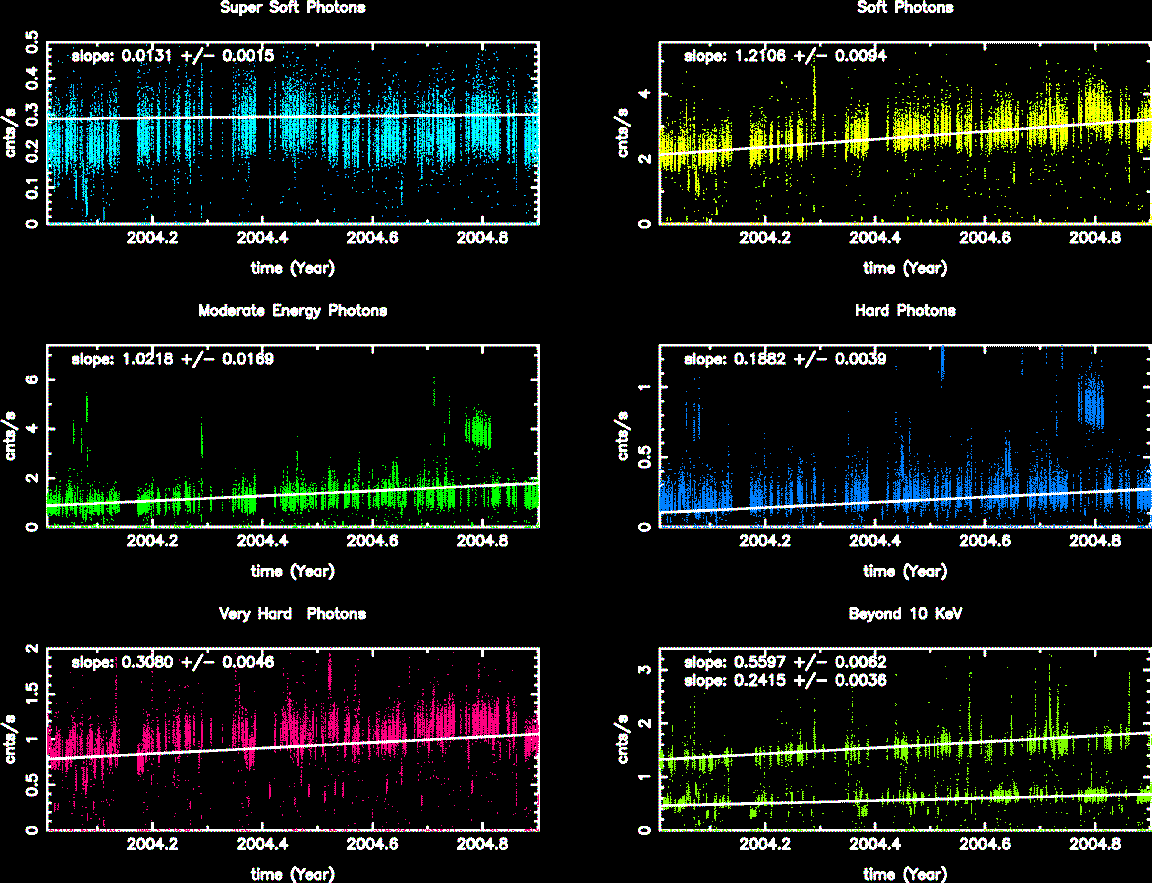

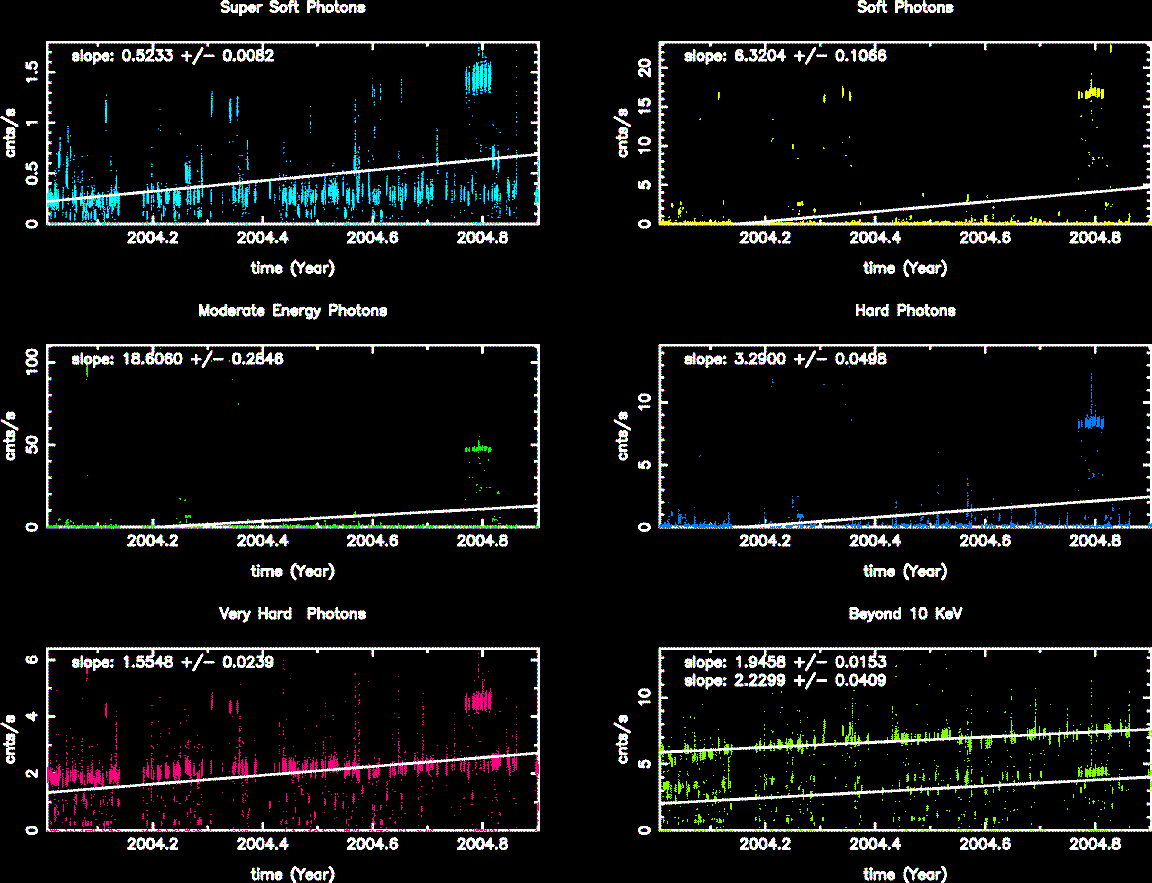

        IMAGE                NPIX      MEAN    STDDEV      MIN       MAX
HRCI_11_2004.fits          16777216  0.01650   0.135366    0.0       10.0
        IMAGE                NPIX      MEAN    STDDEV      MIN       MAX
HRCI_08_1999_11_2004.fits  16777216  1.74298   3.722996    0.0       467.0
        IMAGE                NPIX      MEAN    STDDEV      MIN       MAX
HRCS_11_2004.fits          16777216  0.051050  0.239417    0.0       10.0
No HRC-S observations.
        IMAGE                NPIX      MEAN     STDDEV      MIN      MAX
HRCS_08_1999_11_2004.fits  16777216  5.92215   14.03705     0.0      1850.0
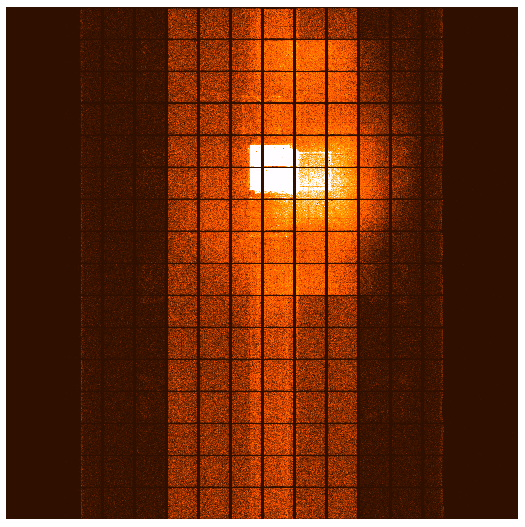
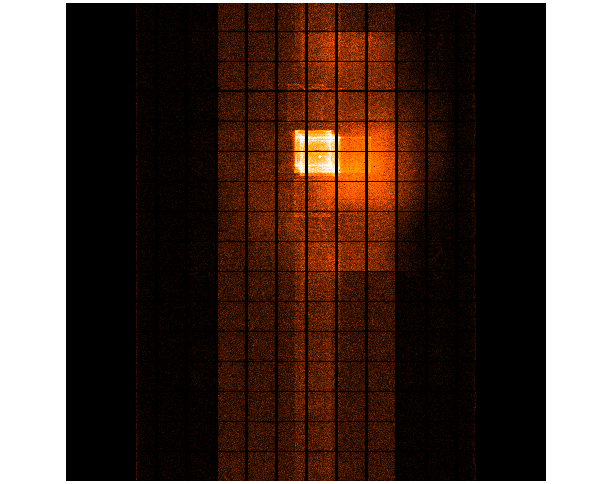
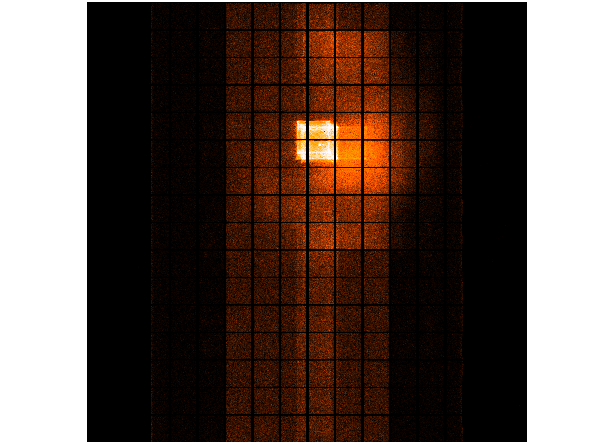
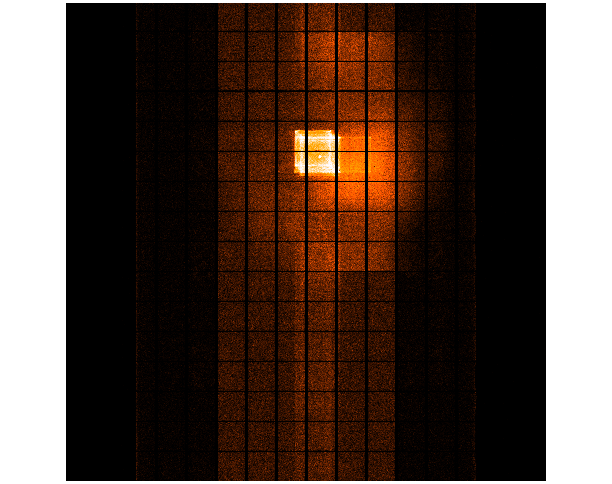
We display a max dose trend plot corrected for events that "pile-up" in the center of the taps due to bad position information.

|
|
|
|
| Aug 2004 | May 2004 | Feb 2004 | Nov 2003 |
|---|
|
|
|
|
| Aug 2004 | May 2004 | Feb 2004 | Nov 2003 |
|---|
| Previous Quarter | ||||||
| MSID | MEAN | RMS | DELTA/YR | DELTA/YR/YR | UNITS | DESCRIPTION |
| 1DACTBT | 2.580e+02 | 1.742e+00 | -3.025e+00 | -3.254e+02 | K | DA COLLIMATOR TEMP. B |
| 1DEAMZT | 2.822e+02 | 1.564e+00 | 2.255e+00 | 1.374e+02 | K | DEA -Z PANEL TEMP |
| 1OAHAT | 2.444e+02 | 1.155e+00 | -4.509e-01 | -1.673e+02 | K | OPEN ACTUATOR HOUSING TEMP. A |
| 1PDEAAT | 3.067e+02 | 7.862e+00 | -2.057e+01 | -1.484e+03 | K | PSMC DEA PS A TEMP |
| Previous Quarter | ||||||
| MSID | MEAN | RMS | DELTA/YR | DELTA/YR/YR | UNITS | DESCRIPTION |
| 5EIOT | 3.334e+02 | 1.604e+01 | -3.026e+01 | 1.349e+03 | K | EIO TEMP |
| 5EPHINT | 3.014e+02 | 8.046e+00 | -1.988e+00 | 9.216e+02 | TEMP | EPHIN |
| HKEBOXTEMP | 3.063e+02 | 8.037e+00 | -3.262e+00 | 9.303e+02 | K | EHPIN HOUSEKEEPING EBOX: TEMPERATURE (5EHSE300) |
| Gradients HRMA CAP Previous Quarter | ||||||
| MSID | MEAN | RMS | DELTA/YR | DELTA/YR/YR | UNITS | DESCRIPTION |
| HCAPGRD1 | 9.478e-02 | 5.023e-03 | 3.486e-03 | -2.647e-01 | K | RT100-RT101: HRMA CAP circum |
| HCAPGRD2 | 5.367e-02 | 4.846e-03 | 3.617e-03 | -6.729e-01 | K | RT100-RT104: HRMA CAP ridial |
| Gradients HRMA Struts | ||||||
| MSID | MEAN | RMS | DELTA/YR | DELTA/YR/YR | UNITS | DESCRIPTION |
| HSTRTGRD1 | -2.451e+00 | 6.276e-02 | -4.885e-02 | 1.138e-03 | K | RT25-RT26: HRMA STRUTS |
| HSTRTGRD2 | -1.542e+00 | 1.475e-01 | -3.733e-02 | 2.874e-02 | K | RT26-RT27: HRMA STRUTS |
| HSTRTGRD3 | -3.205e-01 | 7.845e-02 | -2.376e-02 | 1.534e-03 | K | RT27-RT28: HRMA STRUTS |
| HSTRTGRD4 | 1.267e+00 | 2.525e-01 | 1.918e-02 | -1.101e-01 | K | RT28-RT29: HRMA STRUTS |
| HSTRTGRD5 | 2.172e+00 | 5.487e-01 | 4.330e-01 | 1.198e-03 | K | RT29-RT30: HRMA STRUTS |
| HSTRTGRD6 | 1.028e+00 | 3.406e-01 | -1.303e-01 | 5.507e-03 | K | RT30-RT25: HRMA STRUTS |
| Gradients TFTE Previous Quarter | ||||||
| MSID | MEAN | RMS | DELTA/YR | DELTA/YR/YR | UNITS | DESCRIPTION |
| HTFTEGRD1 | 1.560e-01 | 8.356e-03 | -2.970e-02 | 2.657e-01 | K | RT58-RT59: TFTE Forward Cylinder |
| HTFTEGRD10 | 2.372e+00 | 3.237e-01 | -1.581e-01 | 2.575e+01 | K | RT67-RT68: TFTE Cover |
| HTFTEGRD11 | 2.341e+01 | 1.232e+00 | -1.536e+00 | 4.525e+01 | K | RT68-RT69: TFTE Cover |
| HTFTEGRD12 | -1.564e+00 | 9.474e-01 | 1.627e+00 | -4.226e+01 | HTFTEGRD12 | |
| HTFTEGRD2 | -2.289e-02 | 4.798e-03 | -1.230e-02 | -2.439e-01 | K | RT59-RT60: TFTE Forward Cylinder |
| HTFTEGRD3 | -1.320e-01 | 9.315e-03 | 5.364e-02 | 1.644e-01 | K | RT60-RT58: TFTE Forward Cylinder |
| HTFTEGRD4 | 1.410e+00 | 1.927e-01 | -7.072e-02 | 1.183e+01 | K | RT61-RT62: TFTE Cone |
| HTFTEGRD5 | 1.216e+00 | 1.286e-01 | 8.806e-02 | 1.737e+00 | K | RT62-RT63: TFTE Cone |
| HTFTEGRD6 | -2.630e+00 | 3.065e-01 | -1.787e-02 | -1.286e+01 | K | RT63-RT61: TFTE Cone |
| HTFTEGRD7 | 5.647e+00 | 5.057e-01 | -1.447e-01 | 4.211e+01 | K | RT64-RT65: TFTE Cover |
| HTFTEGRD8 | -2.740e+01 | 8.032e-01 | 3.130e-01 | -7.163e+01 | K | RT65-RT66: TFTE Cover |
| HTFTEGRD9 | -2.487e+00 | 3.305e-01 | -8.300e-02 | 1.960e+00 | K | RT66-RT67: TFTE Cover |
| 
|

| Year | Month | |||||||||||
|---|---|---|---|---|---|---|---|---|---|---|---|---|
| 1999 | Jul | Aug | Sep | Oct | Nov | Dec | ||||||
| 2000 | Jan | Feb | Mar | Apr | May | Jun | Jul | Aug | Sep | Oct | Nov | Dec |
| 2001 | Jan | Feb | Mar | Apr | May | Jun | Jul | Aug | Sep | Oct | Nov | Dec |
| 2002 | Jan | Feb | Mar | Apr | May | Jun | Jul | Aug | Sep | Oct | Nov | DEC |
| 2003 | Jan | Feb | Mar | Apr | May | Jun | Jul | Aug | Sep | Oct | Nov | Dec |
| 2004 | Jan | Feb | Mar | Apr | May | Jun | Jul | Aug | Sep | Oct | ||