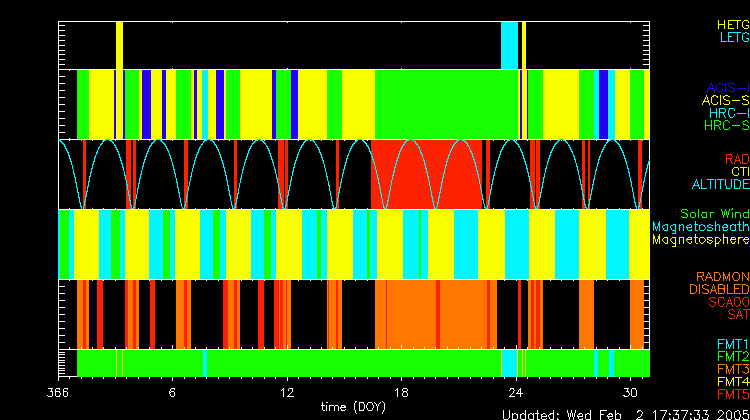

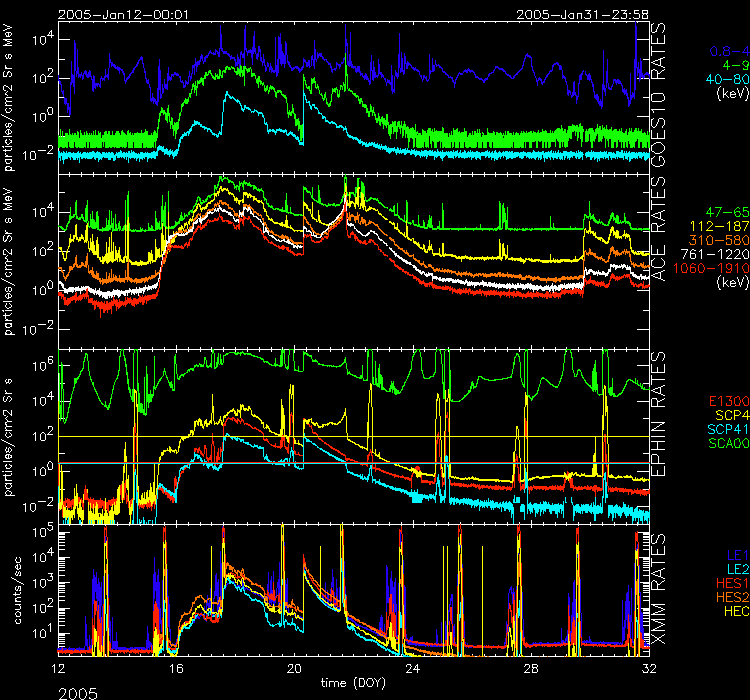
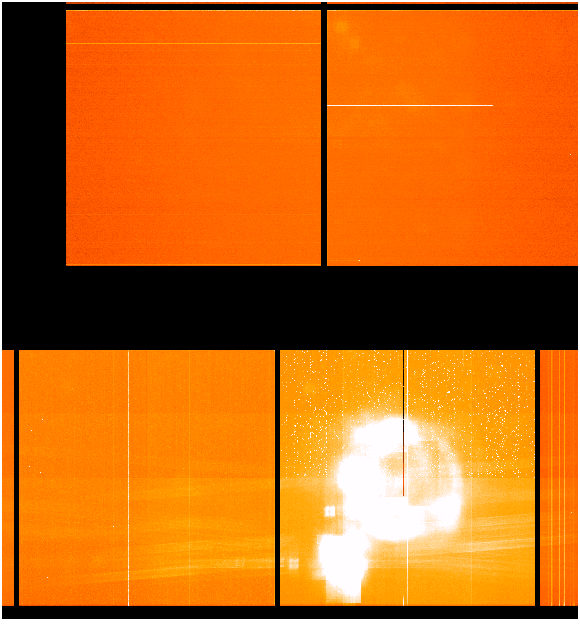
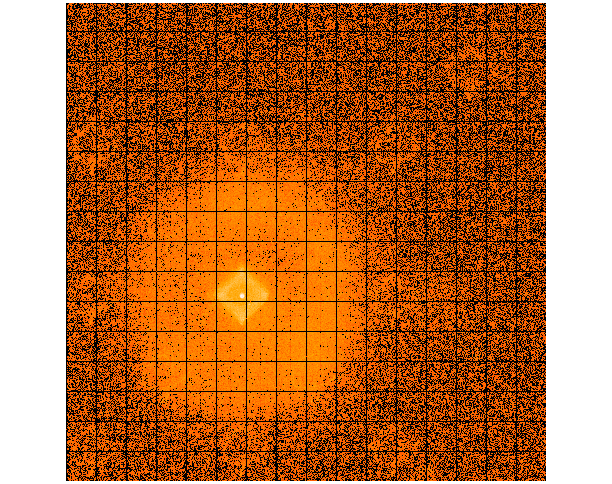
Statistics:
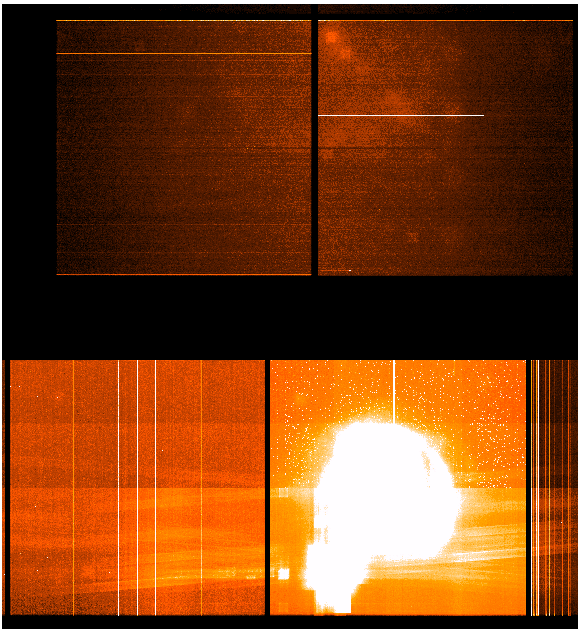
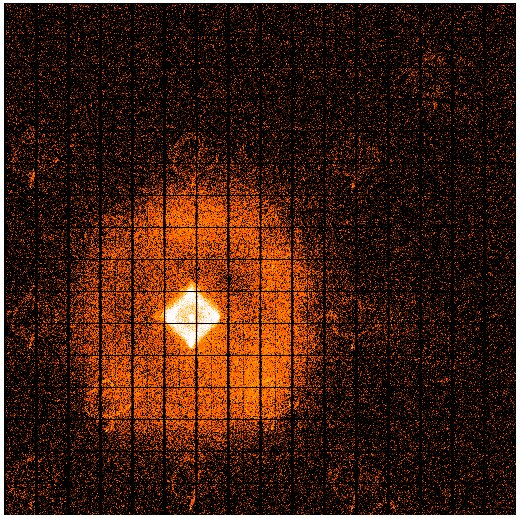
# IMAGE     NPIX      MEAN           RMS               MIN   MAX
ACIS_jan04 6004901    7.289         16.16              0.0   18069.0

 I2 node 0  262654  5.720008        4.142743           0.0   136.0
 I2 node 1  262654  6.734103        7.326397           0.0   237.0
 I2 node 2  262654  7.910548        13.865610          0.0  4368.0
 I2 node 3  262654  9.421806        14.544204          0.0   460.0

 I3 node 0  262654  10.404586       16.039350          0.0   458.0
 I3 node 1  262654  8.591451        11.787176          0.0   368.0
 I3 node 2  262654  7.301332        7.860536           0.0   235.0
 I3 node 3  262654  5.961287        4.163508           0.0   139.0

 S2 node 0  262397  8.931687        3.399037           0.0   173.0
 S2 node 1  262397  10.702512       22.507554          0.0   482.0
 S2 node 2  262397  9.332027        3.556288           0.0    68.0
 S2 node 3  262397  8.944797        3.390397           0.0   242.0

 S3 node 0  262397  13.337245       16.117694          0.0   276.0
 S3 node 1  262397  22.217586       54.276952          0.0  18069.0
 S3 node 2  262397  11.745965       3.786975           0.0    41.0
 S3 node 3  262397  10.746823       3.750907           0.0    54.0
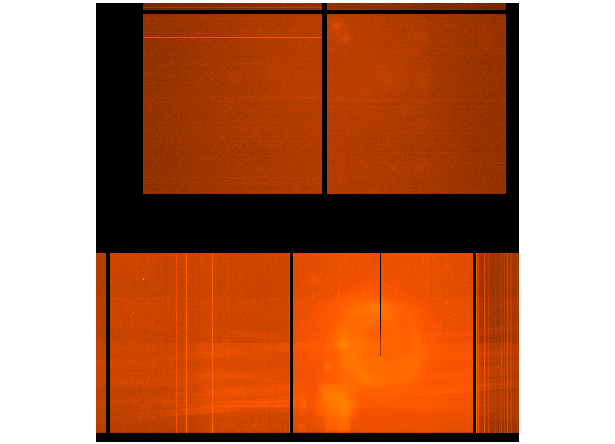
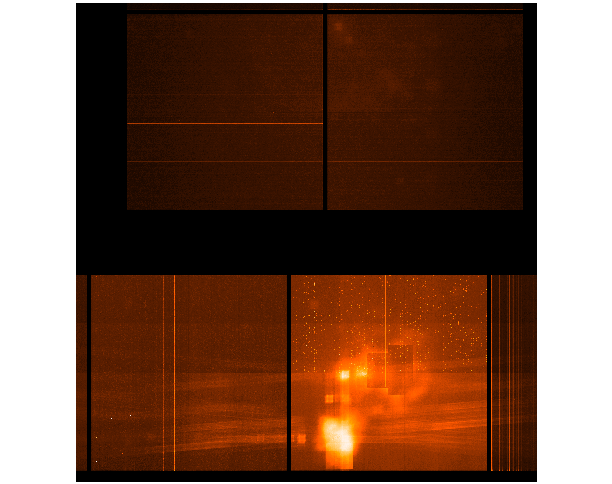
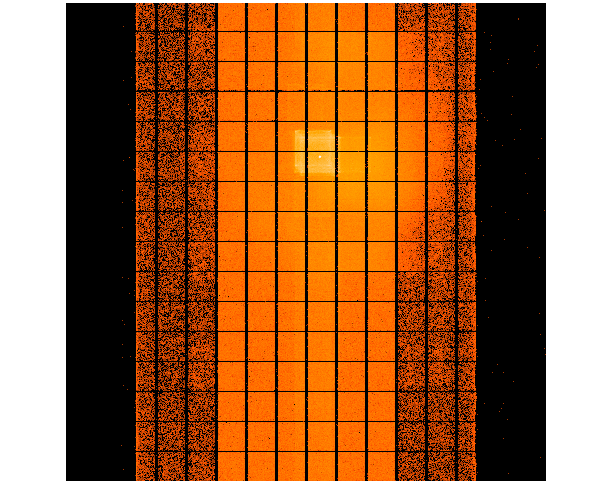
Statistics:
 IMAGE        NPIX      MEAN          RMS              MIN    MAX
 ACIS_total 6004901   587.846       1012.388           0.0  789950.0

 I2 node 0  262654  348.086018      262.950200        78.0  10259.0
 I2 node 1  262654  417.707337      554.295184       247.0  17855.0
 I2 node 2  262654  483.714609      857.273757       297.0  25009.0
 I2 node 3  262654  530.187699      1137.679973        0.0  30526.0

 I3 node 0  262654  571.376358      1147.640382      269.0  30471.0
 I3 node 1  262654  519.874851      858.087794       320.0  24163.0
 I3 node 2  262654  433.799531      555.059793       128.0  17363.0
 I3 node 3  262654  345.970699      245.425627         0.0  9668.0

 S2 node 0  262397  648.529941      346.551314       295.0  51758.0
 S2 node 1  262397  833.077261      1981.568107      300.0  37584.0
 S2 node 2  262397  771.862407      350.780446       390.0  158680.0
 S2 node 3  262397  748.147620      156.646086         0.0  2803.0

 S3 node 0  262397  1346.403446     798.276500       426.0  7055.0
 S3 node 1  262397  2242.029886     1224.915349        0.0  72850.0
 S3 node 2  262397  1503.997290     559.623449       417.0  28912.0
 S3 node 3  262397  1042.089582     236.123316         0.0  5964.0
|
|
|
|
| Oct 2004 | Jul 2004 | Apr 2004 | Jan 2004 |
|---|
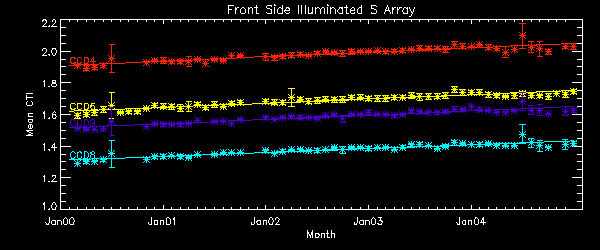
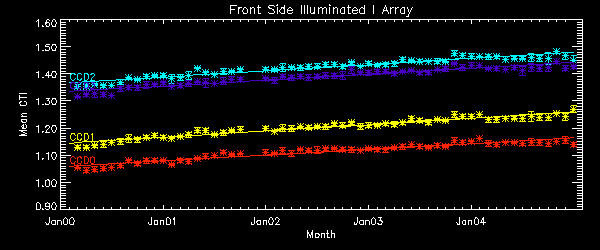
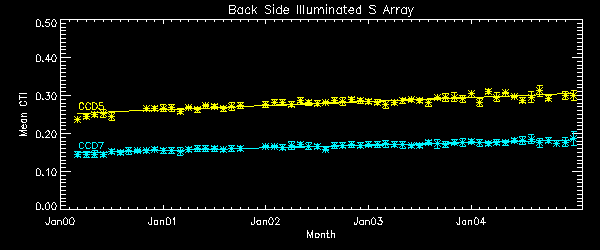
We report CTIs with a refined data definition. CTIs were computed for the temperature dependency corrected data. Please see new CTI page for detailed explanation. CTI's are computed for Mn K alpha, and defined as slope/intercept x10^4 of row # vs ADU. Data file here
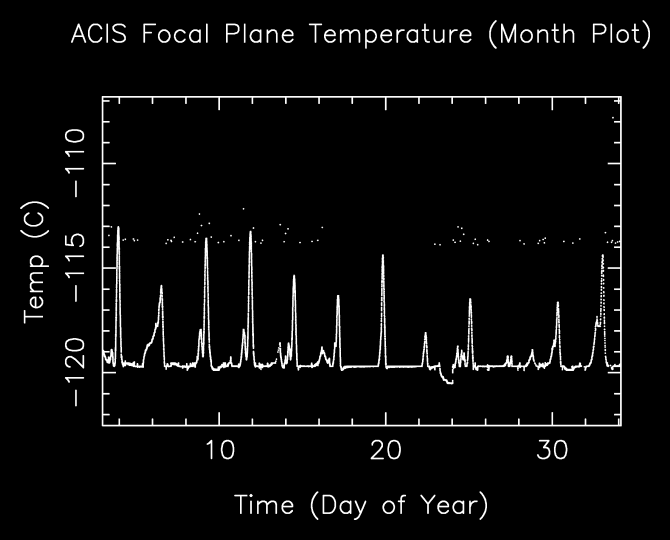
       The Mean (max) FPT: -118.00      std dev: 1.16
               mean width:    0.54 days std dev: 0.29

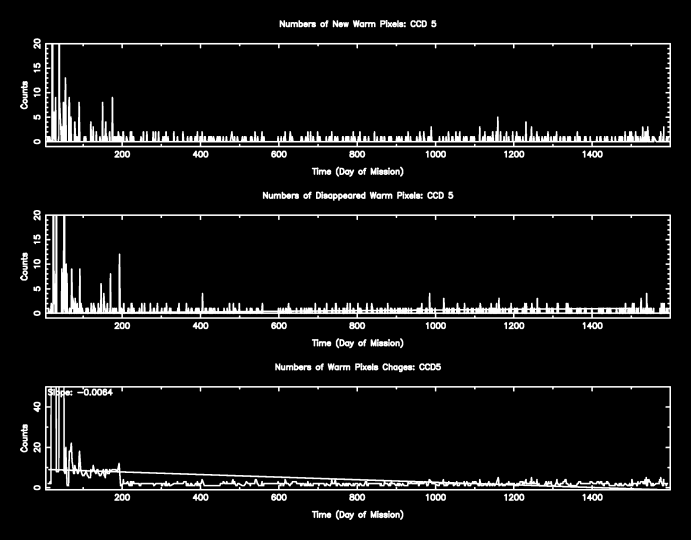
The plots below were generated with a new warm pixel finding script. Please see Acis Bad Pixel Page for details.
Front Side CCDs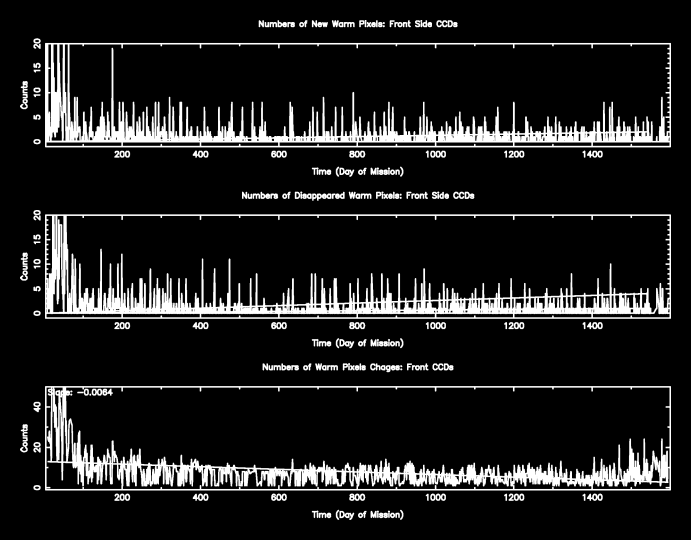
Back Side CCD (CCD5)
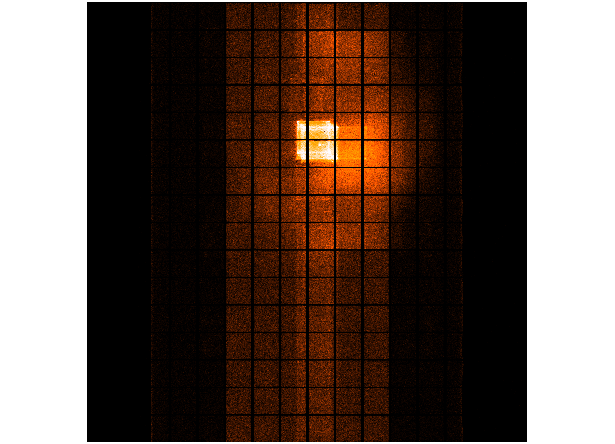
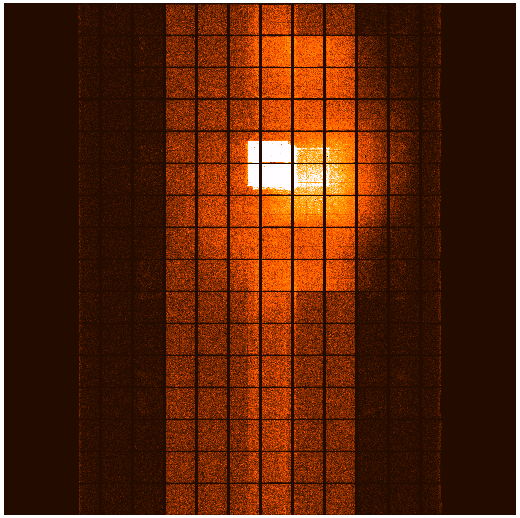
| Name | Low (keV) | Hight(KeV) | Description |
|---|---|---|---|
| SSoft | 0.00 | 0.50 | Super soft photons |
| Soft | 0.50 | 1.00 | Soft photons |
| Med | 1.00 | 3.00 | Moderate energy photons |
| Hard | 3.00 | 5.00 | Hard Photons |
| Harder | 5.00 | 10.00 | Very Hard photons |
| Hardest | 10.00 | Beyond 10 keV |
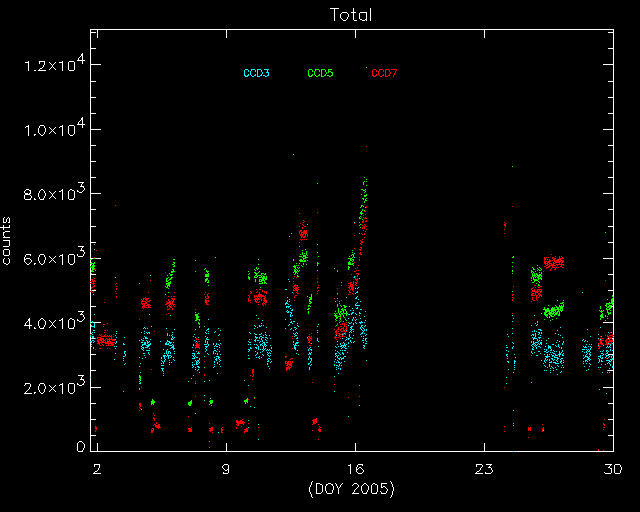
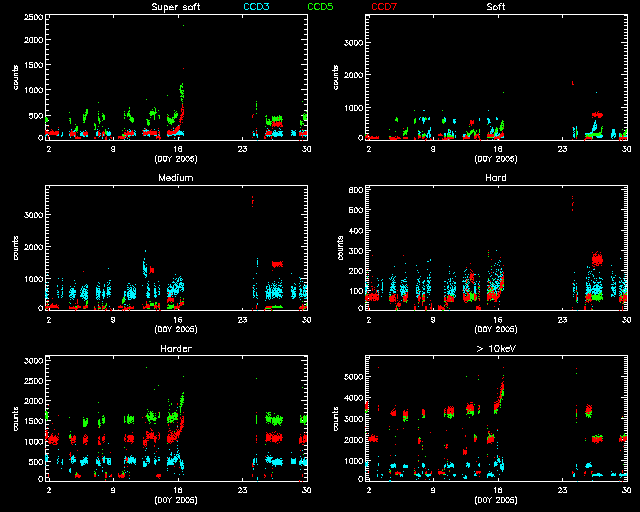
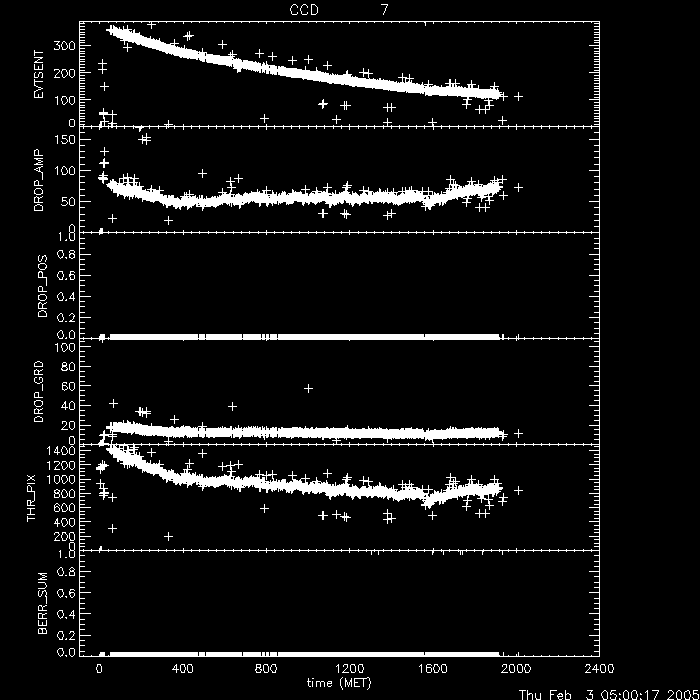
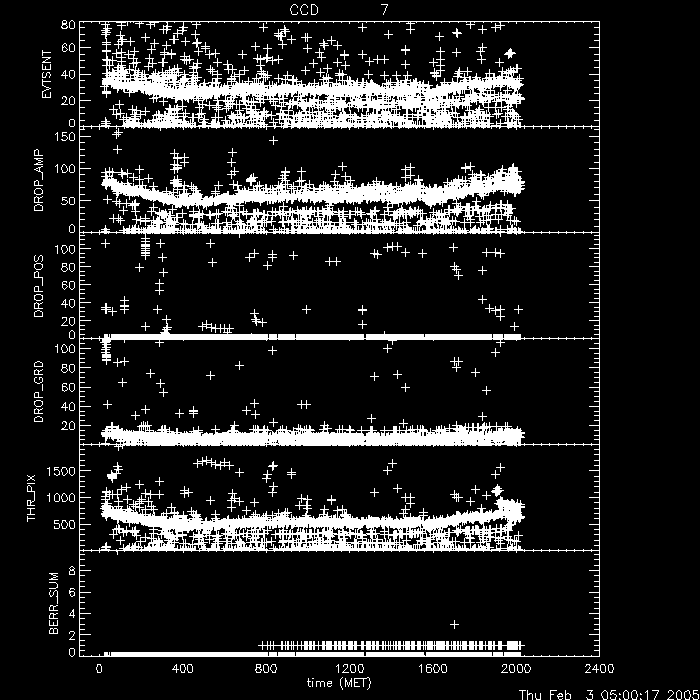
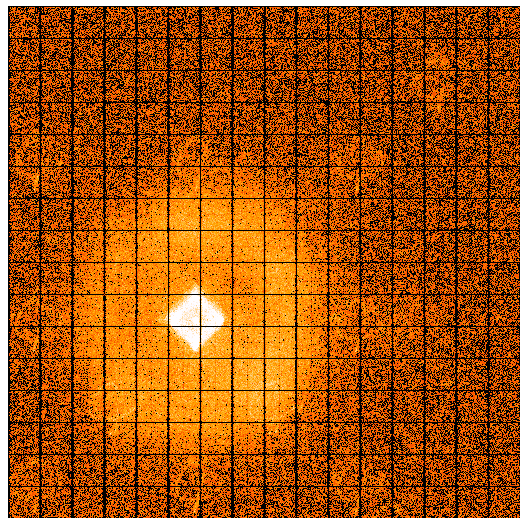
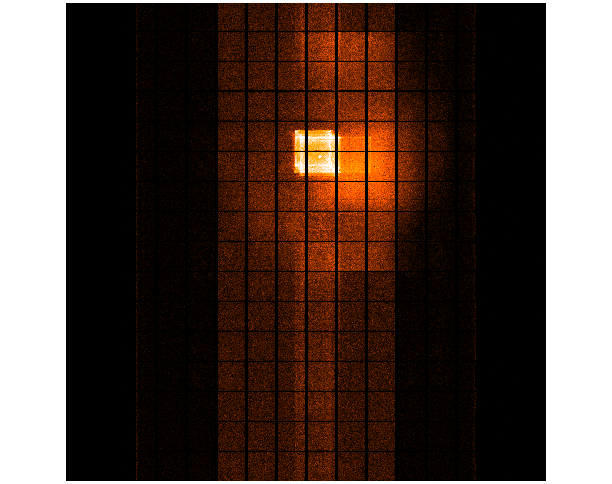
        IMAGE                NPIX      MEAN    STDDEV      MIN       MAX
HRCI_01_2005.fits          16777216  0.0206    0.1443      0.0       4 .0
        IMAGE                NPIX      MEAN    STDDEV      MIN       MAX
HRCI_08_1999_01_2005.fits  16777216  1.8050    3.7460      0.0       468.0
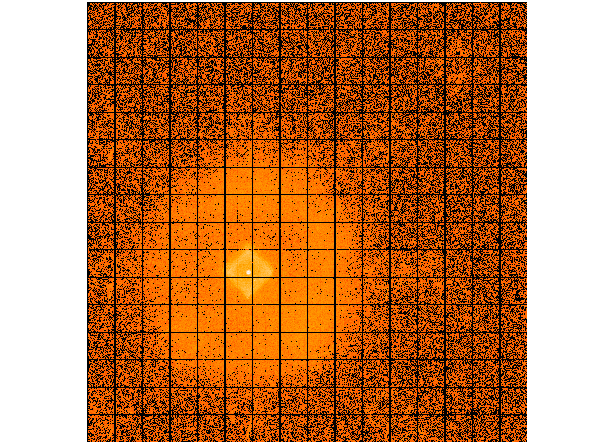
        IMAGE                NPIX      MEAN    STDDEV      MIN       MAX
HRCS_01_2005.fits          16777216  0.0257    0.1653      0.0       4.0
        IMAGE                NPIX      MEAN     STDDEV      MIN      MAX
HRCS_08_1999_01_2005.fits  16777216  5.9977    14.1307      0.0      1851.0
We display a max dose trend plot corrected for events that "pile-up" in the center of the taps due to bad position information.

|
|
|
|
| Oct 2004 | Jul 2004 | Apr 2004 | Jan 2004 |
|---|
|
|
|
|
| Oct 2004 | Jul 2004 | Apr 2004 | Jan 2004 |
|---|
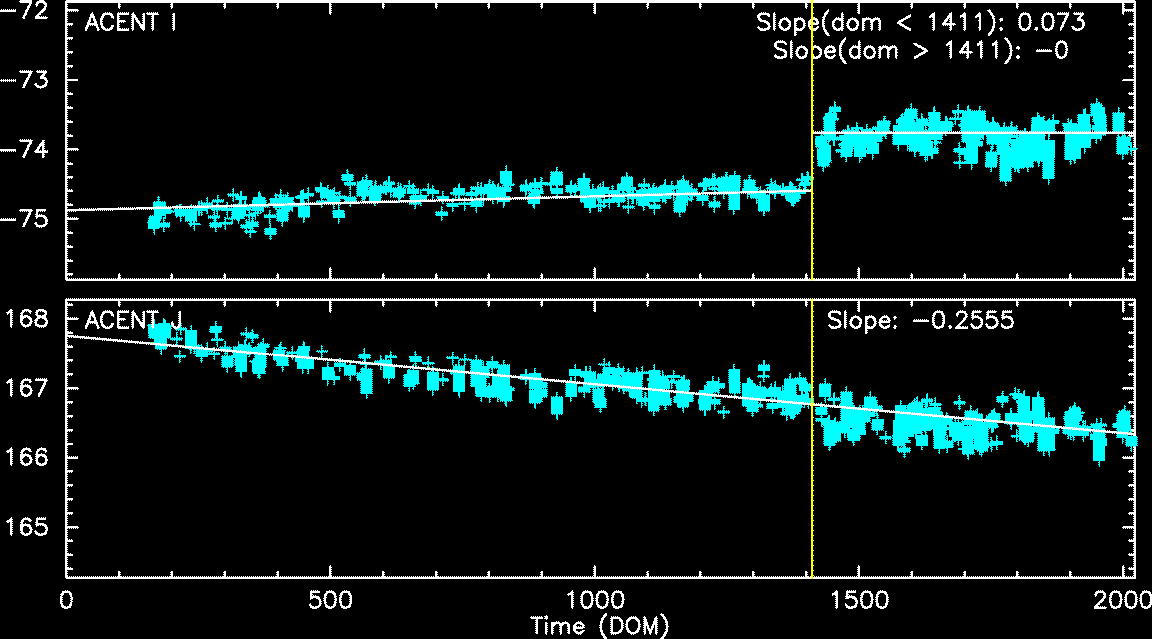
Fid light positions on ACA drift with time. The drift trends of Fid light 6 with ACIS S configuration are shown below.
The top panel shows Fid light 5 drift in ACENT I (app. along with -Y axis), and the bottom panel shows that in ACENT J (app. along with Z axis). The unit is a pixel, and one pixel is approximately 5 arcsec. The slope listed at the top right corner is the change in a position per year (arcsec/yr). The vertical line on DOM = 1411 (June 1, 2003) indicates a transition date of use of IRU-1 to IRU-2.
| Previous Quarter | ||||||
| MSID | MEAN | RMS | DELTA/YR | DELTA/YR/YR | UNITS | DESCRIPTION |
| 5EPHINT | 3.022e+02 | 7.089e+00 | -2.387e+01 | -1.447e+03 | TEMP | EPHIN |
| HKEBOXTEMP | 3.070e+02 | 7.102e+00 | -2.380e+01 | -1.461e+03 | K | EHPIN HOUSEKEEPING EBOX: TEMPERATURE (5EHSE300) |
| HKP27I | 6.260e+00 | 1.077e+00 | -3.920e+00 | -1.923e+02 | AMP | HK 27 Volts Rail - Current |
| HKP27V | 2.655e+01 | 1.536e+00 | -5.318e-01 | 4.453e+01 | V | HK 27 Volts Rail - Voltage |
| TEIO | 3.021e+02 | 1.836e+01 | -4.409e+01 | -2.478e+03 | K | EPHIN ELECTRONICS HOUSING TEMP |
| TEPHIN | 3.022e+02 | 7.361e+00 | -2.379e+01 | -1.487e+03 | TEMP | EPHIN SENSOR HOUSING |
| 
|

| Year | Month | |||||||||||
|---|---|---|---|---|---|---|---|---|---|---|---|---|
| 1999 | Jul | Aug | Sep | Oct | Nov | Dec | ||||||
| 2000 | Jan | Feb | Mar | Apr | May | Jun | Jul | Aug | Sep | Oct | Nov | Dec |
| 2001 | Jan | Feb | Mar | Apr | May | Jun | Jul | Aug | Sep | Oct | Nov | Dec |
| 2002 | Jan | Feb | Mar | Apr | May | Jun | Jul | Aug | Sep | Oct | Nov | Dec |
| 2003 | Jan | Feb | Mar | Apr | May | Jun | Jul | Aug | Sep | Oct | Nov | Dec |
| 2004 | Jan | Feb | Mar | Apr | May | Jun | Jul | Aug | Sep | Oct | Nov | Dec |