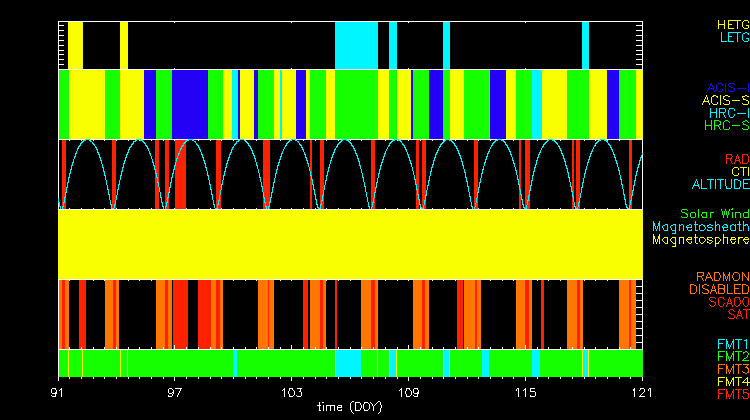

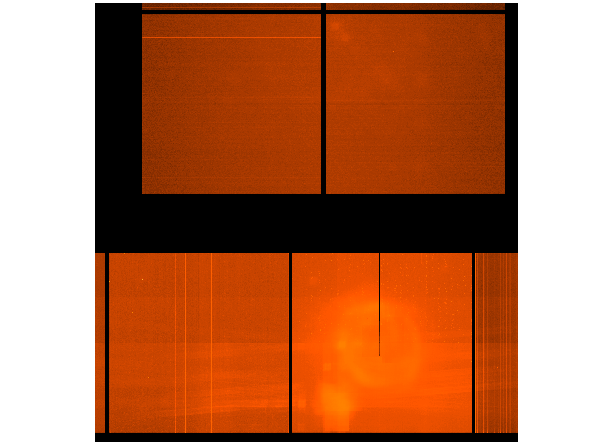
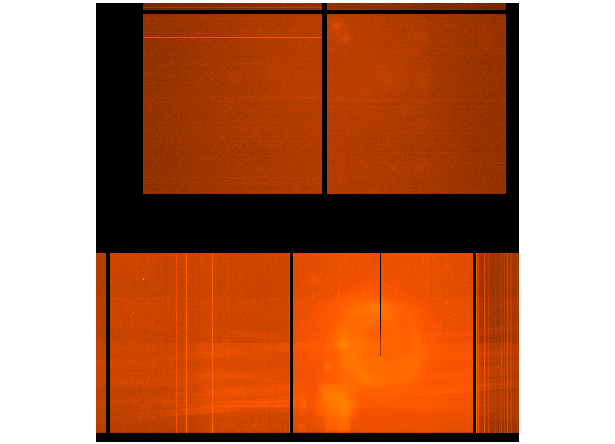
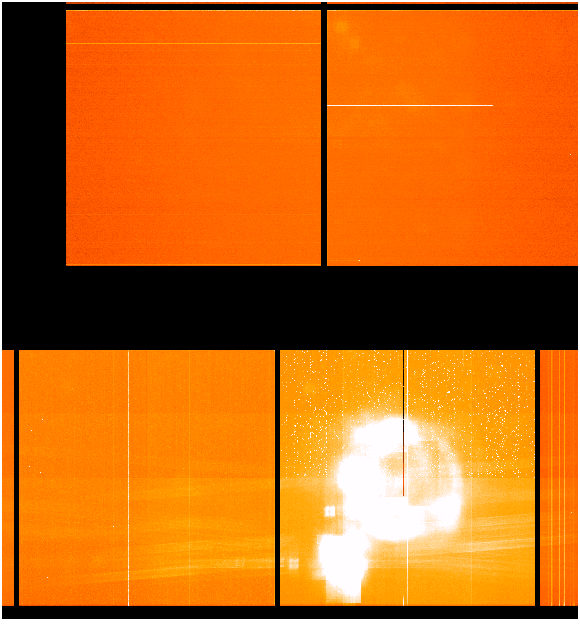
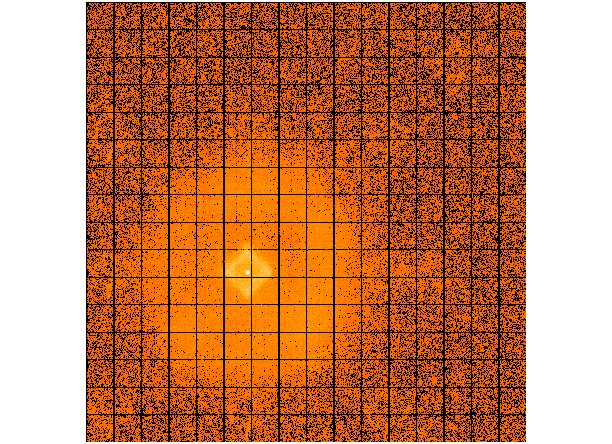
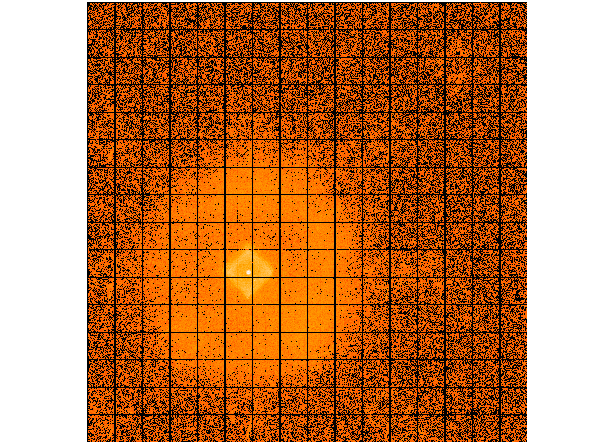
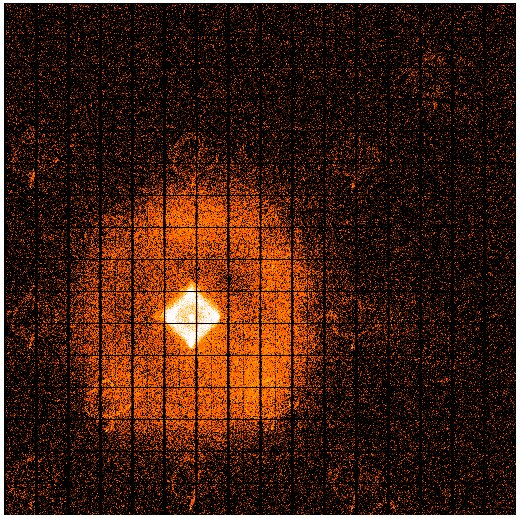
We updated ACIS cumulative dose map from this month. The steps we took to compute a new dose map are;
Please check more detail plots at Telemetered Photon Dose Trend page.
Statistics:
# IMAGE     NPIX      MEAN           RMS               MIN   MAX
ACIS_apr05 6004901    11.302        24.401             0.0   642.0


 I2 node 0  262654   6.340193       4.658260           0.0   161.0
 I2 node 1  262654   7.448495       8.474344           0.0   282.0
 I2 node 2  262654   8.666805       12.822435          0.0   385.0
 I2 node 3  262654   9.726922       17.124377          0.0   493.0

 I3 node 0  262654   11.773592      19.151334          0.0   535.0
 I3 node 1  262654   11.182373      14.472558          0.0   423.0
 I3 node 2  262654   8.864754       9.662554           0.0   292.0
 I3 node 3  262654   6.994719       4.967537           0.0   179.0

 S2 node 0  262654   13.725774      4.512954           0.0   156.0
 S2 node 1  262654   18.789647      28.445414          0.0   635.0
 S2 node 2  262654   20.980267      10.602611          0.0    87.0
 S2 node 3  262654   16.676056      7.006435           0.0   224.0

 S3 node 0  262654   18.485067      32.179603          0.0   461.0
 S3 node 1  262654   39.122136      89.575395          0.0   642.0
 S3 node 2  262654   21.527479      10.227946          1.0   123.0
 S3 node 3  262654   23.227106      13.103097          0.0    70.0
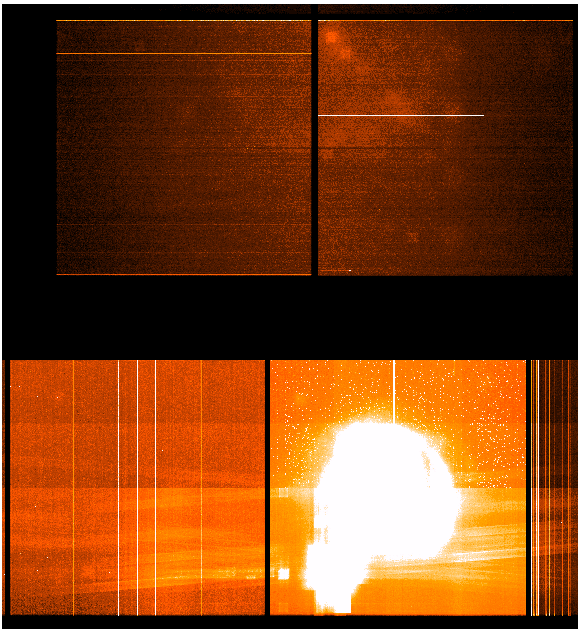
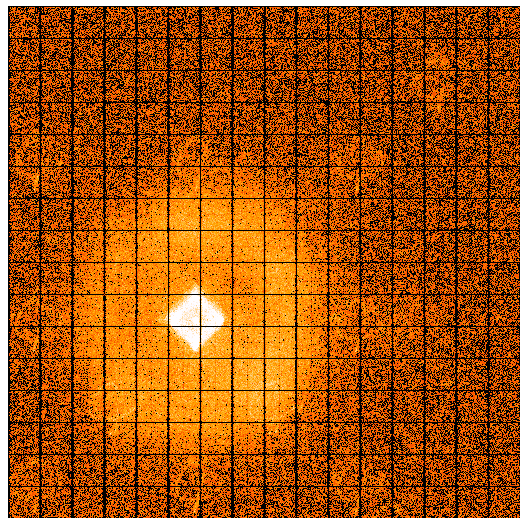
Statistics:
 IMAGE        NPIX      MEAN          RMS              MIN    MAX
 ACIS_total 6004901   755.960       1090.164           0.0  44316.0

 I2 node 0  262654   446.615011    303.595014        91.0  11989.0
 I2 node 1  262654   528.444345    643.983200       336.0  20809.0
 I2 node 2  262654   606.907475    998.429340       392.0  29113.0
 I2 node 3  262654   663.347415    1325.159009        0.0  35586.0

 I3 node 0  262654   725.208004    1344.870321      351.0  35746.0
 I3 node 1  262654   655.050664    1005.233302      411.0  28297.0
 I3 node 2  262654   552.528657    651.192244       149.0  20351.0
 I3 node 3  262654   445.074768    289.792362         0.0  11384.0

 S2 node 0  262654   838.397737    117.804907       368.0  12056.0
 S2 node 1  262654   1064.527011   2333.815506      368.0  44316.0
 S2 node 2  262654   1005.993533   209.587570       525.0  7590.0
 S2 node 3  262654   980.035846    205.086584         0.0  3943.0

 S3 node 0  262654   1746.740050   1005.843215      597.0  8828.0
 S3 node 1  262654   2867.740424   1567.057225        0.0  9886.0
 S3 node 2  262654   1957.006856   702.690276       503.0  4594.0
 S3 node 3  262654   1379.043419   298.687496         0.0  6489.0
|
|
|
|
| Jan 2005 | Oct 2004 | Jul 2004 | Apr 2004 |
|---|
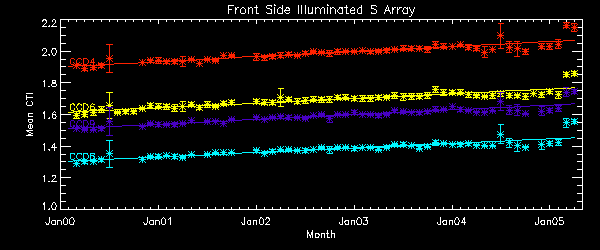
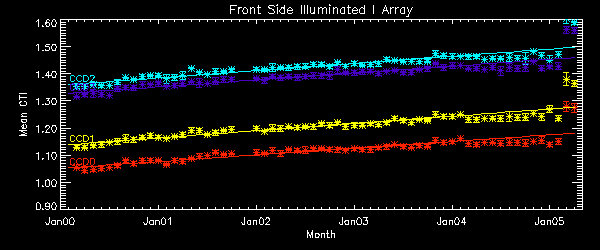
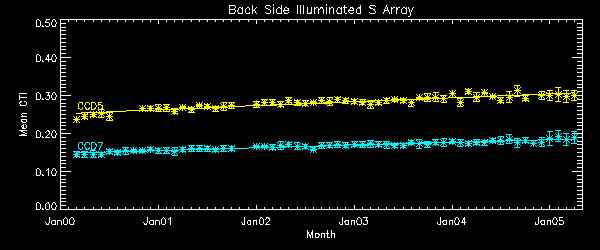
We report CTIs with a refined data definition. CTIs were computed for the temperature dependency corrected data. Please see new CTI page for detailed explanation. CTI's are computed for Mn K alpha, and defined as slope/intercept x10^4 of row # vs ADU. Data file here
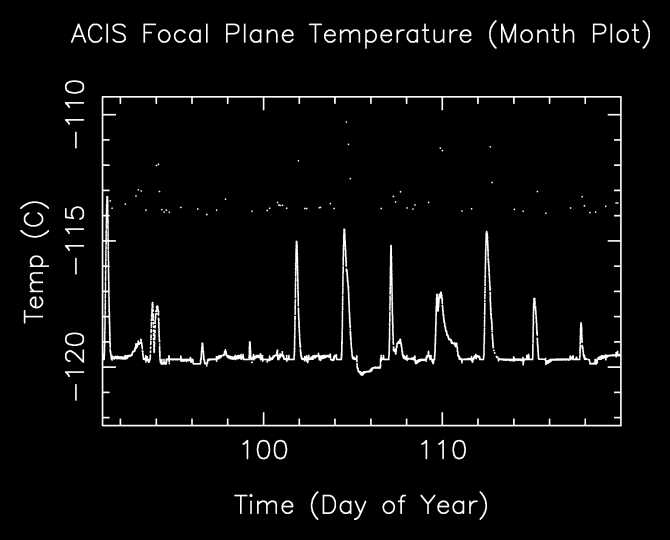
       The Mean (max) FPT: -116.68      std dev: 1.87
               mean width:    0.43 days std dev: 0.31

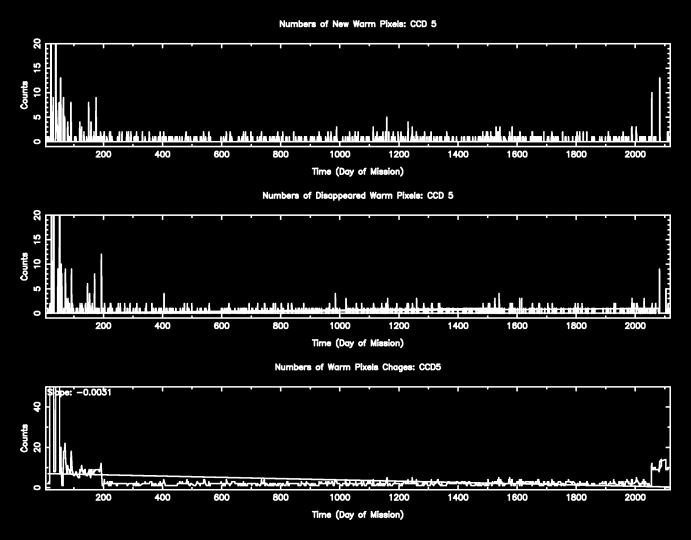
The plots below were generated with a new warm pixel finding script. Please see Acis Bad Pixel Page for details.
Front Side CCDs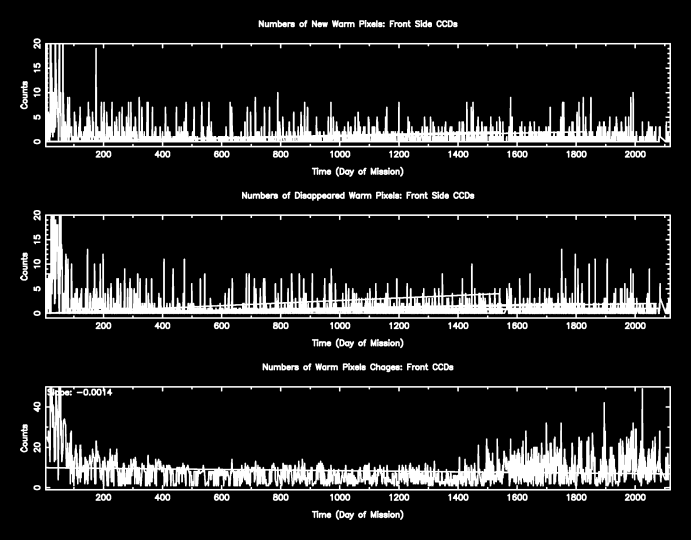
Back Side CCD (CCD5)
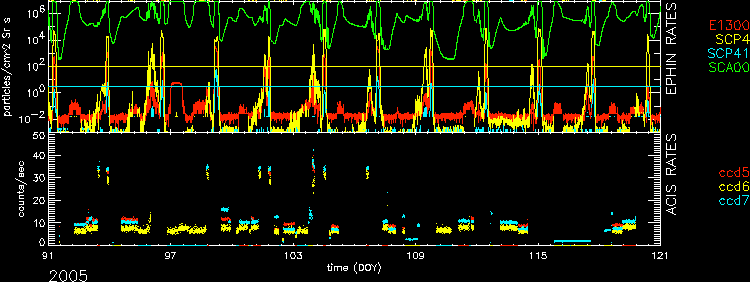
| Name | Low (keV) | Hight(KeV) | Description |
|---|---|---|---|
| SSoft | 0.00 | 0.50 | Super soft photons |
| Soft | 0.50 | 1.00 | Soft photons |
| Med | 1.00 | 3.00 | Moderate energy photons |
| Hard | 3.00 | 5.00 | Hard Photons |
| Harder | 5.00 | 10.00 | Very Hard photons |
| Hardest | 10.00 | Beyond 10 keV |
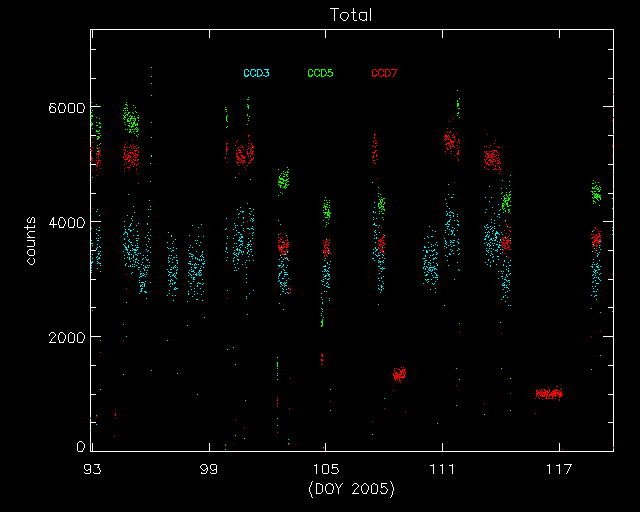
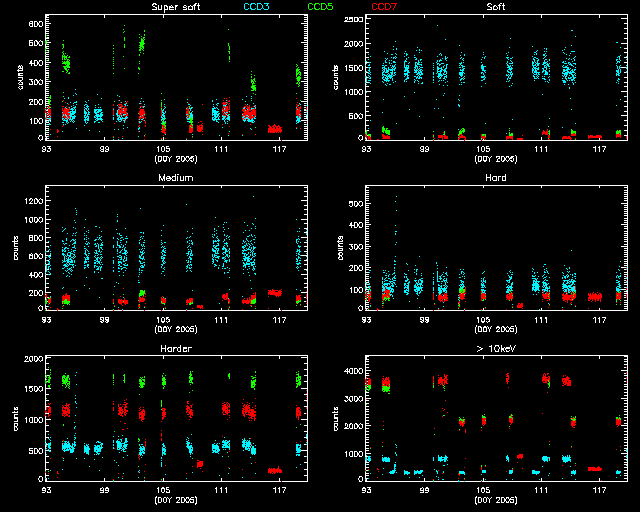
From this month, we trend 10th brightest data points instead of the maximum. This makes the maximum trend values to be about 20% lower than the previous months.
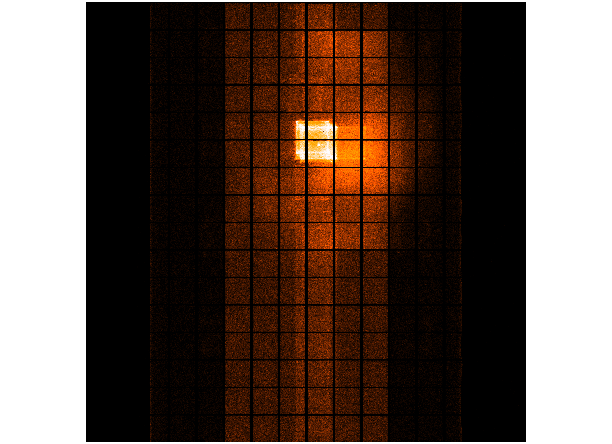
        IMAGE                NPIX      MEAN    STDDEV      MIN       MAX
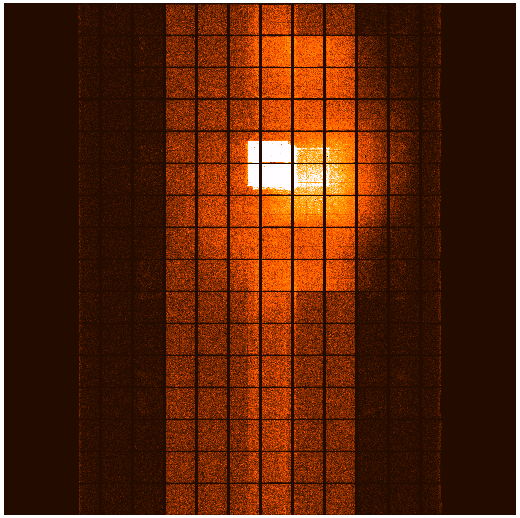
HRCI_04_2005.fits          16777216  0.0672    0.2670      0.0       7.0
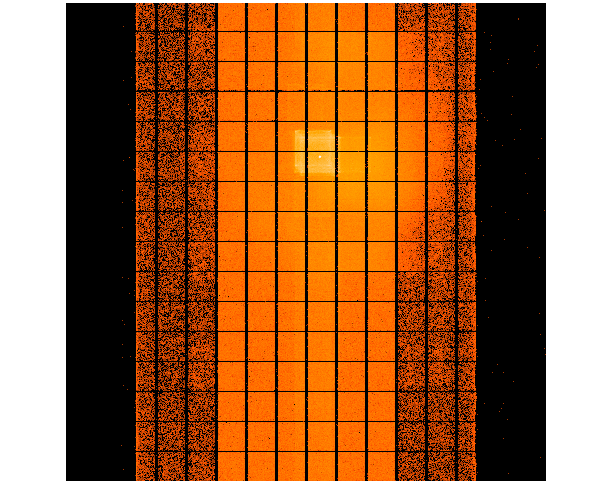
        IMAGE                NPIX      MEAN    STDDEV      MIN       MAX
HRCI_08_1999_04_2005.fits  16777216  1.7953    2.9595      0.0       282.0
        IMAGE                NPIX      MEAN    STDDEV      MIN       MAX
HRCS_04_2005.fits          16777216  0.0877    0.3169      0.0       9.0
        IMAGE                NPIX     MEAN      STDDEV      MIN      MAX
HRCS_08_1999_04_2005.fits  16777216  6.1179    13.8495      0.0      1502.0
We display a max dose trend plot corrected for events that "pile-up" in the center of the taps due to bad position information.

|
|
|
|
| Jan 2005 | Oct 2004 | Jul 2004 | Apr 2004 |
|---|
|
|

|
|
| Jan 2005 | Oct 2004 | Jul 2004 | Apr 2004 |
|---|

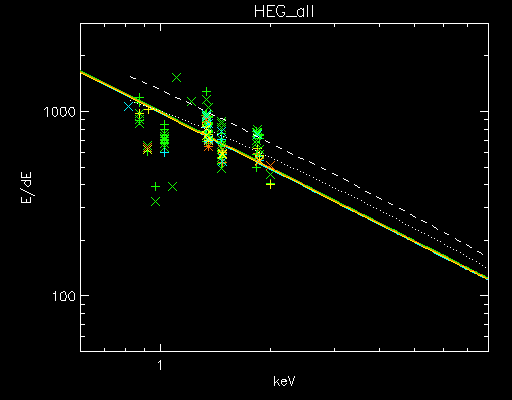
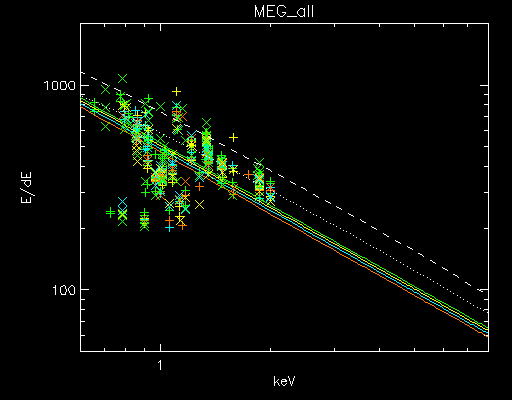
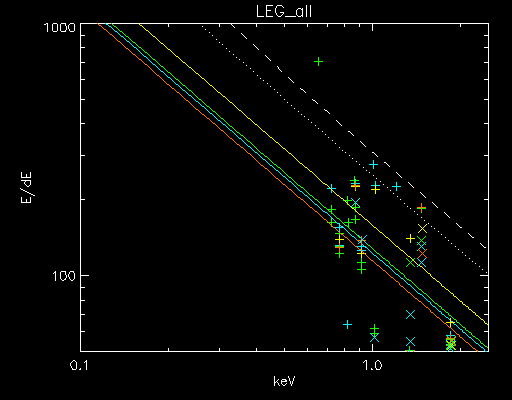
| Plot symbol indicates dispersion arm: | Color indicates observation date: |
Minus side = cross (x) |
2001-2002 blue 2003-2004 yellow 2005 orange |
| Previous Quarter | ||||||
| MSID | MEAN | RMS | DELTA/YR | DELTA/YR/YR | UNITS | DESCRIPTION |
| DEAHK1 | 1.538e+01 | 1.617e+00 | -1.569e+00 | 2.071e+02 | C | DPA Thermistor 1 - BEP PC Board |
| DEAHK5 | 1.916e+01 | 2.491e+00 | -2.906e+00 | 2.400e+02 | C | DPA Thermistor 5 - FEP 0 ACTEL |
| DEAHK10 | 2.053e+01 | 2.819e+00 | -3.087e+00 | 2.230e+02 | C | DPA Thermistor 10- FEP 1 ACTEL |
| DEAHK15 | -2.485e+02 | 1.766e-01 | -1.833e-01 | -9.802e+00 | C | Focal Plane Temp. Board 12 |
| DEAHK16 | -1.193e+02 | 1.050e+00 | -1.773e+00 | 3.286e+01 | C | Focal Plane Temp. Board 11 |
| Previous Quarter | ||||||
| MSID | MEAN | RMS | DELTA/YR | DELTA/YR/YR | UNITS | DESCRIPTION |
| AIRU2G1I | 1.031e+02 | 1.938e-01 | -8.743e-01 | -7.504e+00 | MAMP | IRU-2 GYRO #1 CURRENT |
| AIRU2G2I | 9.923e+01 | 1.073e+00 | -9.865e+00 | -2.104e+01 | MAMP | IRU-2 GYRO #2 CURRENT |
| Previous Quarter | ||||||
| MSID | MEAN | RMS | DELTA/YR | DELTA/YR/YR | UNITS | DESCRIPTION |
| AOGBIAS1 | -4.146e-06 | 7.390e-08 | -1.033e-06 | 4.322e-07 | RADPS | GYRO DRIFT RATE ESTIMATE (ROLL) |
| AOGBIAS2 | -9.787e-06 | 3.894e-08 | -5.334e-07 | 6.747e-07 | RADPS | GYRO DRIFT RATE ESTIMATE (PITCH) |
| AOGBIAS3 | -5.461e-06 | 5.478e-08 | -7.670e-07 | 7.518e-08 | RADPS | GYRO DRIFT RATE ESTIMATE (YAW) |
| AOGYRCT1 | -6.014e+00 | 5.641e+02 | 4.199e+01 | 6.618e+02 | CNTS | ACCUMULATED GYRO PULSE COUNTS FROM OBC SELECTED GYRO 1 |
| AOGYRCT2 | -7.797e+00 | 1.724e+03 | 1.083e+02 | -5.852e+03 | CNTS | ACCUMULATED GYRO PULSE COUNTS FROM OBC SELECTED GYRO 2 |
| AOGYRCT3 | 1.423e+02 | 1.484e+04 | 2.640e+03 | -3.046e+03 | CNTS | ACCUMULATED GYRO PULSE COUNTS FROM OBC SELECTED GYRO 3 |
| AOGYRCT4 | -5.140e+00 | 1.145e+03 | -3.454e+01 | 1.786e+03 | CNTS | ACCUMULATED GYRO PULSE COUNTS FROM OBC SELECTED GYRO 4 |
| 
|

| Year | Month | |||||||||||
|---|---|---|---|---|---|---|---|---|---|---|---|---|
| 1999 | Jul | Aug | Sep | Oct | Nov | Dec | ||||||
| 2000 | Jan | Feb | Mar | Apr | May | Jun | Jul | Aug | Sep | Oct | Nov | Dec |
| 2001 | Jan | Feb | Mar | Apr | May | Jun | Jul | Aug | Sep | Oct | Nov | Dec |
| 2002 | Jan | Feb | Mar | Apr | May | Jun | Jul | Aug | Sep | Oct | Nov | Dec |
| 2003 | Jan | Feb | Mar | Apr | May | Jun | Jul | Aug | Sep | Oct | Nov | Dec |
| 2004 | Jan | Feb | Mar | Apr | May | Jun | Jul | Aug | Sep | Oct | Nov | Dec |
| 2005 | Jan | Feb | Mar | Apr | May | Jun | Jul | Aug | Sep | Oct | Nov | Dec |