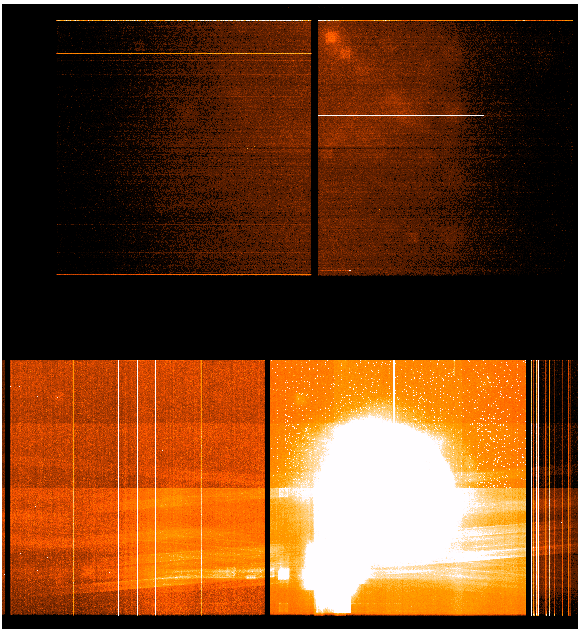
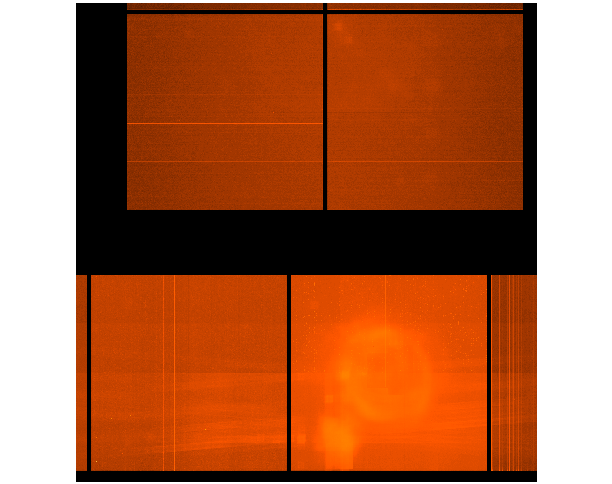
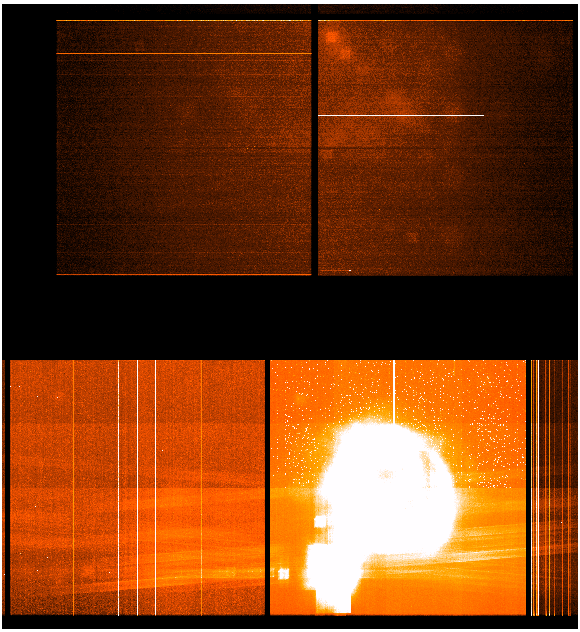
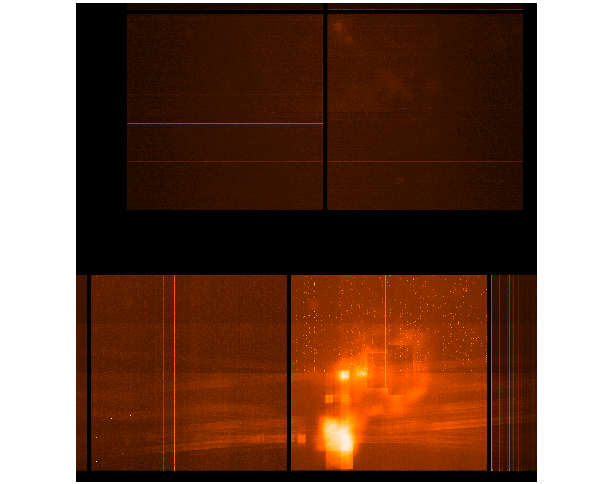
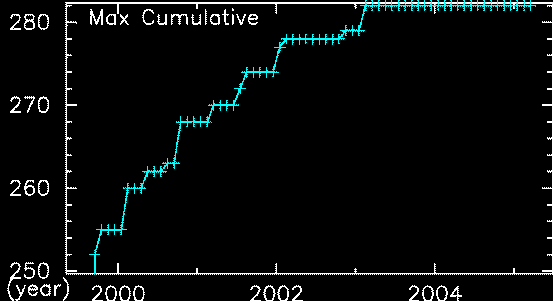
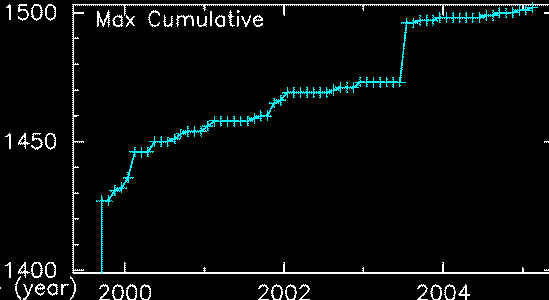
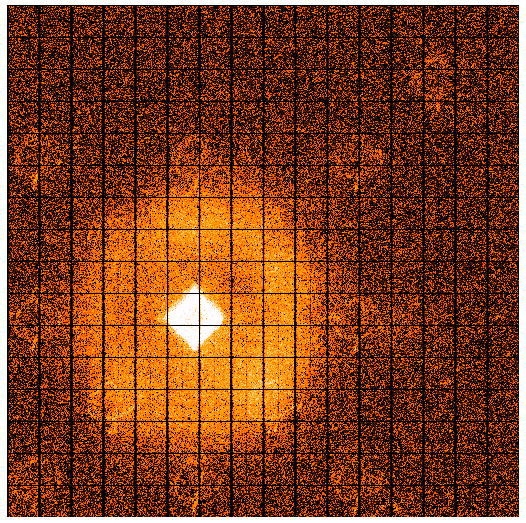
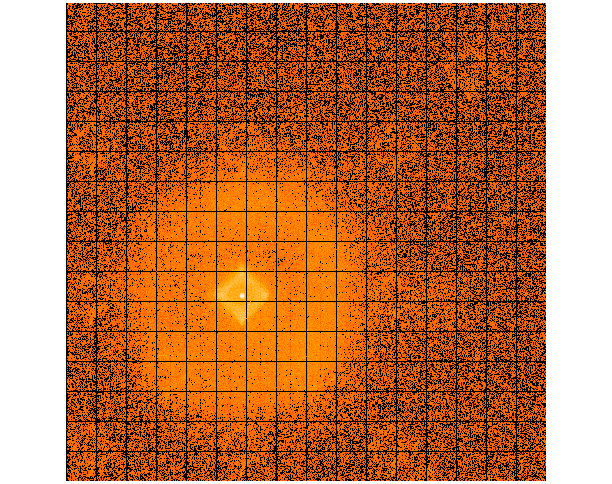
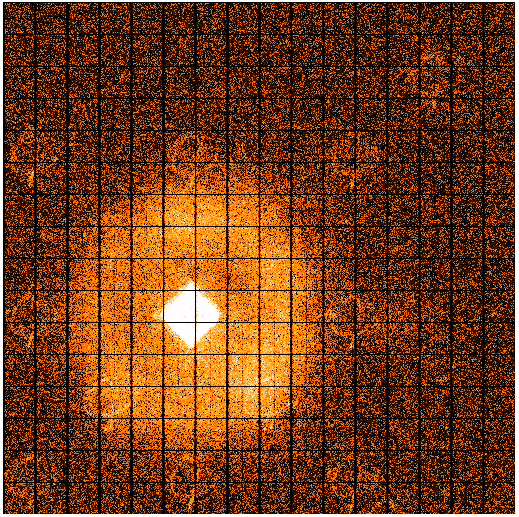
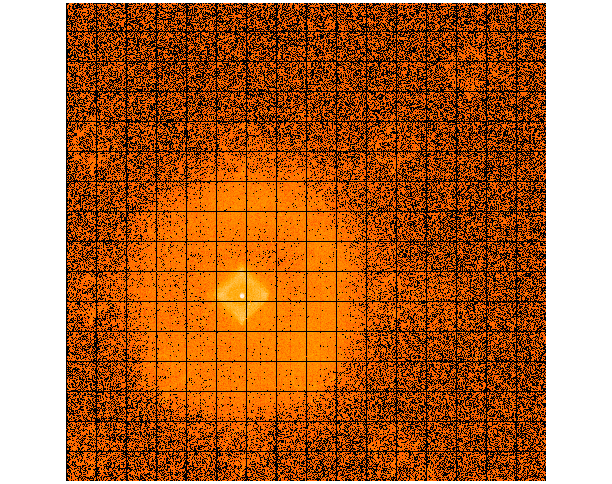
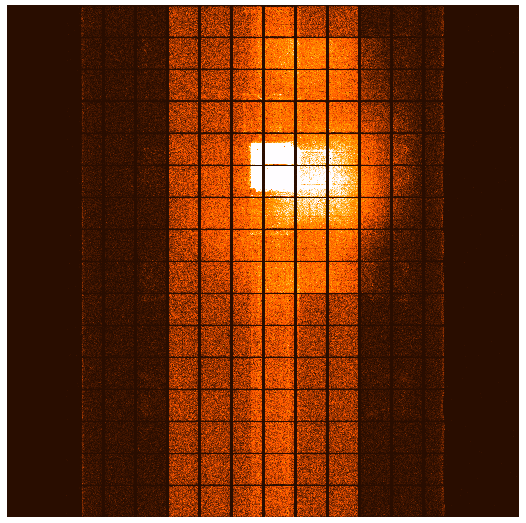
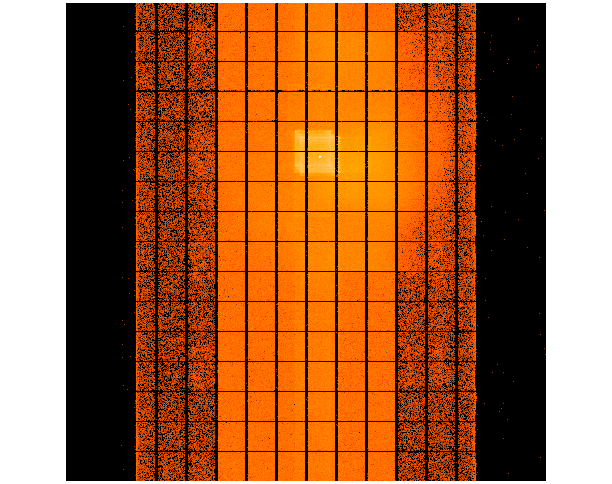
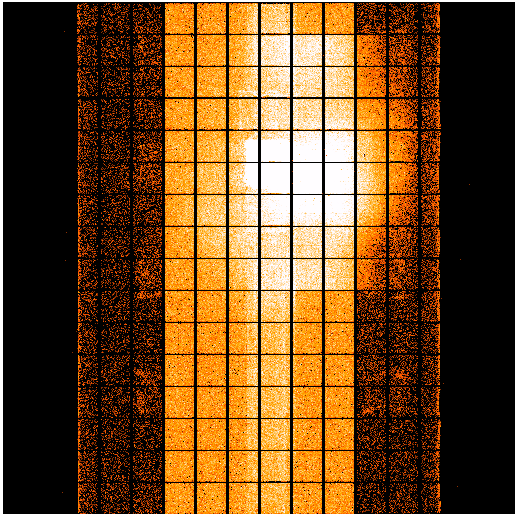
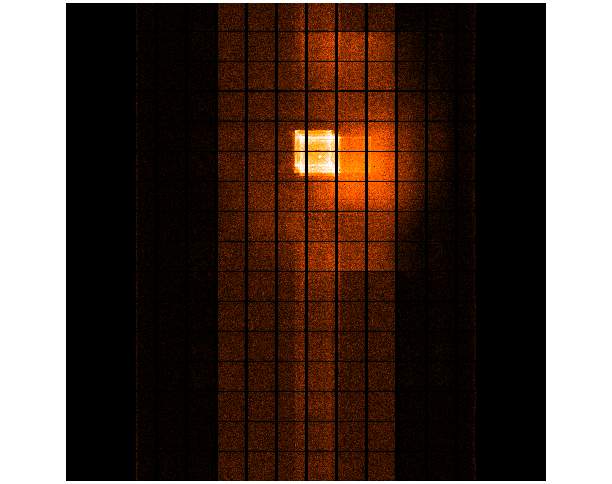
We updated ACIS cumulative dose map from this month. The steps we took to compute a new dose map are;
- Level 1 Event files for a specified month are obtained from archive.
- Image data including I2, I3, S2, S3 CCDs are extracted from all event files.
- All the extracted image data were merged to create a month long exposure map for the month.
- The exposure map is opened with ds9, and check a distribution of count rates against energy.
From this, estimate the upper threshold value. Any events beyond this upper threshold are
assumed erroneous events such as bad pixels.
- Using this upper threshold, the data is filtered, and create a cleaned exposure map for the month.
- The exposure map from each month from the Jul 1999 is added up to create a cumulative exposure
map for each month.
- Using fimgstatistic, we compute count rate statistics for each CCDs.
- For observations with high data drop rates (e.g., Crab nebula, Cas A), we corrected the observations
by adding events.
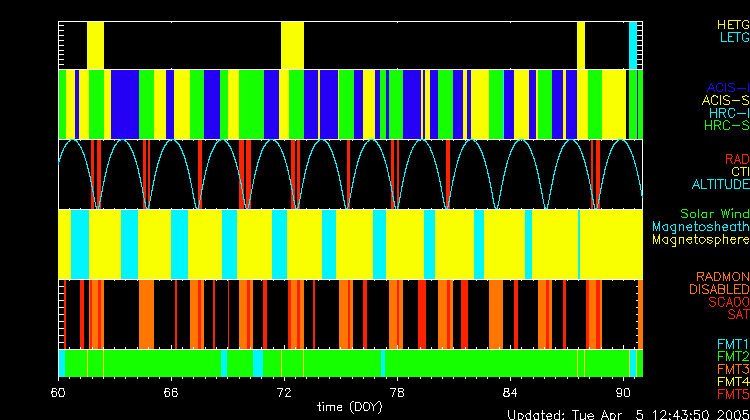
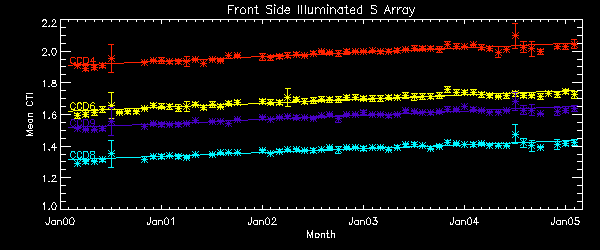
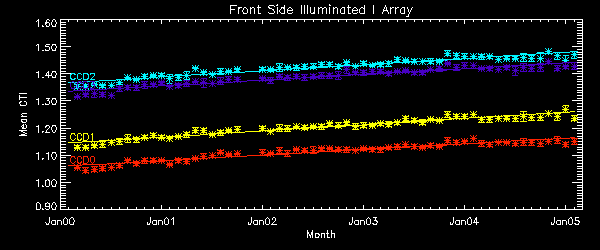
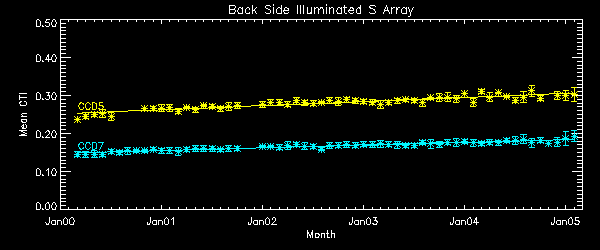
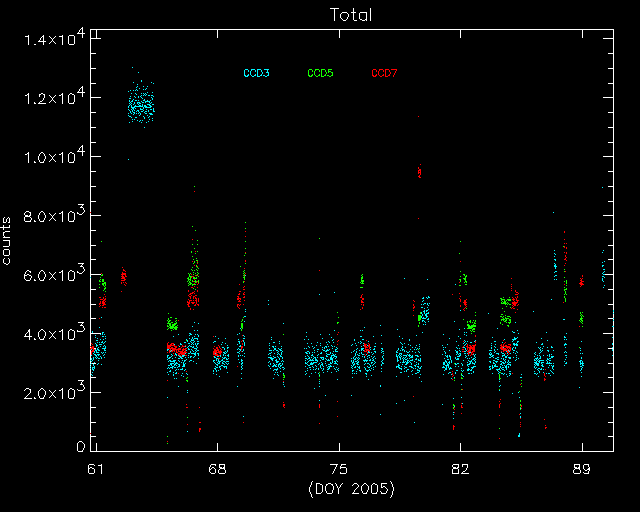
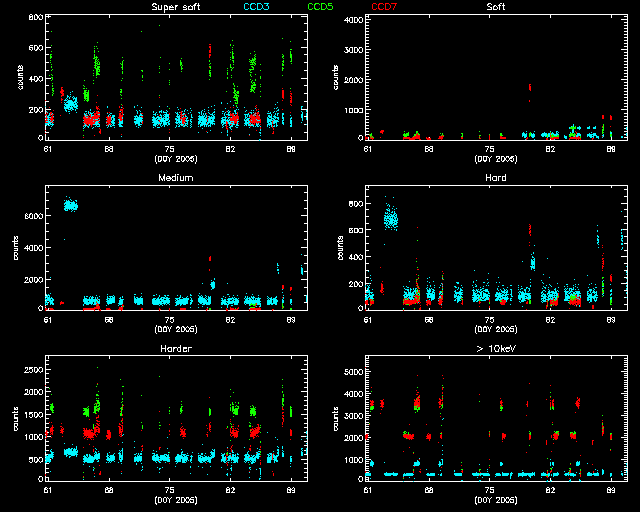
Please check more detail plots at Telemetered Photon Dose Trend page.
- MAR registered-photon-map in fits
Statistics:
# IMAGE     NPIX      MEAN           RMS               MIN   MAX
ACIS_mar05 6004901    10.334        15.408             0.0   707.0

 I2 node 0  262654  8.218969        6.004786           0.0   223.0
 I2 node 1  262654  9.847503        11.532622          0.0   376.0
 I2 node 2  262654  11.598963       17.498758          0.0   542.0
 I2 node 3  262654  13.420694       23.486225          0.0   707.0

 I3 node 0  262654  18.180686       26.964422          0.0   703.0
 I3 node 1  262654  14.067347       19.718800          0.0   595.0
 I3 node 2  262654  11.051581       12.981074          0.0   427.0
 I3 node 3  262654  8.813439        6.442930           0.0   252.0

 S2 node 0  262397  13.334070       4.119779           0.0   107.0
 S2 node 1  262397  17.535982       33.172406          0.0   702.0
 S2 node 2  262397  17.558532       6.623921           0.0    89.0
 S2 node 3  262397  14.628174       4.800505           0.0   328.0

 S3 node 0  262397  12.678346       14.394226          0.0   240.0
 S3 node 1  262397  20.808367       35.943233          0.0   317.0
 S3 node 2  262397  15.360164       6.652289           0.0   306.0
 S3 node 3  262397  16.473264       8.066246           0.0    53.0
- July 1999 - March 2005 registered-photon-map in fits
Statistics:
 IMAGE        NPIX      MEAN          RMS              MIN    MAX
 ACIS_total 6004901   756.316       1118.562           0.0  436896.0

 I2 node 0  262654  439.844320      299.602362        91.0  11822.0
 I2 node 1  262654  520.538278      635.687483       331.0  20562.0
 I2 node 2  262654  597.768673      985.497220       385.0  28718.0
 I2 node 3  262654  653.136004      1307.712703        0.0  35160.0

 I3 node 0  262654  713.276154      1326.528027      348.0  35234.0
 I3 node 1  262654  643.686428      991.538912       402.0  27901.0
 I3 node 2  262654  543.450037      642.268819       146.0  20078.0
 I3 node 3  262654  437.846482      285.729297         0.0  11245.0

 S2 node 0  262397  824.093522      114.323518       355.0  4059.0
 S2 node 1  262397  1045.122974     2304.963779      356.0  43689.0
 S2 node 2  262397  984.471960      203.090760       502.0  7503.0
 S2 node 3  262397  962.846100      200.815825         0.0  3718.0

 S3 node 0  262397  1826.824590     1245.971444      592.0  10583.0
 S3 node 1  262397  2967.237190     1755.901765        0.0  11595.0
 S3 node 2  262397  1955.551447     712.041492       500.0  4588.0
 S3 node 3  262397  1372.001936     306.000160         0.0  6501.0
- MAR 2005 dose PNG image
- MAR I3 dose PNG image
- MAR S3 dose PNG image
- TOTAL JUL 1999 - MAR 2005 dose PNG image
- TOTAL I3 dose PNG image
- TOTAL S3 dose PNG image
