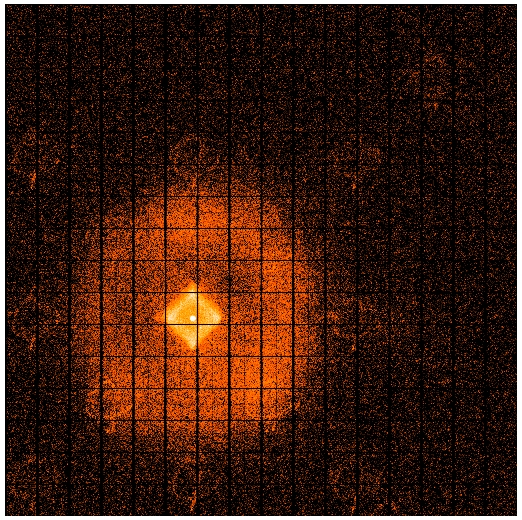
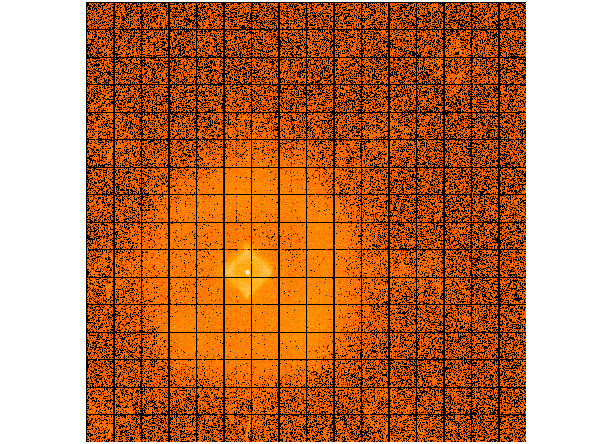
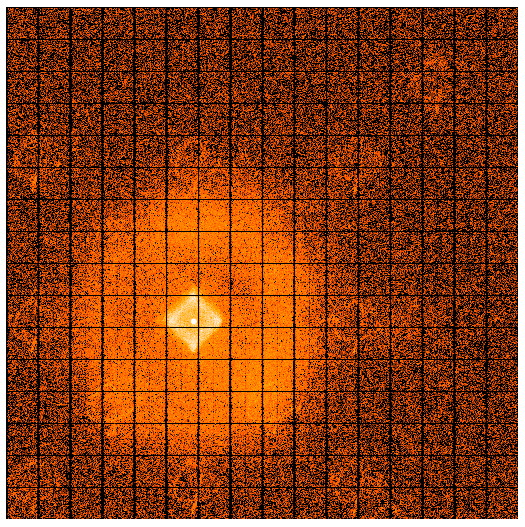
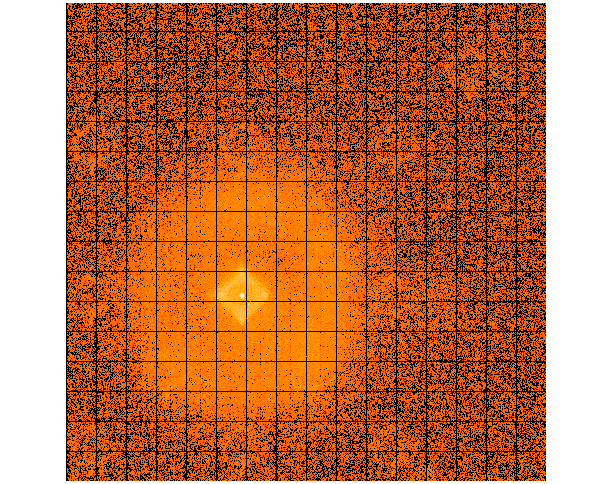
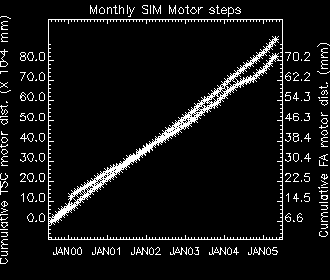
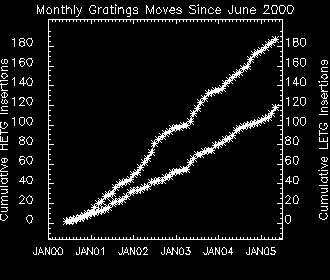
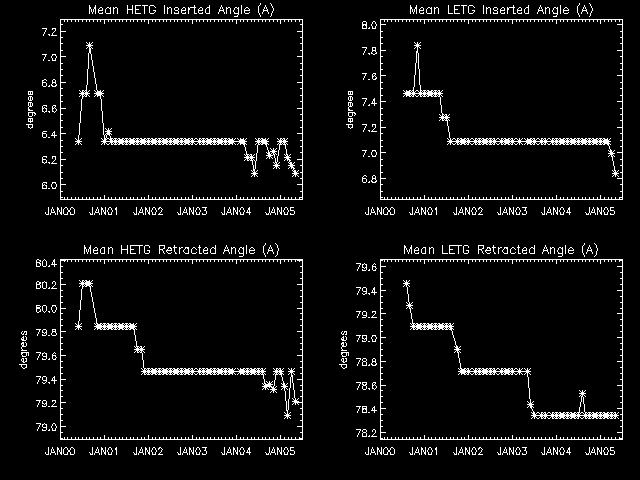
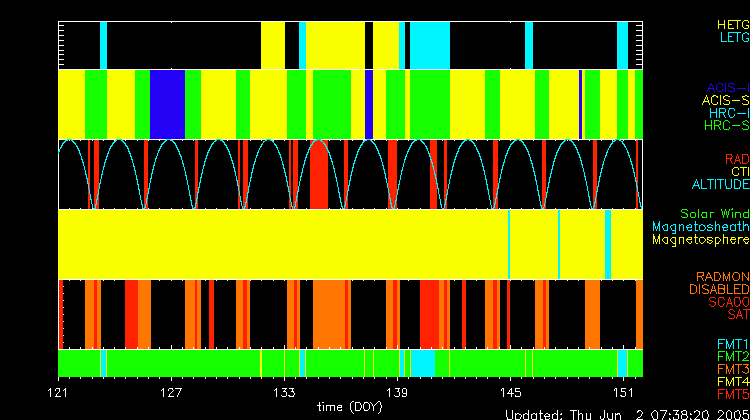
Configuration/Radiation Overview for May 2005
ACIS
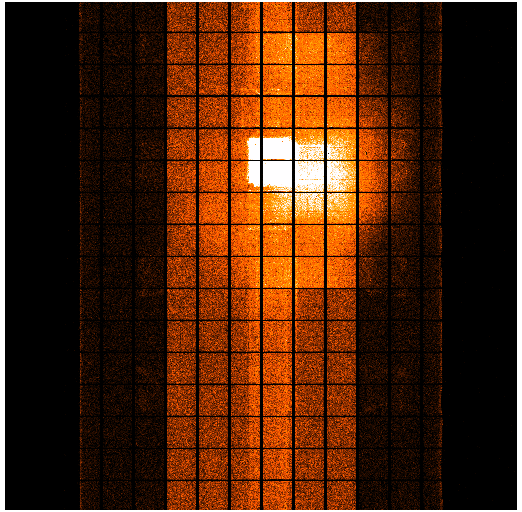
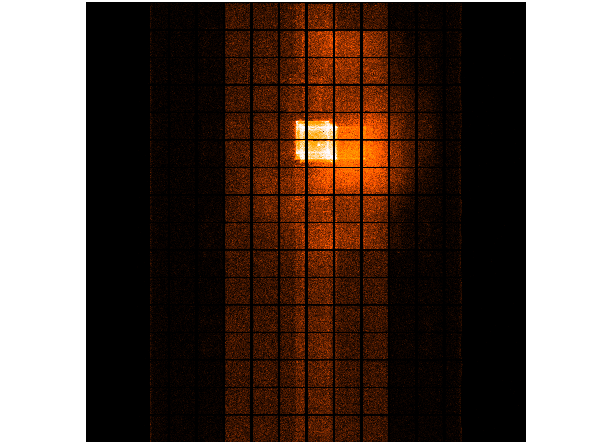
- ACIS DOSE registered-photon-map
- Level 1 Event files for a specified month are obtained from archive.
- Image data including I2, I3, S2, S3 CCDs are extracted from all event files.
- All the extracted image data were merged to create a month long exposure map for the month.
- The exposure map is opened with ds9, and check a distribution of count rates against energy. From this, estimate the upper threshold value. Any events beyond this upper threshold are assumed erroneous events such as bad pixels.
- Using this upper threshold, the data is filtered, and create a cleaned exposure map for the month.
- The exposure map from each month from the Jul 1999 is added up to create a cumulative exposure map for each month.
- Using fimgstatistic, we compute count rate statistics for each CCDs.
- For observations with high data drop rates (e.g., Crab nebula, Cas A), we corrected the observations by adding events.
- MAY registered-photon-map in fits
Statistics:
# IMAGE     NPIX      MEAN           RMS               MIN   MAX
ACIS_may05 6004901    8.3103        10.806             0.0   536.0


 I2 node 0  262654   8.195797         3.256071        1.0     32.0
 I2 node 1  262654   8.932684         3.741746        1.0    194.0
 I2 node 2  262654   9.333925         3.748835        1.0     74.0
 I2 node 3  262654   9.941272         4.355715        0.0     46.0

 I3 node 0  262654   13.143348        10.788586       0.0    166.0
 I3 node 1  262654   10.889546        7.422388        0.0    148.0
 I3 node 2  262654   8.795739         3.396006        0.0     30.0
 I3 node 3  262654   8.297349         3.290762        0.0    150.0

 S2 node 0  262654   10.320944        3.566140        1.0     55.0
 S2 node 1  262654   10.434498        4.068188        1.0     65.0
 S2 node 2  262654   10.927431        3.943949        1.0    107.0
 S2 node 3  262654   10.414381        3.466320        1.0    189.0

 S3 node 0  262654   12.936254        5.605964        1.0    186.0
 S3 node 1  262654   15.141028        9.336474        1.0    239.0
 S3 node 2  262654   13.511236        4.061499        1.0    112.0
 S3 node 3  262654   12.721570        4.056302        1.0     41.0
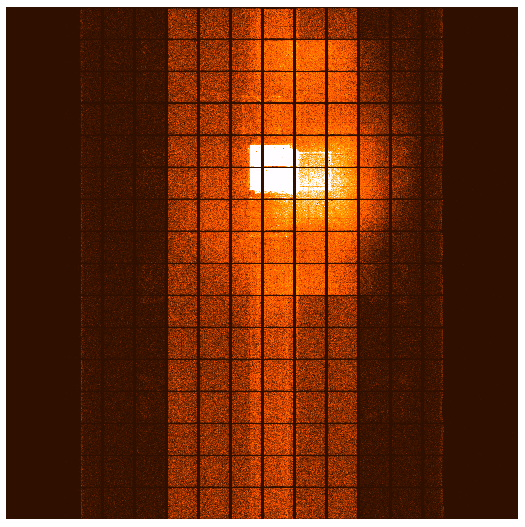
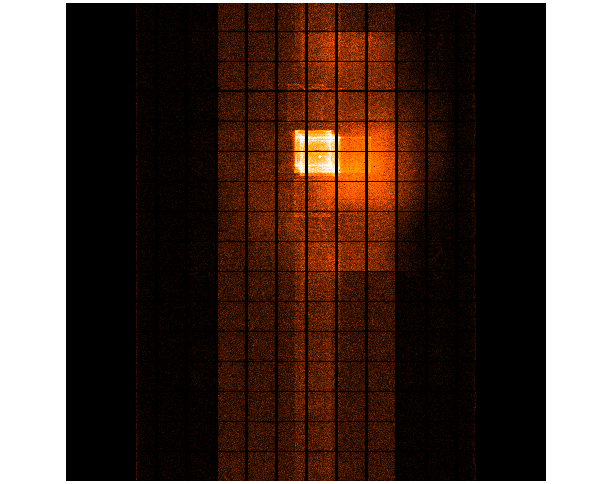
- July 1999 - May 2005 registered-photon-map in fits
Statistics:
 IMAGE        NPIX      MEAN          RMS              MIN    MAX
 ACIS_total 6004901   764.270       1098.710           0.0  44775.0

 I2 node 0  262654   514.058793       85.072200       92.0    1884.0
 I2 node 1  262654   540.863577       118.733428      109.0   1947.0
 I2 node 2  262654   545.086159       92.435821       113.0   1766.0
 I2 node 3  262654   545.044513       119.853209      108.0   2506.0

 I3 node 0  262654   589.770412       142.865619      0.0     3008.0
 I3 node 1  262654   609.548775       395.696953      0.0    10954.0
 I3 node 2  262654   544.755184       85.188685       0.0     1913.0
 I3 node 3  262654   539.024317       93.615396       0.0    10024.0

 S2 node 0  262654   845.878749       106.060154      371.0   2624.0
 S2 node 1  262654   889.373312       177.118101      374.0   4266.0
 S2 node 2  262654   1017.673993      210.541223      527.0   7697.0
 S2 node 3  262654   997.866203       176.342933      378.0   4132.0

 S3 node 0  262654   1768.243896      1017.813255     599.0   8868.0
 S3 node 1  262654   2877.071921      1564.836451     1.0     9865.0
 S3 node 2  262654   1967.122277      700.375371      511.0   4580.0
 S3 node 3  262654   1405.901045      259.133375      646.0   3427.0
- MAY 2005 dose PNG image
- MAY I3 dose PNG image
- MAY S3 dose PNG image
- TOTAL JUL 1999 - MAY 2005 dose PNG image
- TOTAL I3 dose PNG image
- TOTAL S3 dose PNG image
We updated ACIS cumulative dose map from this month. The steps we took to compute a new dose map are;
Please check more detail plots at Telemetered Photon Dose Trend page.
- Integrated Exposure Maps of Last 12 Months
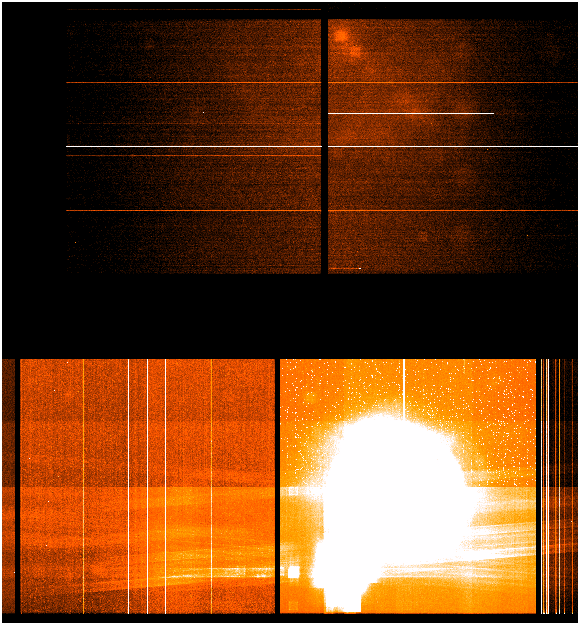
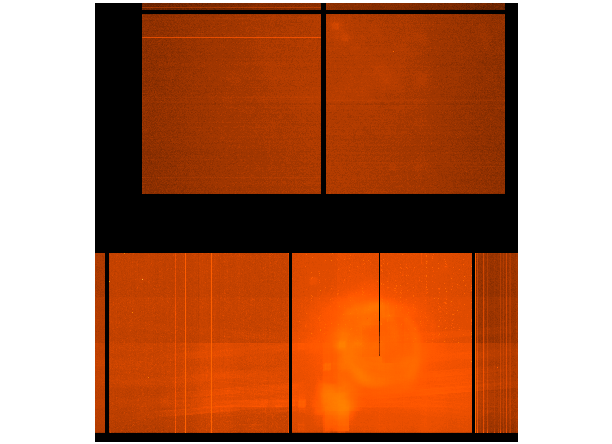
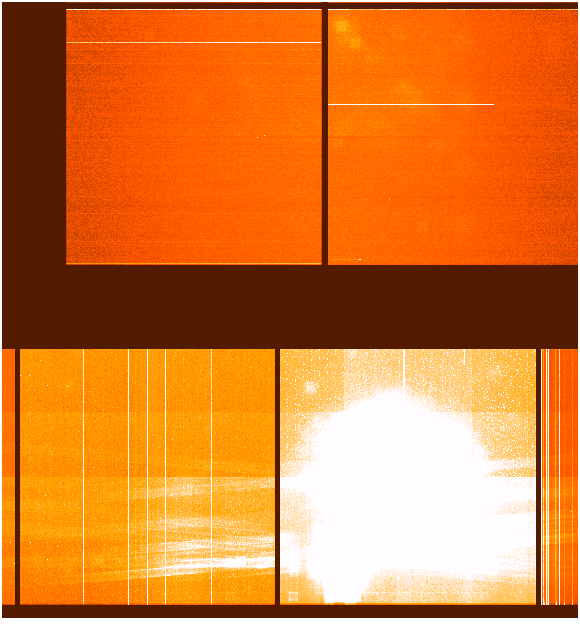
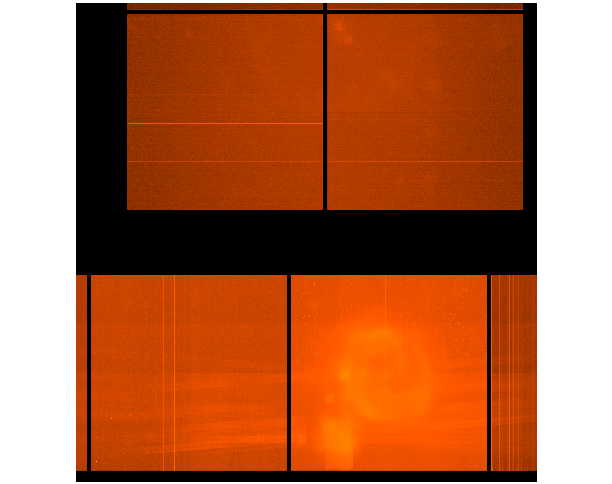
Feb 2005 Nov 2004 Aug 2004 May 2004
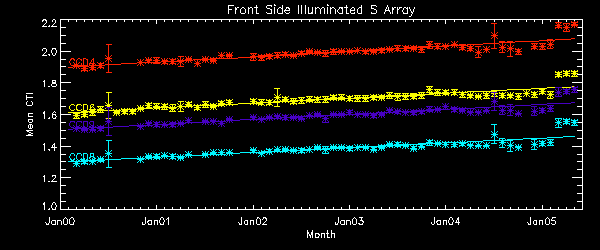
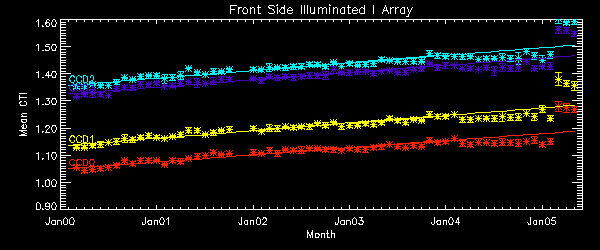
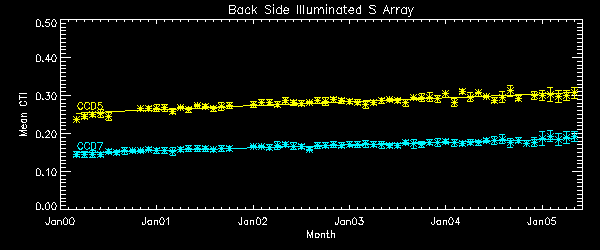
- The Mean Detrended CTI
We report CTIs with a refined data definition. CTIs were computed for the temperature dependency corrected data. Please see new CTI page for detailed explanation. CTI's are computed for Mn K alpha, and defined as slope/intercept x10^4 of row # vs ADU. Data file here
- Focal Plane Temperature
       The Mean (max) FPT: -117.93      std dev: 1.77
               mean width:    0.58 days std dev: 0.32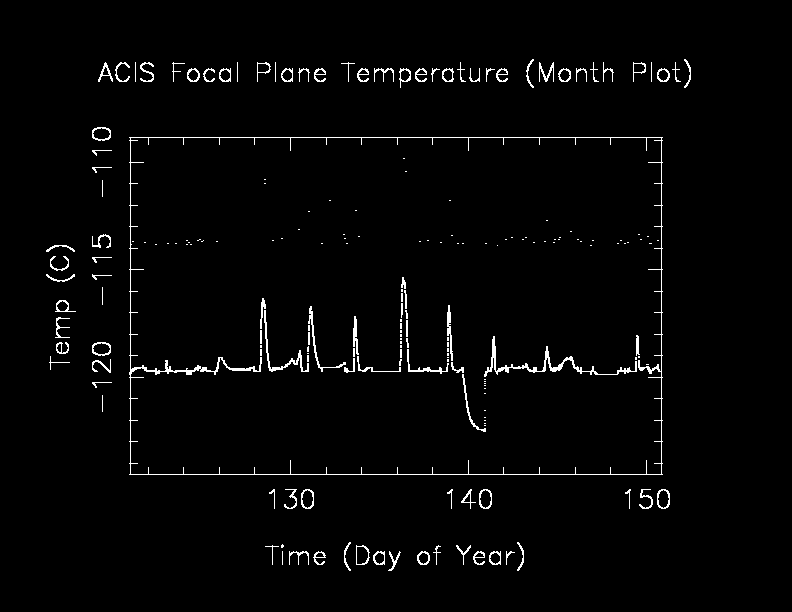
We are using 10 period moving averages to show trends of peak temperatures and peak widths. Note, the gaps in the width plot are due to missing/corrupted data.
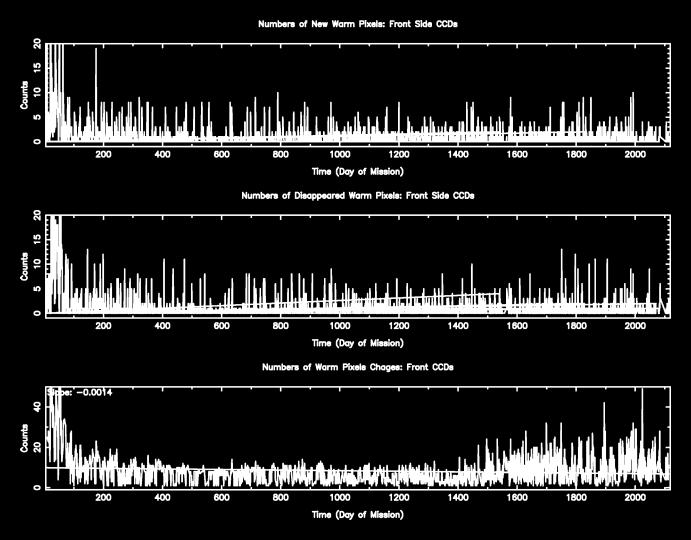
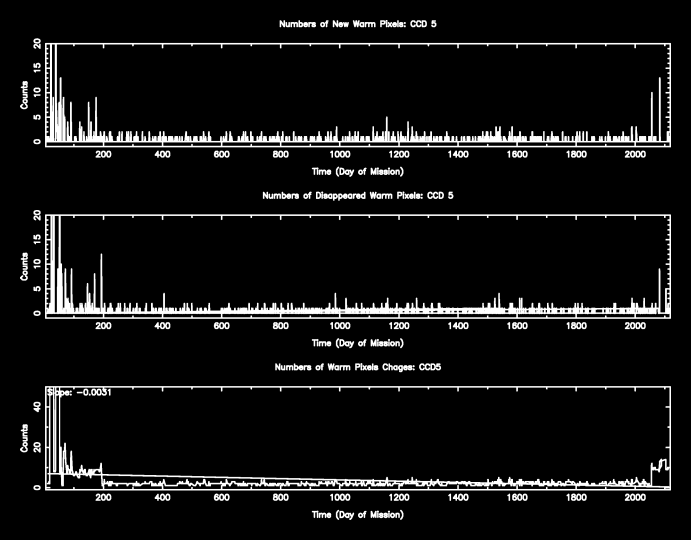
- Bad Pixels
The plots below were generated with a new warm pixel finding script. Please see Acis Bad Pixel Page for details.
Front Side CCDs
Back Side CCD (CCD5)
-
Acis Count Rate Plot
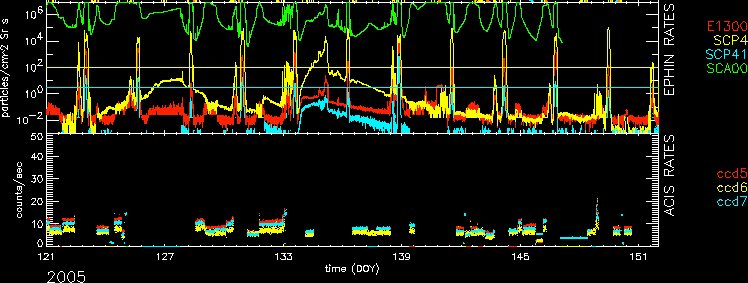
This monitors the ACIS count Rate vs. EPHIN count Rate.
No sources or CTI observations are removed. For daily updates see: Ephin/Acis Info - Science instrument background rates
This page shows scientific instrument background data based on Acis observations. A source region file is generated using get_srcregions and then the input event file is filtered using the regions in that file to remove the sources.
Name Low (keV) Hight(KeV) Description SSoft 0.00 0.50 Super soft photons Soft 0.50 1.00 Soft photons Med 1.00 3.00 Moderate energy photons Hard 3.00 5.00 Hard Photons Harder 5.00 10.00 Very Hard photons Hardest 10.00 Beyond 10 keV
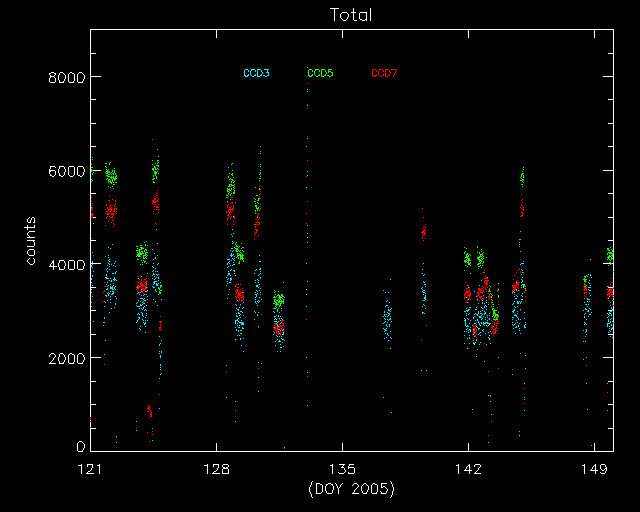
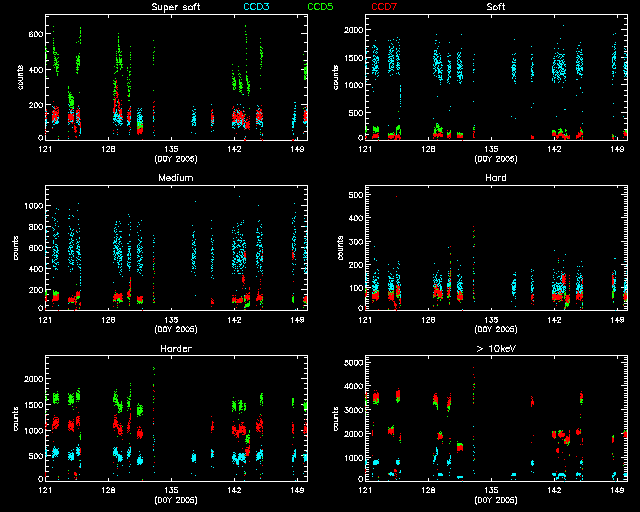
The following three plots show trends of SIB from year 2000. CCDs shown here are CCD3, CCD5, and CCD7. Fitted lines are linear fit after eliminating extreme outliers. For >10 keV plots, 2 lines are fit. One is with a 13 keV filter, and another without.
CCD 3
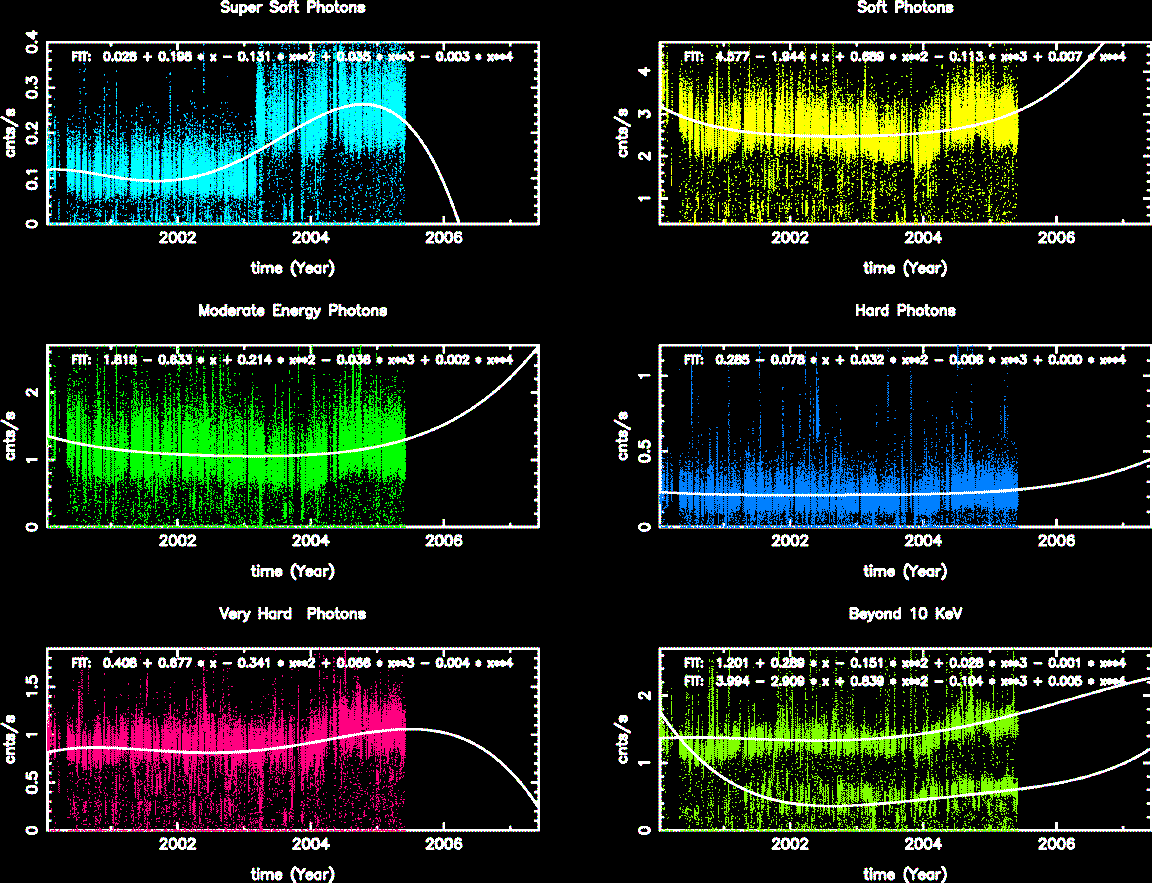
CCD 5
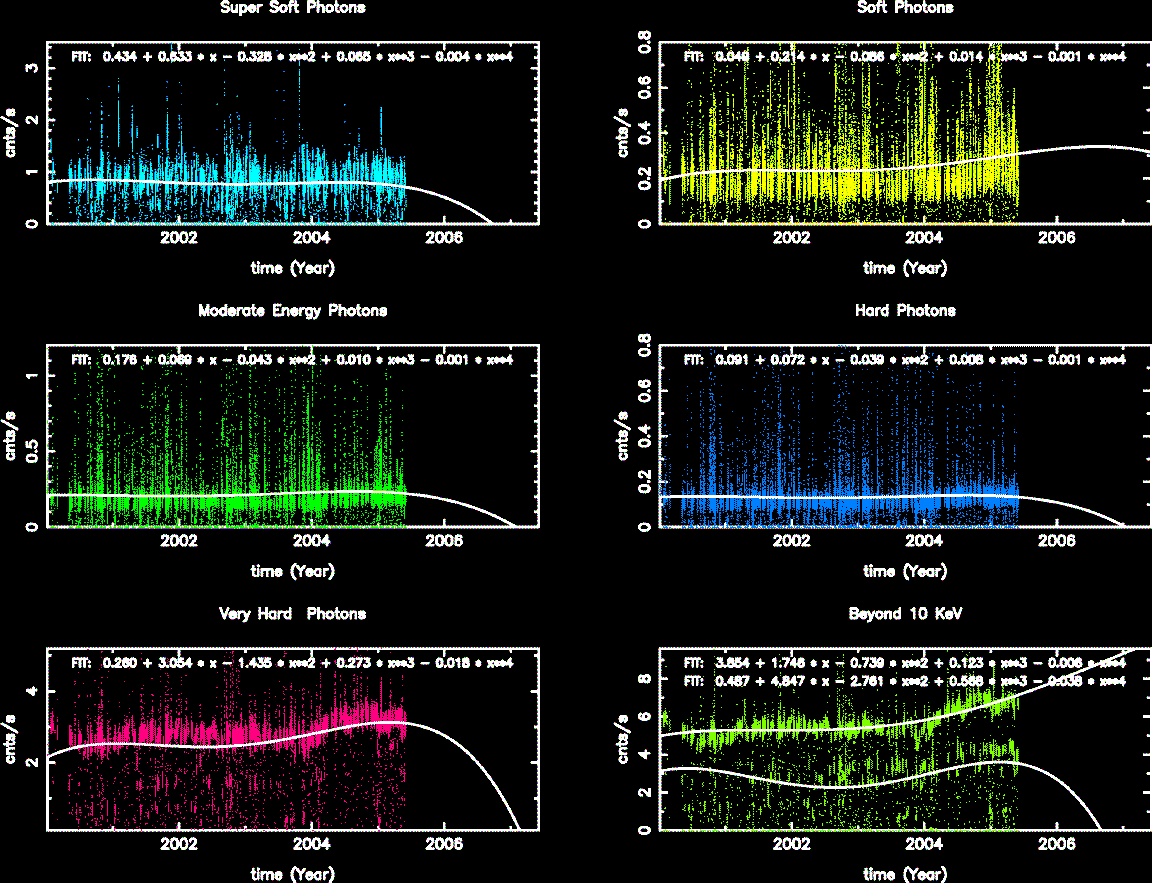
CCD 7
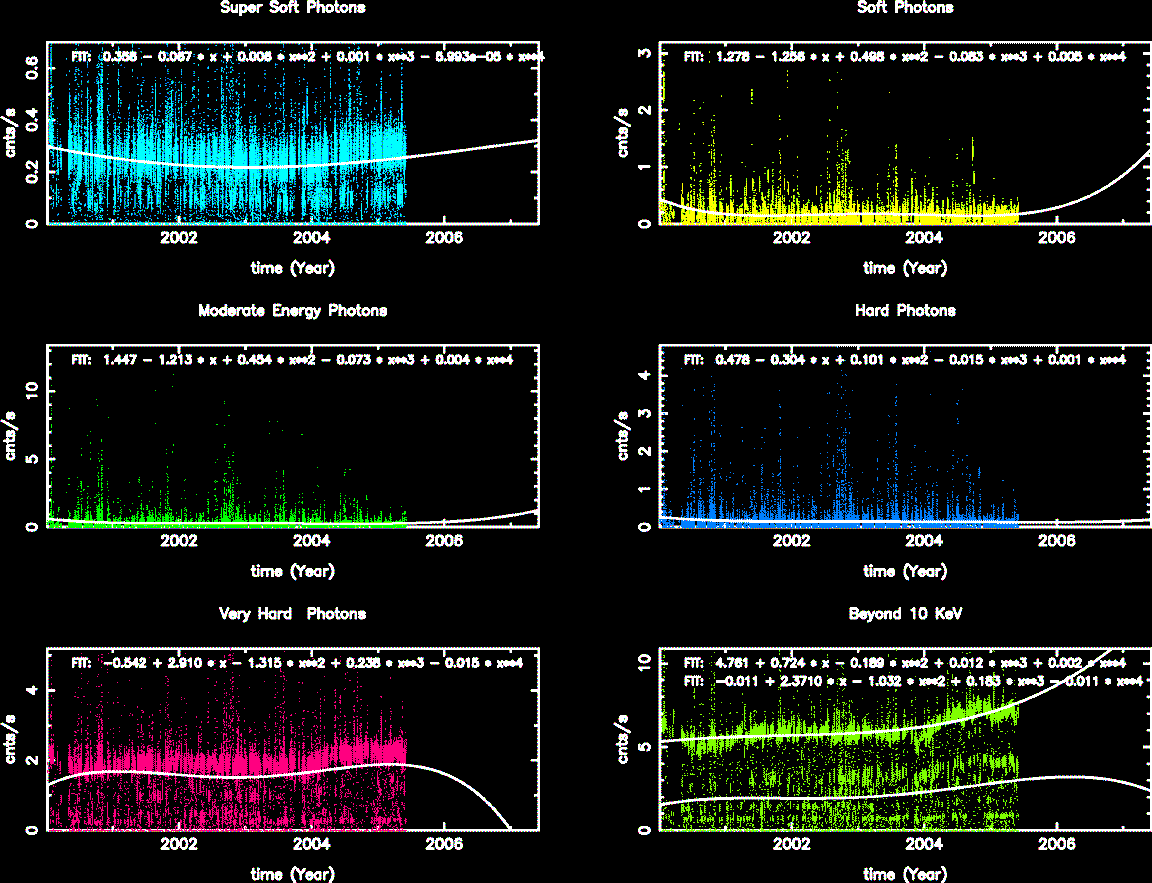
- ACIS Corner Pixels
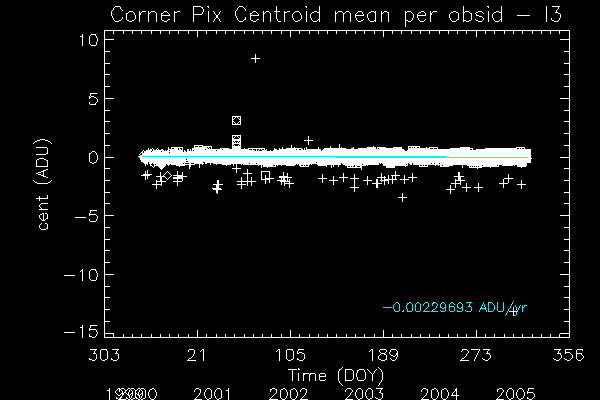
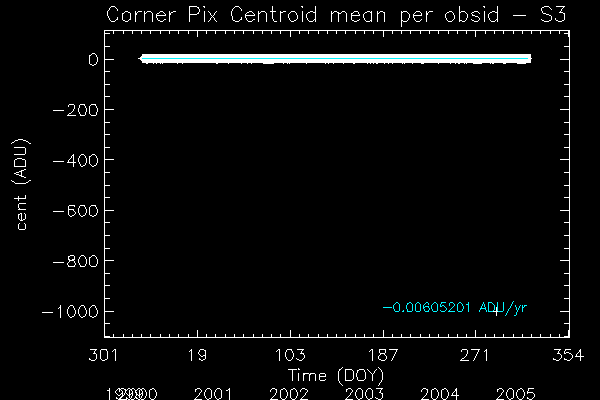
We plot the average corner pixel centroid slope and mean for ACIS observations. Separate plots are shown for FAINT MODE (3X3) and VFAINT MODE (5X5) observations. Metric is the centroid of a gaussian fit to the histogram of corner pixel PHA values of detected events. Plus signs are FAINT observations, diamonds are VFAINT observations, and boxes are VFAINT observations with centroids computed using only the corner pixels of a 3X3 event island (referred to as AFAINT). We see a very small upward trend.I3
S3
- ACIS Bias Trends
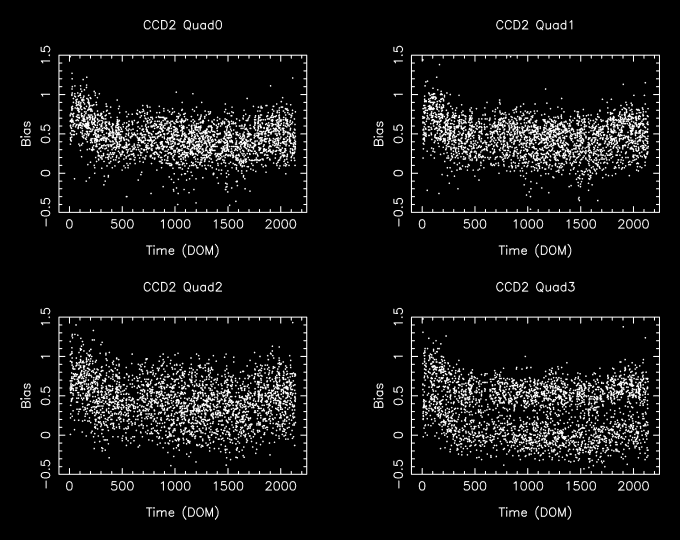
The bias plus overclock level was calculated as follows:- Get acisf*bias0.fits is obtained from a database or /dsops/ap/sdp/cache/*/acis/
- Data with timed mode exposure is selected.
- Fits files were divided into 4 quads, then an average of bias level for each quad is computed. No corrections for dead spots, columns etc were included.
An example of Overclock values as reported in FITS file header: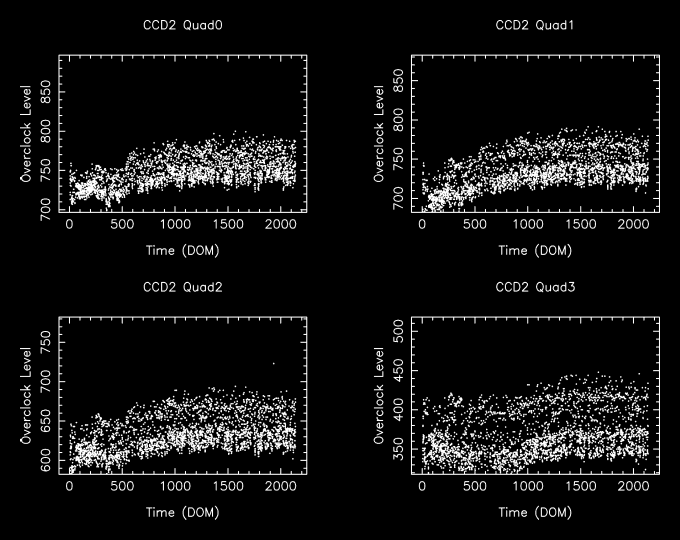
TOP
HRC
-
DOSE of central 4K pore-pairs
- MAY HRC-I dose fits image
HRCI_04_2005.fits NO DATA
- SEP 1999 - MAY 2005 HRC-I dose fits image
        IMAGE                NPIX      MEAN    STDDEV      MIN       MAX
HRCI_08_1999_05_2005.fits  16777216  1.7953    2.9595      0.0       282.0
- MAY HRC-S dose fits image
        IMAGE                NPIX      MEAN    STDDEV      MIN       MAX
HRCS_05_2005.fits          16777216  0.0878    0.3364      0.0       13.0
- SEP 1999 - MAY 2005 HRC-S dose fits image
        IMAGE                NPIX     MEAN      STDDEV      MIN      MAX
HRCS_08_1999_05_2005.fits  16777216  6.2058    13.9712      0.0      1503.0
- MAY HRC-I dose PNG image (no image)
- SEP 1999 - MAY 2005 HRC-I dose PNG image
- MPR HRC-S dose PNG image
Y - SEP 1999 - MAY 2005 HRC-S dose PNG image
See Maximum Dose Trends
We display a max dose trend plot corrected for events that "pile-up" in the center of the taps due to bad position information.

From this month, we trend 10th brightest data points instead of the maximum. This makes the maximum trend values to be about 20% lower than the previous months.
