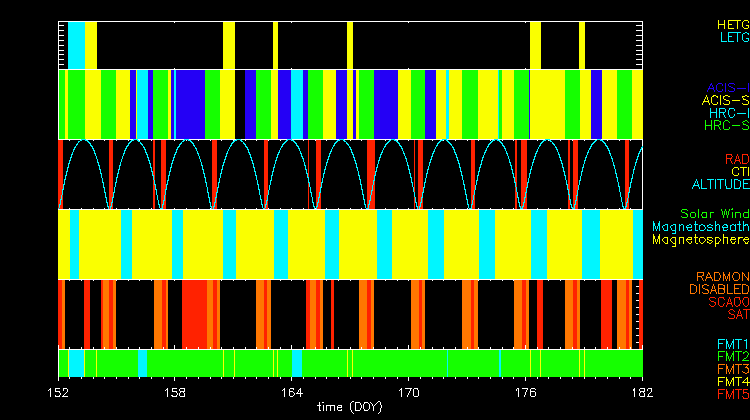

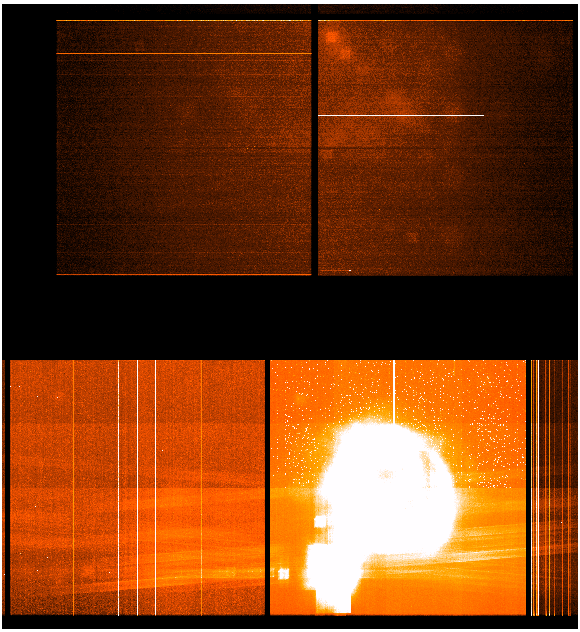
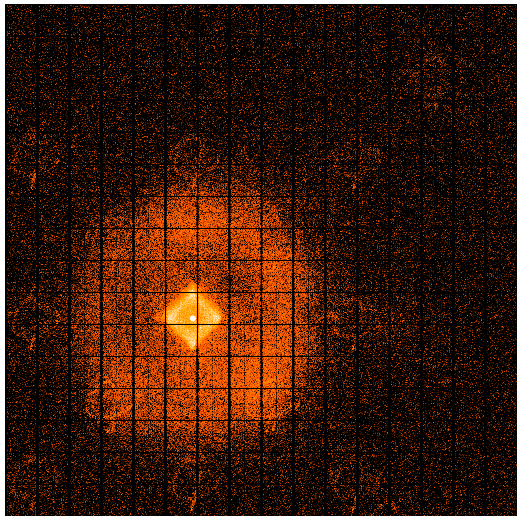
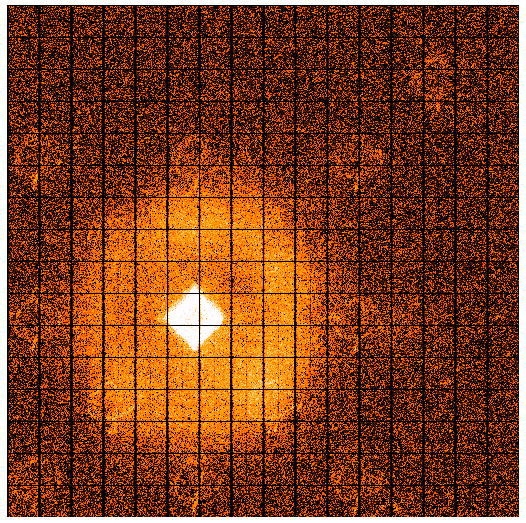
We updated ACIS cumulative dose map from this month. The steps we took to compute a new dose map are;
Please check more detail plots at Telemetered Photon Dose Trend page.
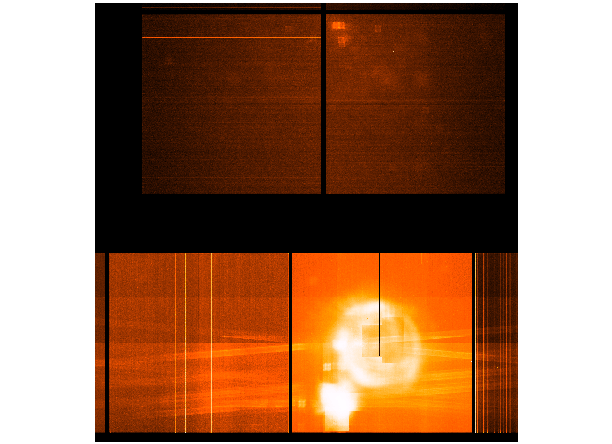
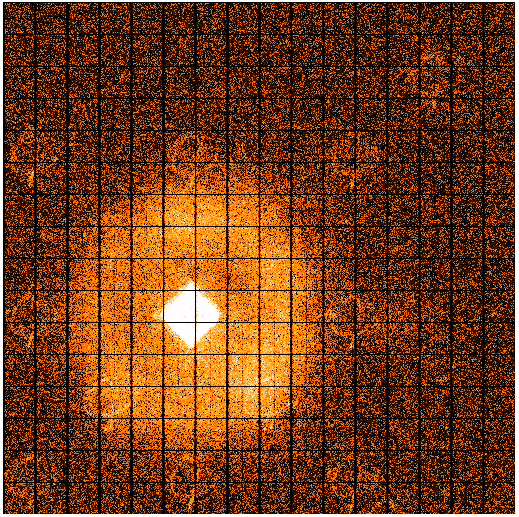
Statistics:
# IMAGE     NPIX      MEAN           RMS               MIN   MAX
ACIS_jun05 6004901    9.42697       14.3373            0.0   776.0


 I2 node 0  262654   10.776979        3.903460        0.0     48.0
 I2 node 1  262654   11.396209        4.444217        1.0     317.0
 I2 node 2  262654   11.341071        4.173585        1.0     103.0
 I2 node 3  262654   11.017602        4.340280        1.0     64.0

 I3 node 0  262654   10.929630        4.426832        0.0     59.0
 I3 node 1  262654   11.486447        9.455418        0.0     225.0
 I3 node 2  262654   10.705690        3.974513        0.0     43.0
 I3 node 3  262654   10.904798        4.349323        0.0     206.0

 S2 node 0  262654   13.314228        4.207810        1.0     320.0
 S2 node 1  262654   13.850438        4.982155        1.0     100.0
 S2 node 2  262654   14.480708        4.569456        1.0     102.0
 S2 node 3  262654   14.100410        4.290507        1.0     352.0

 S3 node 0  262654   13.706492        7.139936        1.0     134.0
 S3 node 1  262654   14.044644        6.623580        1.0     166.0
 S3 node 2  262654   13.108360        3.752383        1.0     36.0
 S3 node 3  262654   12.314941        3.610785        1.0     32.0
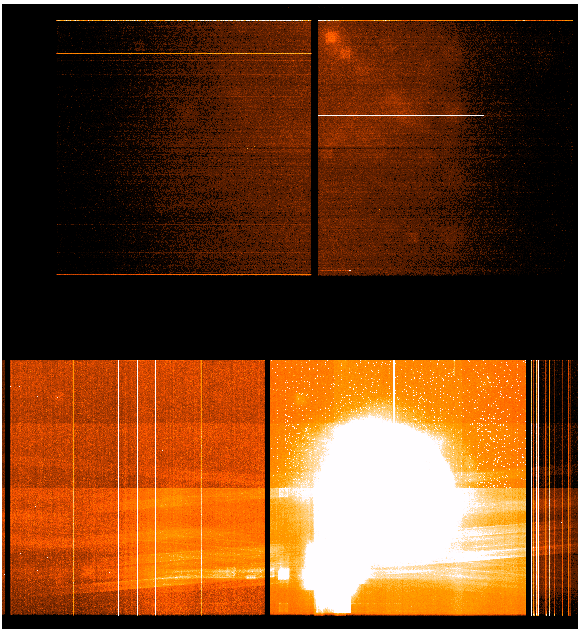
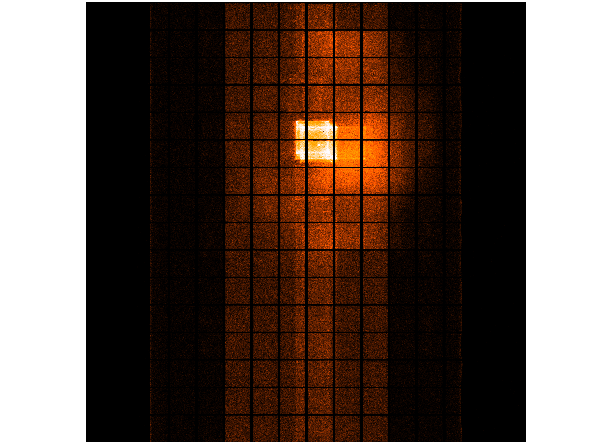
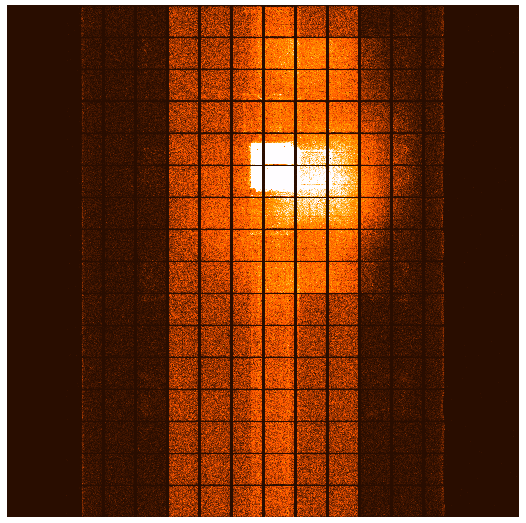
Statistics:
 IMAGE        NPIX      MEAN          RMS              MIN    MAX
ACIS_total 6004901   773.697       1109.896           0.0  45484.0

 I2 node 0  262654   524.833094       87.035468       95.0    1927.0
 I2 node 1  262654   552.257307       121.373474      110.0   1982.0
 I2 node 2  262654   556.424283       94.712762       115.0   1796.0
 I2 node 3  262654   556.059291       122.518463      108.0   2563.0

 I3 node 0  262654   600.698048       145.333804      0.0     3045.0
 I3 node 1  262654   621.032676       404.435156      0.0     11174.0
 I3 node 2  262654   555.458628       87.222496       0.0     1956.0
 I3 node 3  262654   549.926947       95.540645       0.0     10230.0

 S2 node 0  262654   859.192927       107.555697      378.0   2696.0
 S2 node 1  262654   903.223642       179.705282      379.0   4366.0
 S2 node 2  262654   1032.154645      211.343155      533.0   7768.0
 S2 node 3  262654   1015.851250      175.276630      533.0   4484.0

 S3 node 0  262654   1781.950230      1019.889358     603.0   8880.0
 S3 node 1  262654   2891.046250      1566.478466     1.0     9876.0
 S3 node 2  262654   1980.230637      700.678487      518.0   4599.0
 S3 node 3  262654   1419.470802      260.101383      654.0   3456.0
|
|
|
|
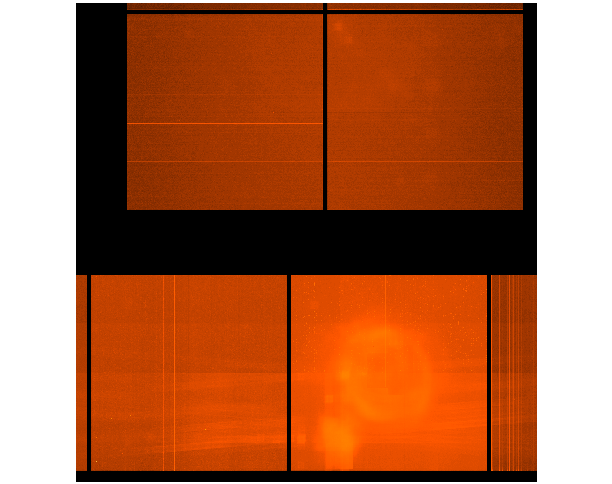
| Mar 2005 | Dec 2004 | Sep 2004 | Jun 2004 |
|---|
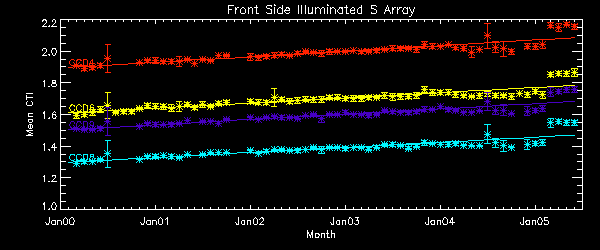
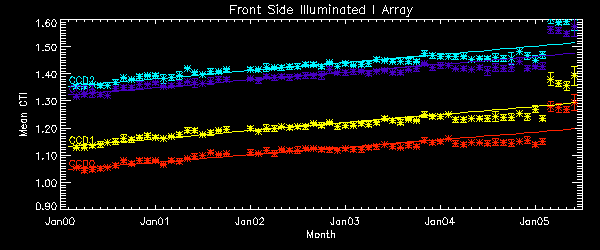
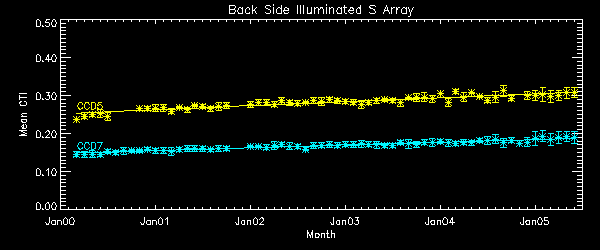
We report CTIs with a refined data definition. CTIs were computed for the temperature dependency corrected data. Please see new CTI page for detailed explanation. CTI's are computed for Mn K alpha, and defined as slope/intercept x10^4 of row # vs ADU. Data file here
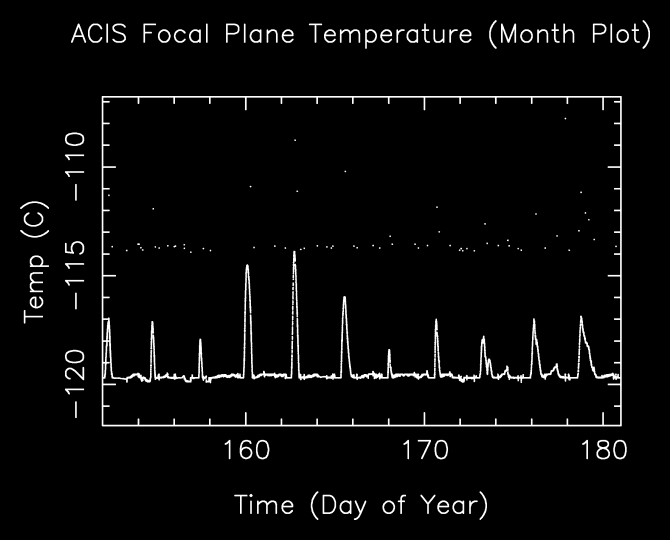
       The Mean (max) FPT: -116.95      std dev: 1.48
               mean width:    0.52 days std dev: 0.24

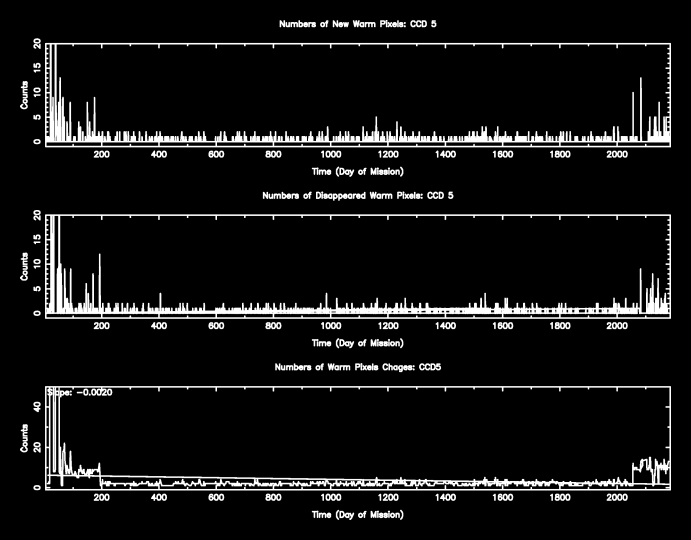
The plots below were generated with a new warm pixel finding script. Please see Acis Bad Pixel Page for details.
Front Side CCDs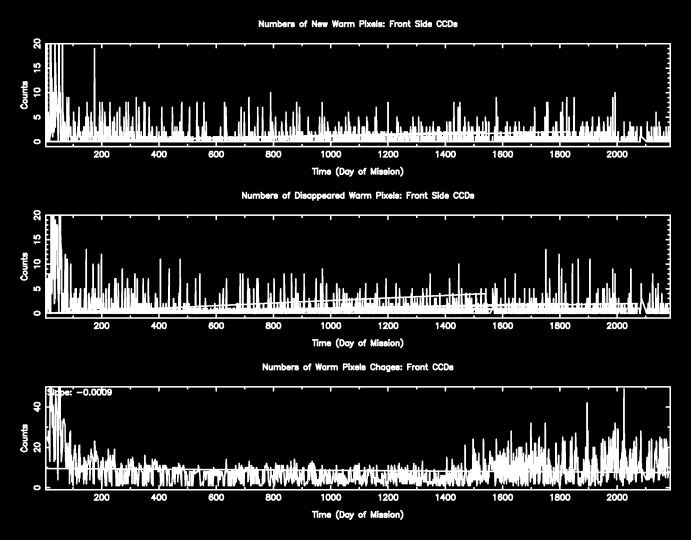
Back Side CCD (CCD5)
| Name | Low (keV) | Hight(KeV) | Description |
|---|---|---|---|
| SSoft | 0.00 | 0.50 | Super soft photons |
| Soft | 0.50 | 1.00 | Soft photons |
| Med | 1.00 | 3.00 | Moderate energy photons |
| Hard | 3.00 | 5.00 | Hard Photons |
| Harder | 5.00 | 10.00 | Very Hard photons |
| Hardest | 10.00 | Beyond 10 keV |
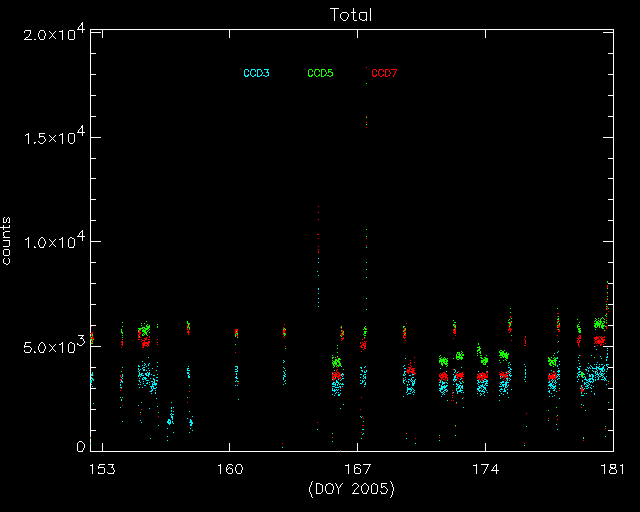
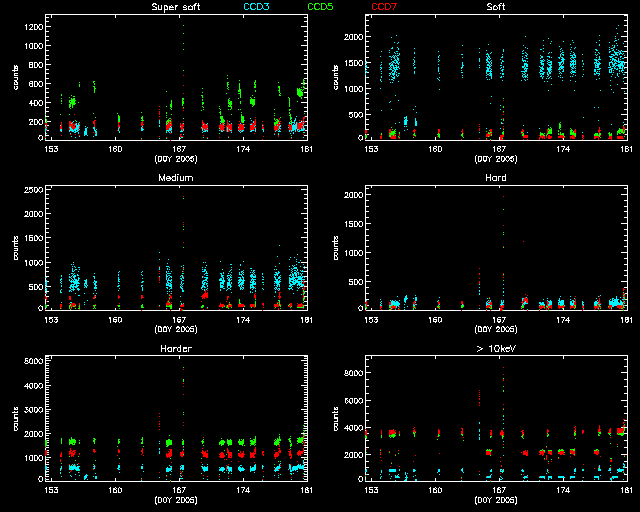
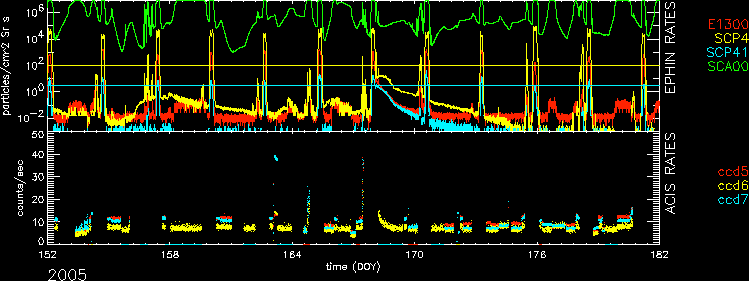
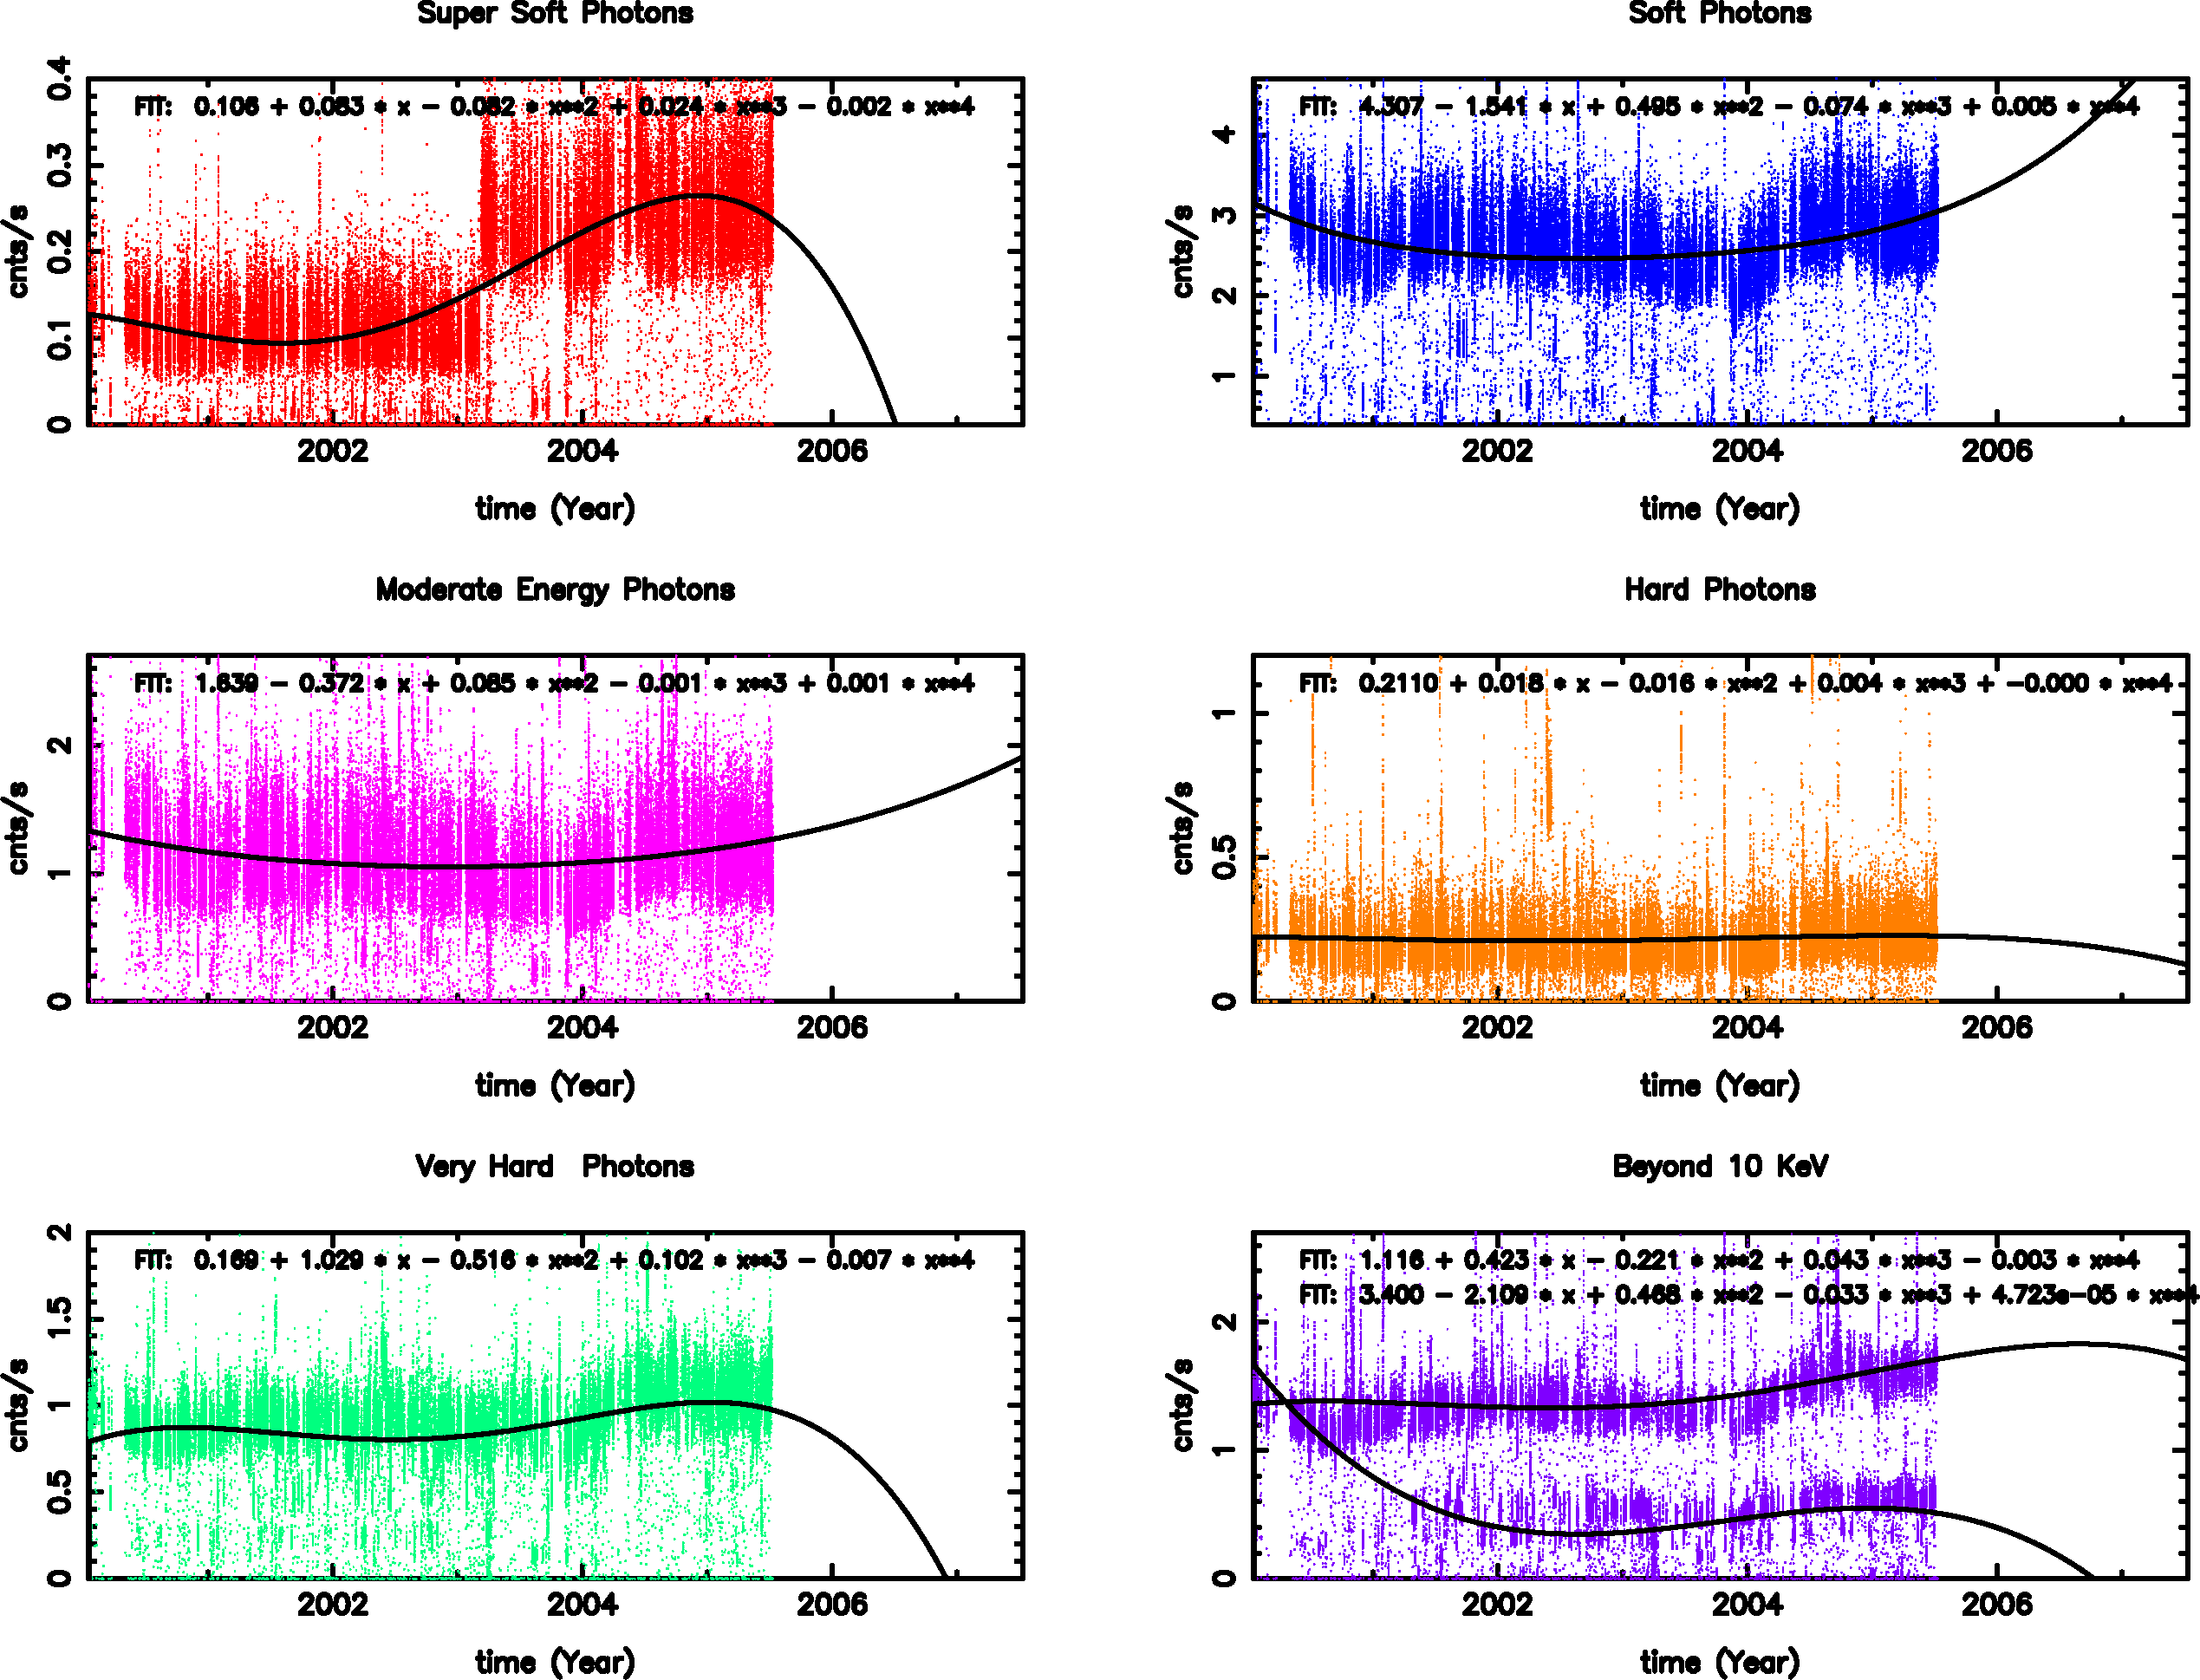
The following three plots show trends of SIB from year 2000. CCDs shown here are CCD3, CCD5, and CCD7. Fitted lines are linear fit after eliminating extreme outliers. For >10 keV plots, 2 lines are fit. One is with a 13 keV filter, and another without.
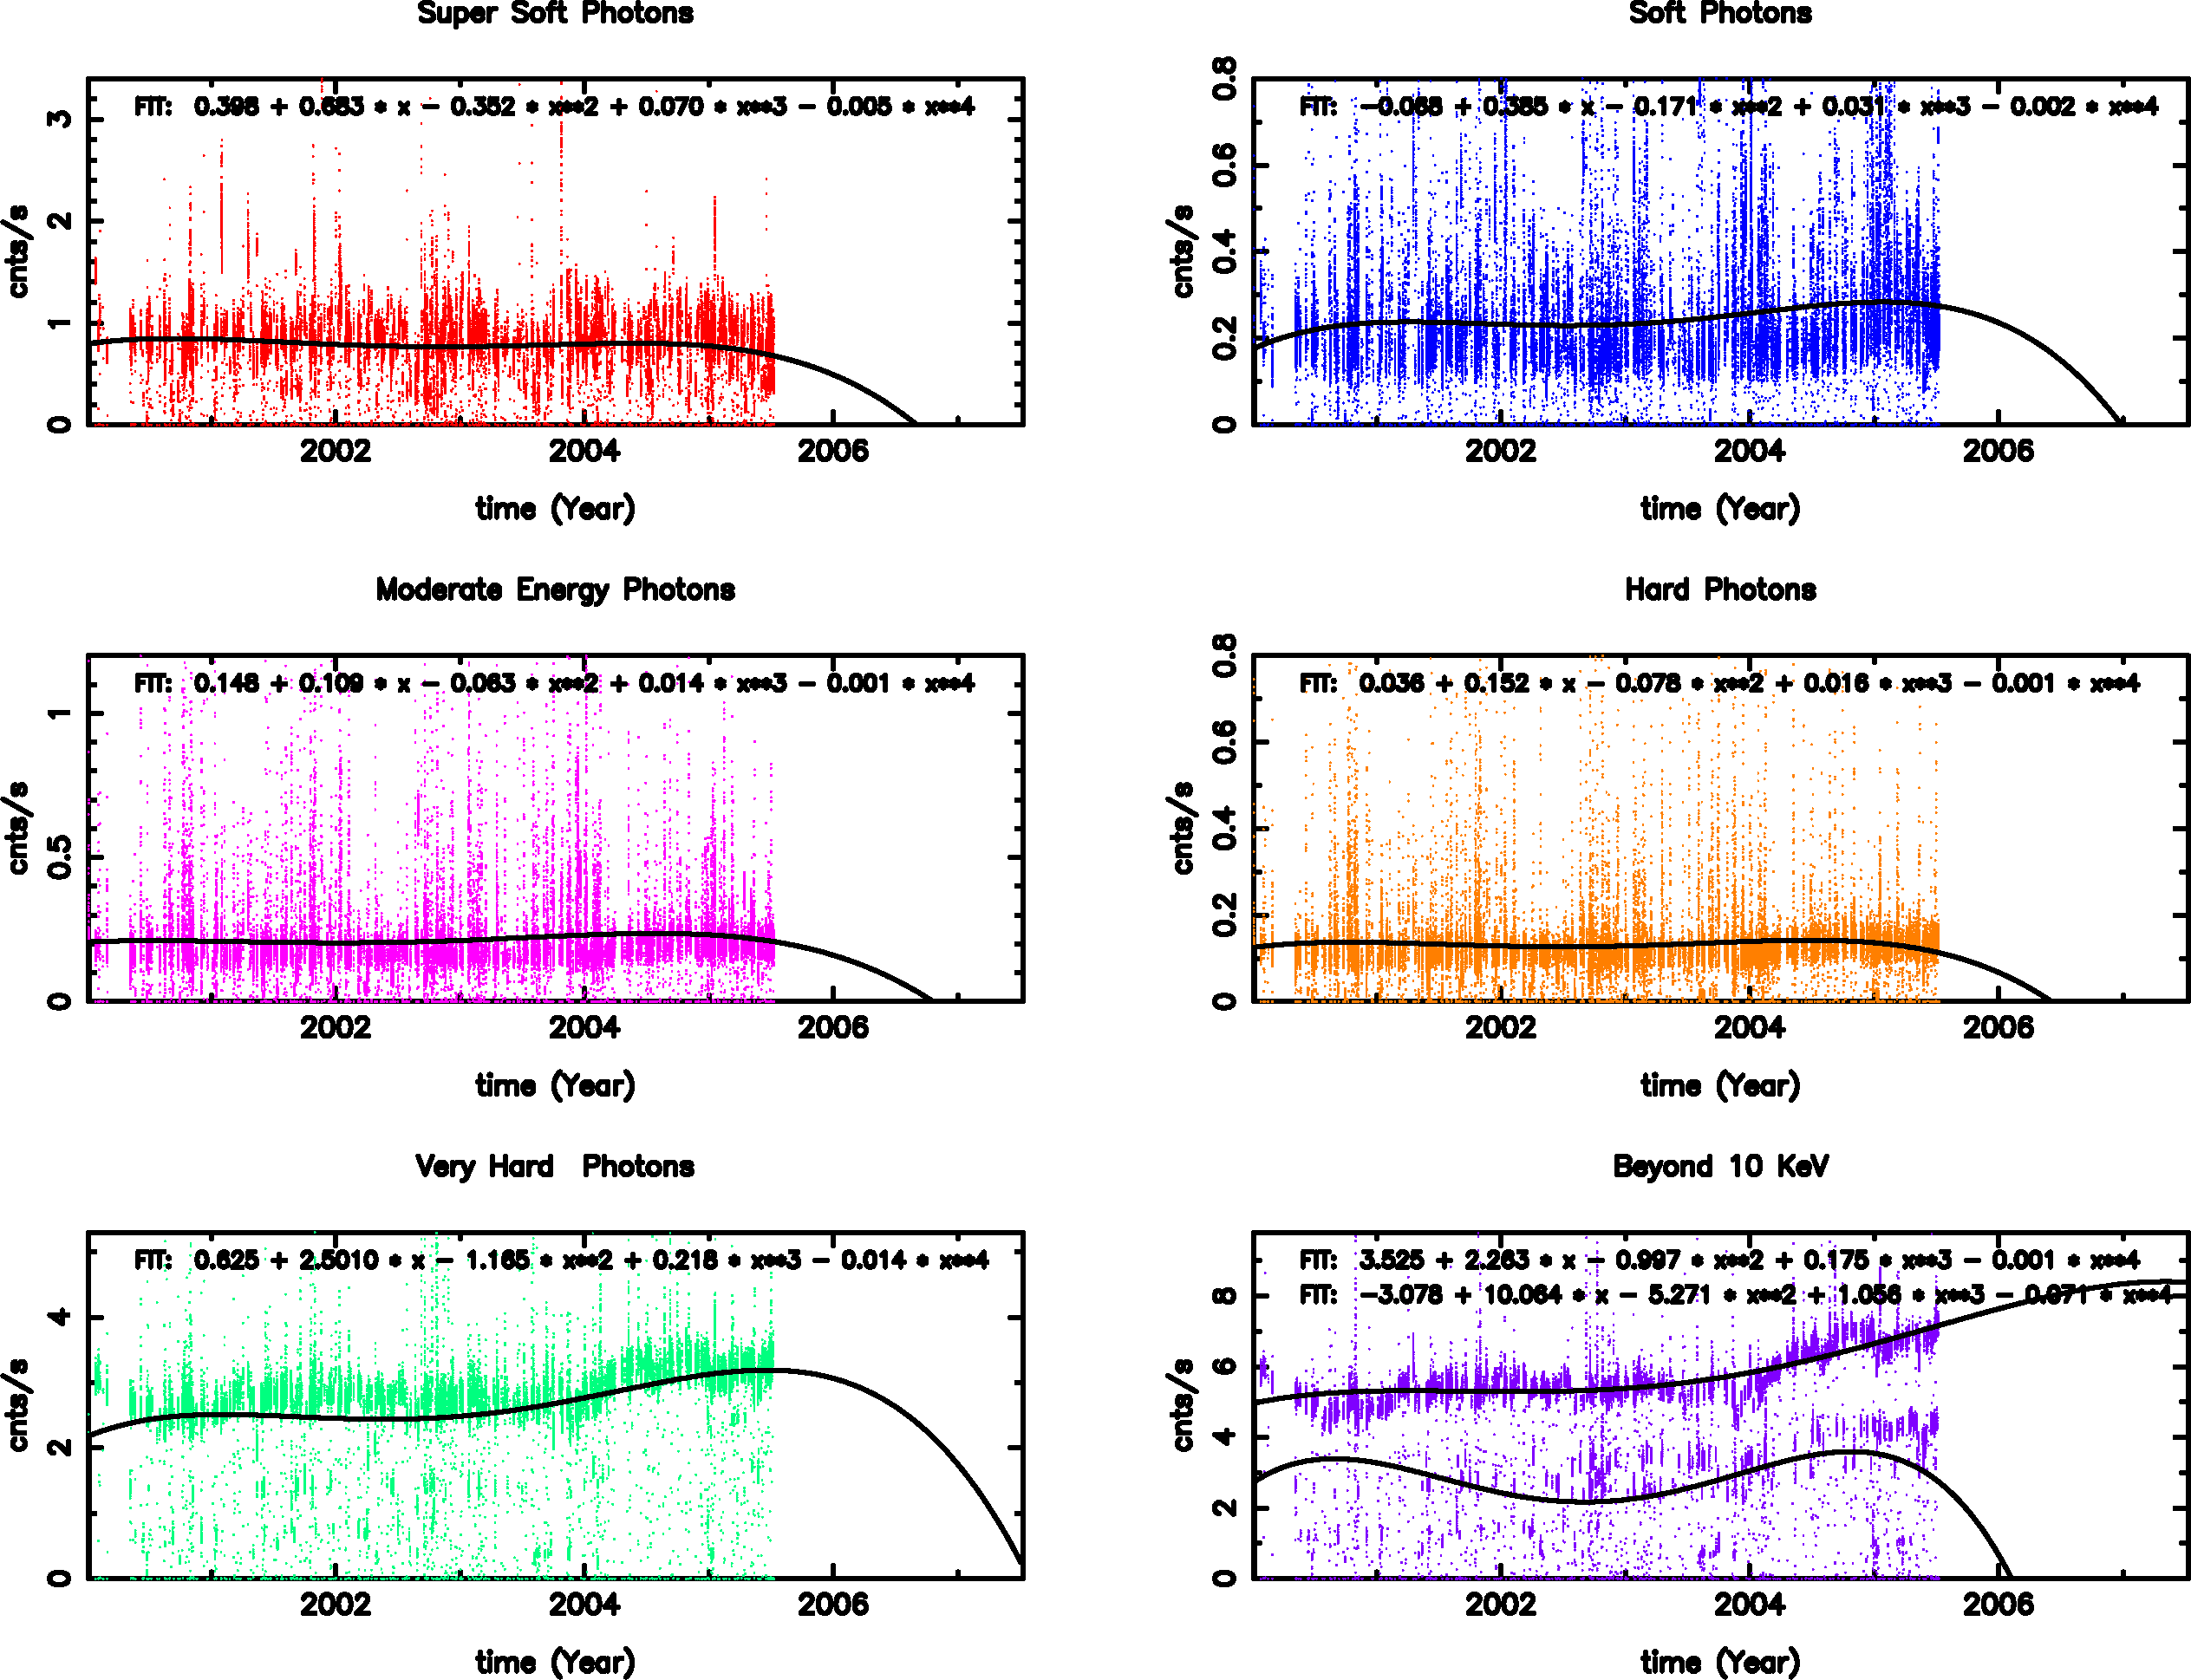
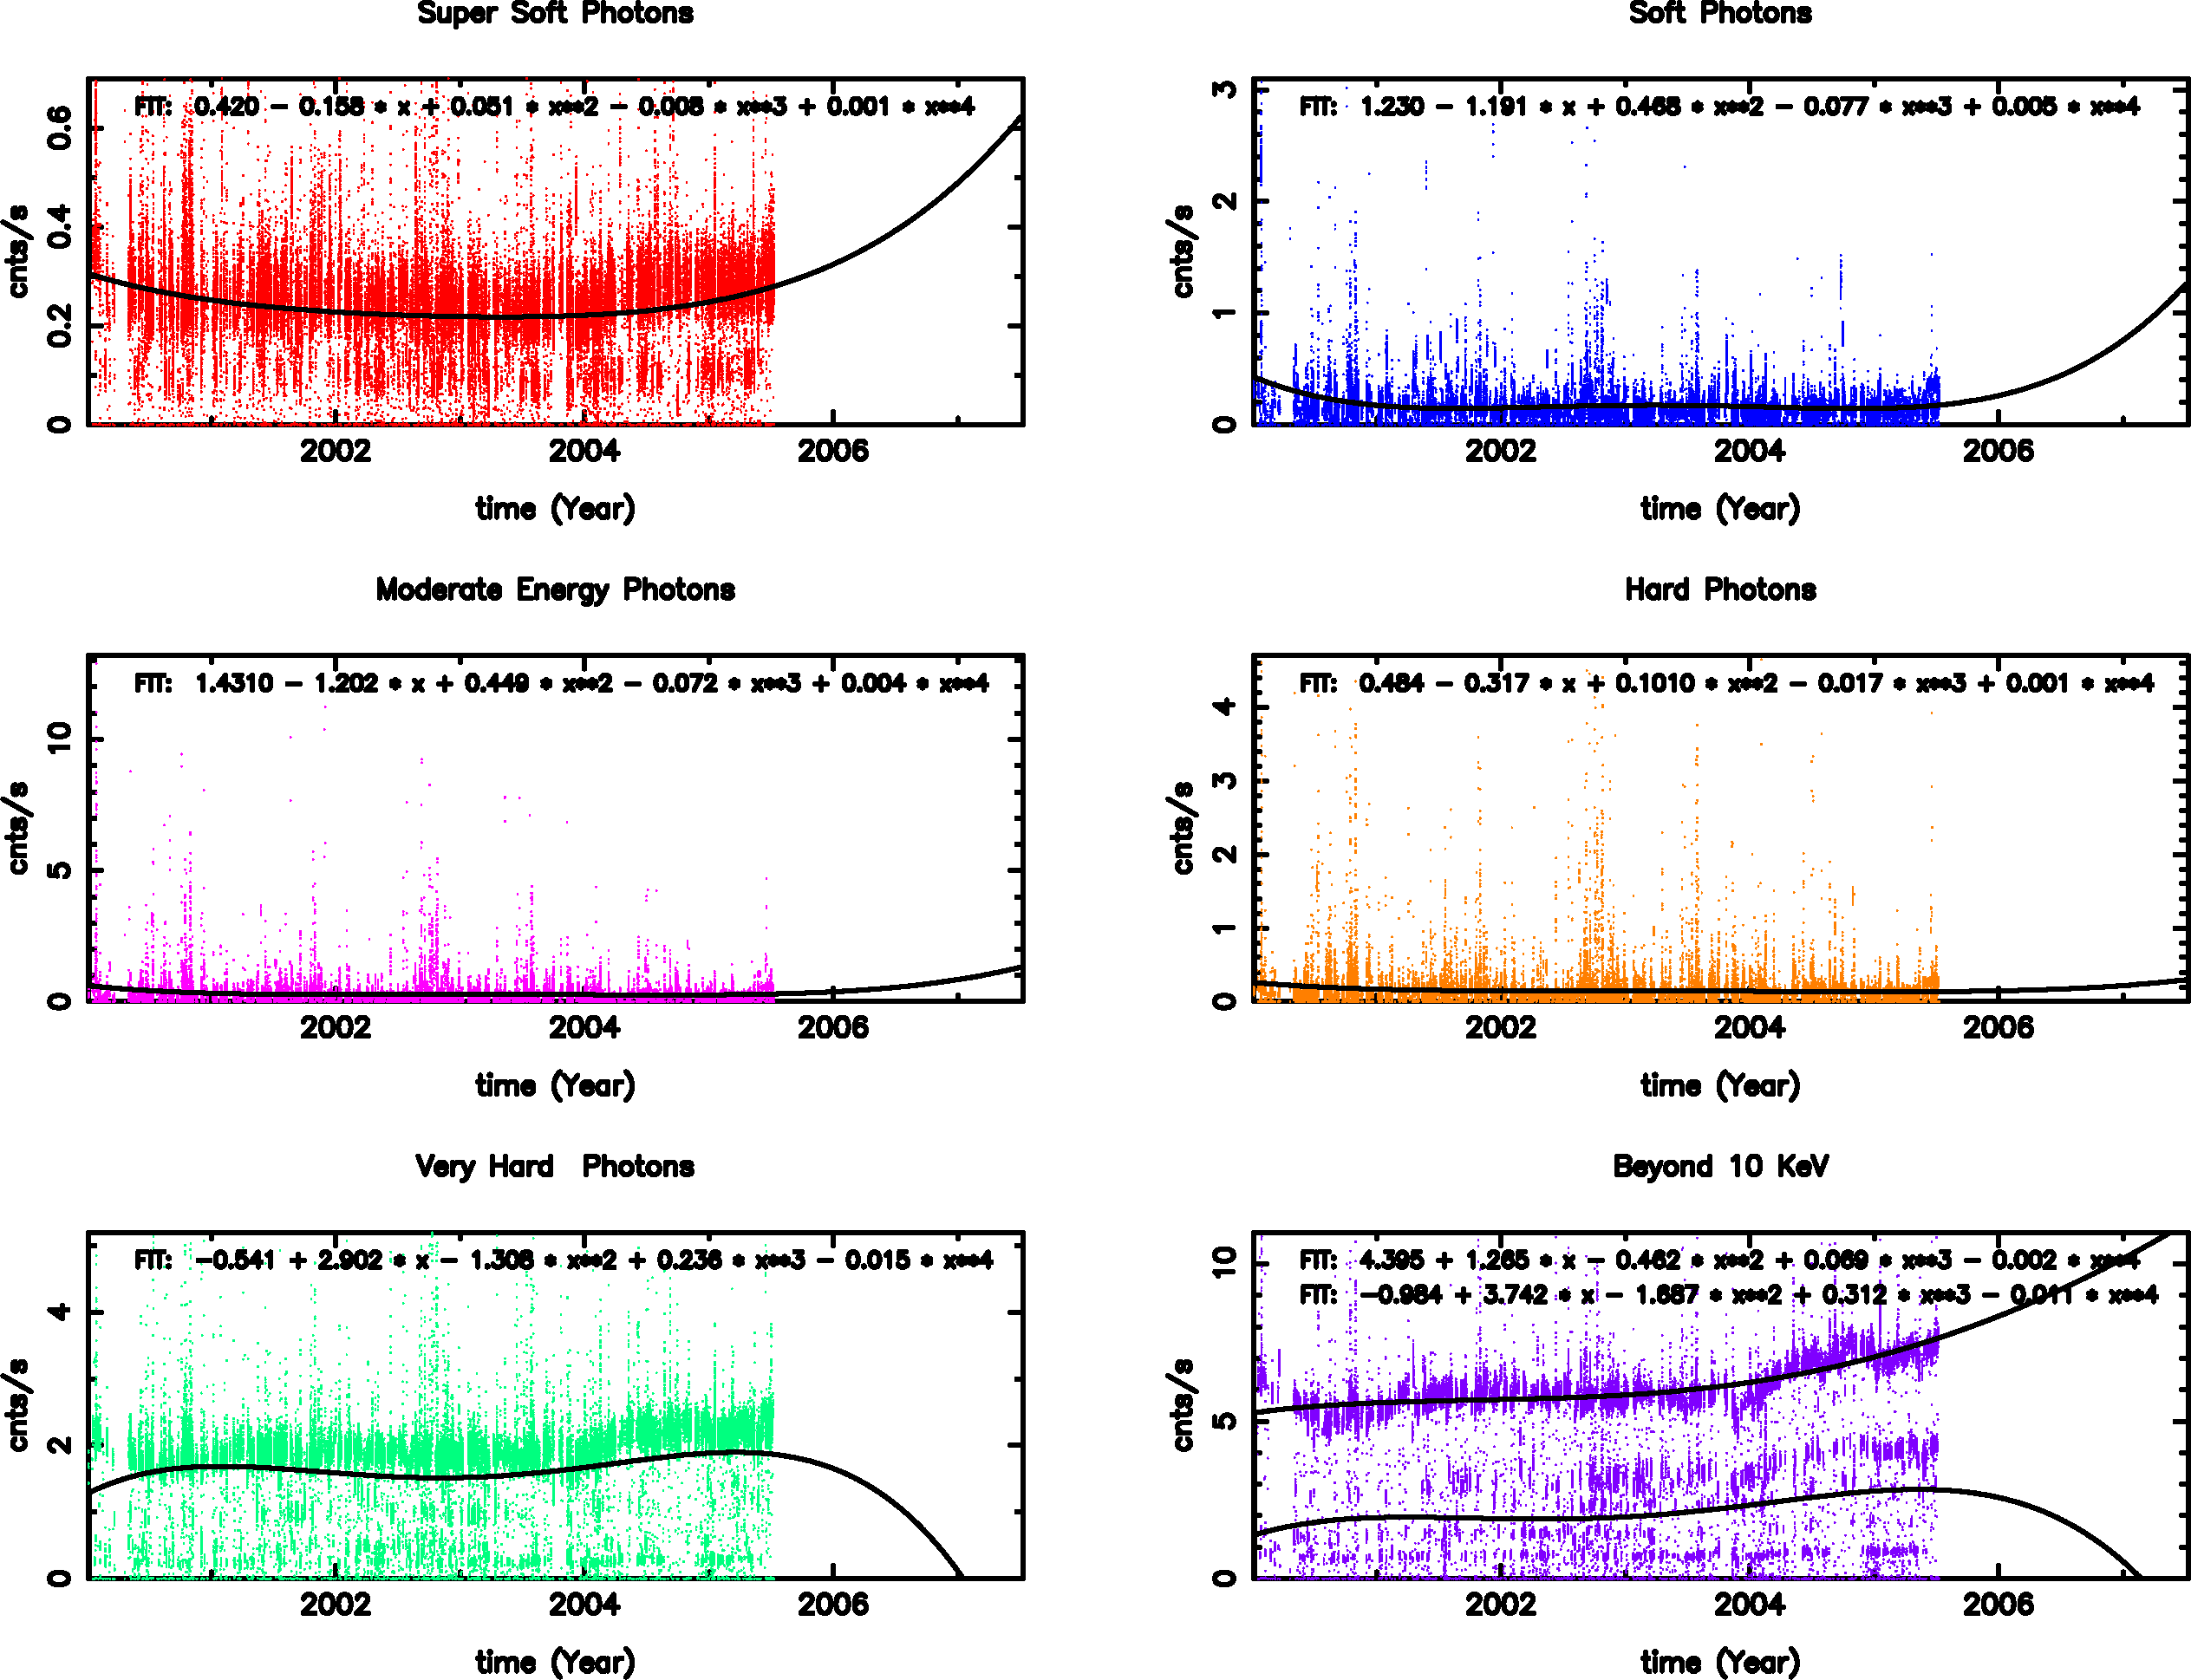
From this month, we trend 10th brightest data points instead of the maximum. This makes the maximum trend values to be about 20% lower than the previous months.
        IMAGE                NPIX      MEAN    STDDEV      MIN       MAX
HRCI_06_2005.fits          16777216  0.0333    0.2054      0.0       24.0
        IMAGE                NPIX      MEAN    STDDEV      MIN       MAX
HRCI_08_1999_06_2005.fits  16777216  1.8286    3.0079      0.0       285.0
        IMAGE                NPIX      MEAN    STDDEV      MIN       MAX
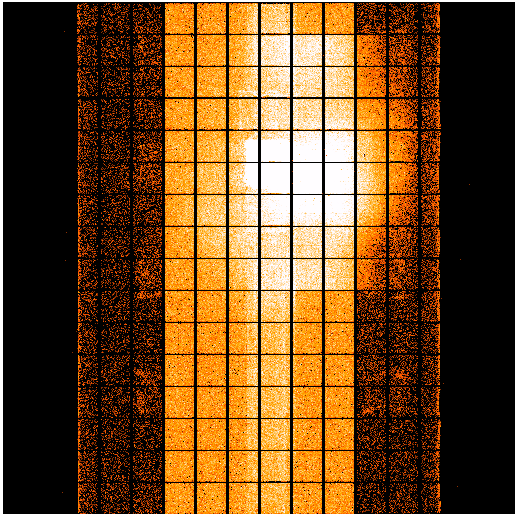
HRCS_06_2005.fits          16777216  0.0279    0.1717      0.0       6.0
        IMAGE                NPIX     MEAN      STDDEV      MIN      MAX
HRCS_08_1999_06_2005.fits  16777216  6.2336    13.9999      0.0      1503.0
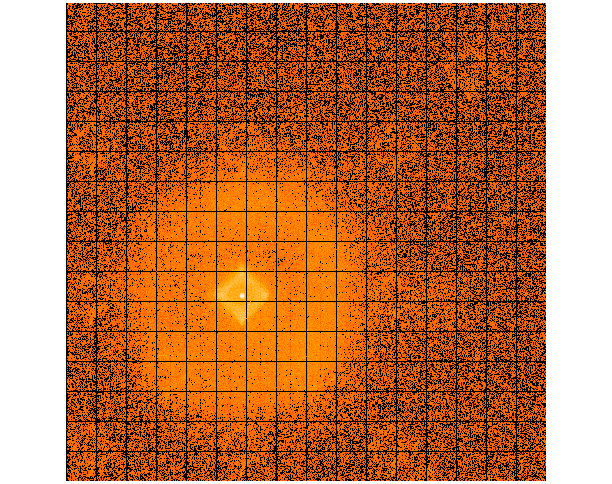
We display a max dose trend plot corrected for events that "pile-up" in the center of the taps due to bad position information.

|
|
|
|
| Mar 2005 | Dec 2004 | Sep 2004 | Jun 2004 |
|---|
|
|
|
|
| Mar 2005 | Dec 2004 | Sep 2004 | Jun 2004 |
|---|

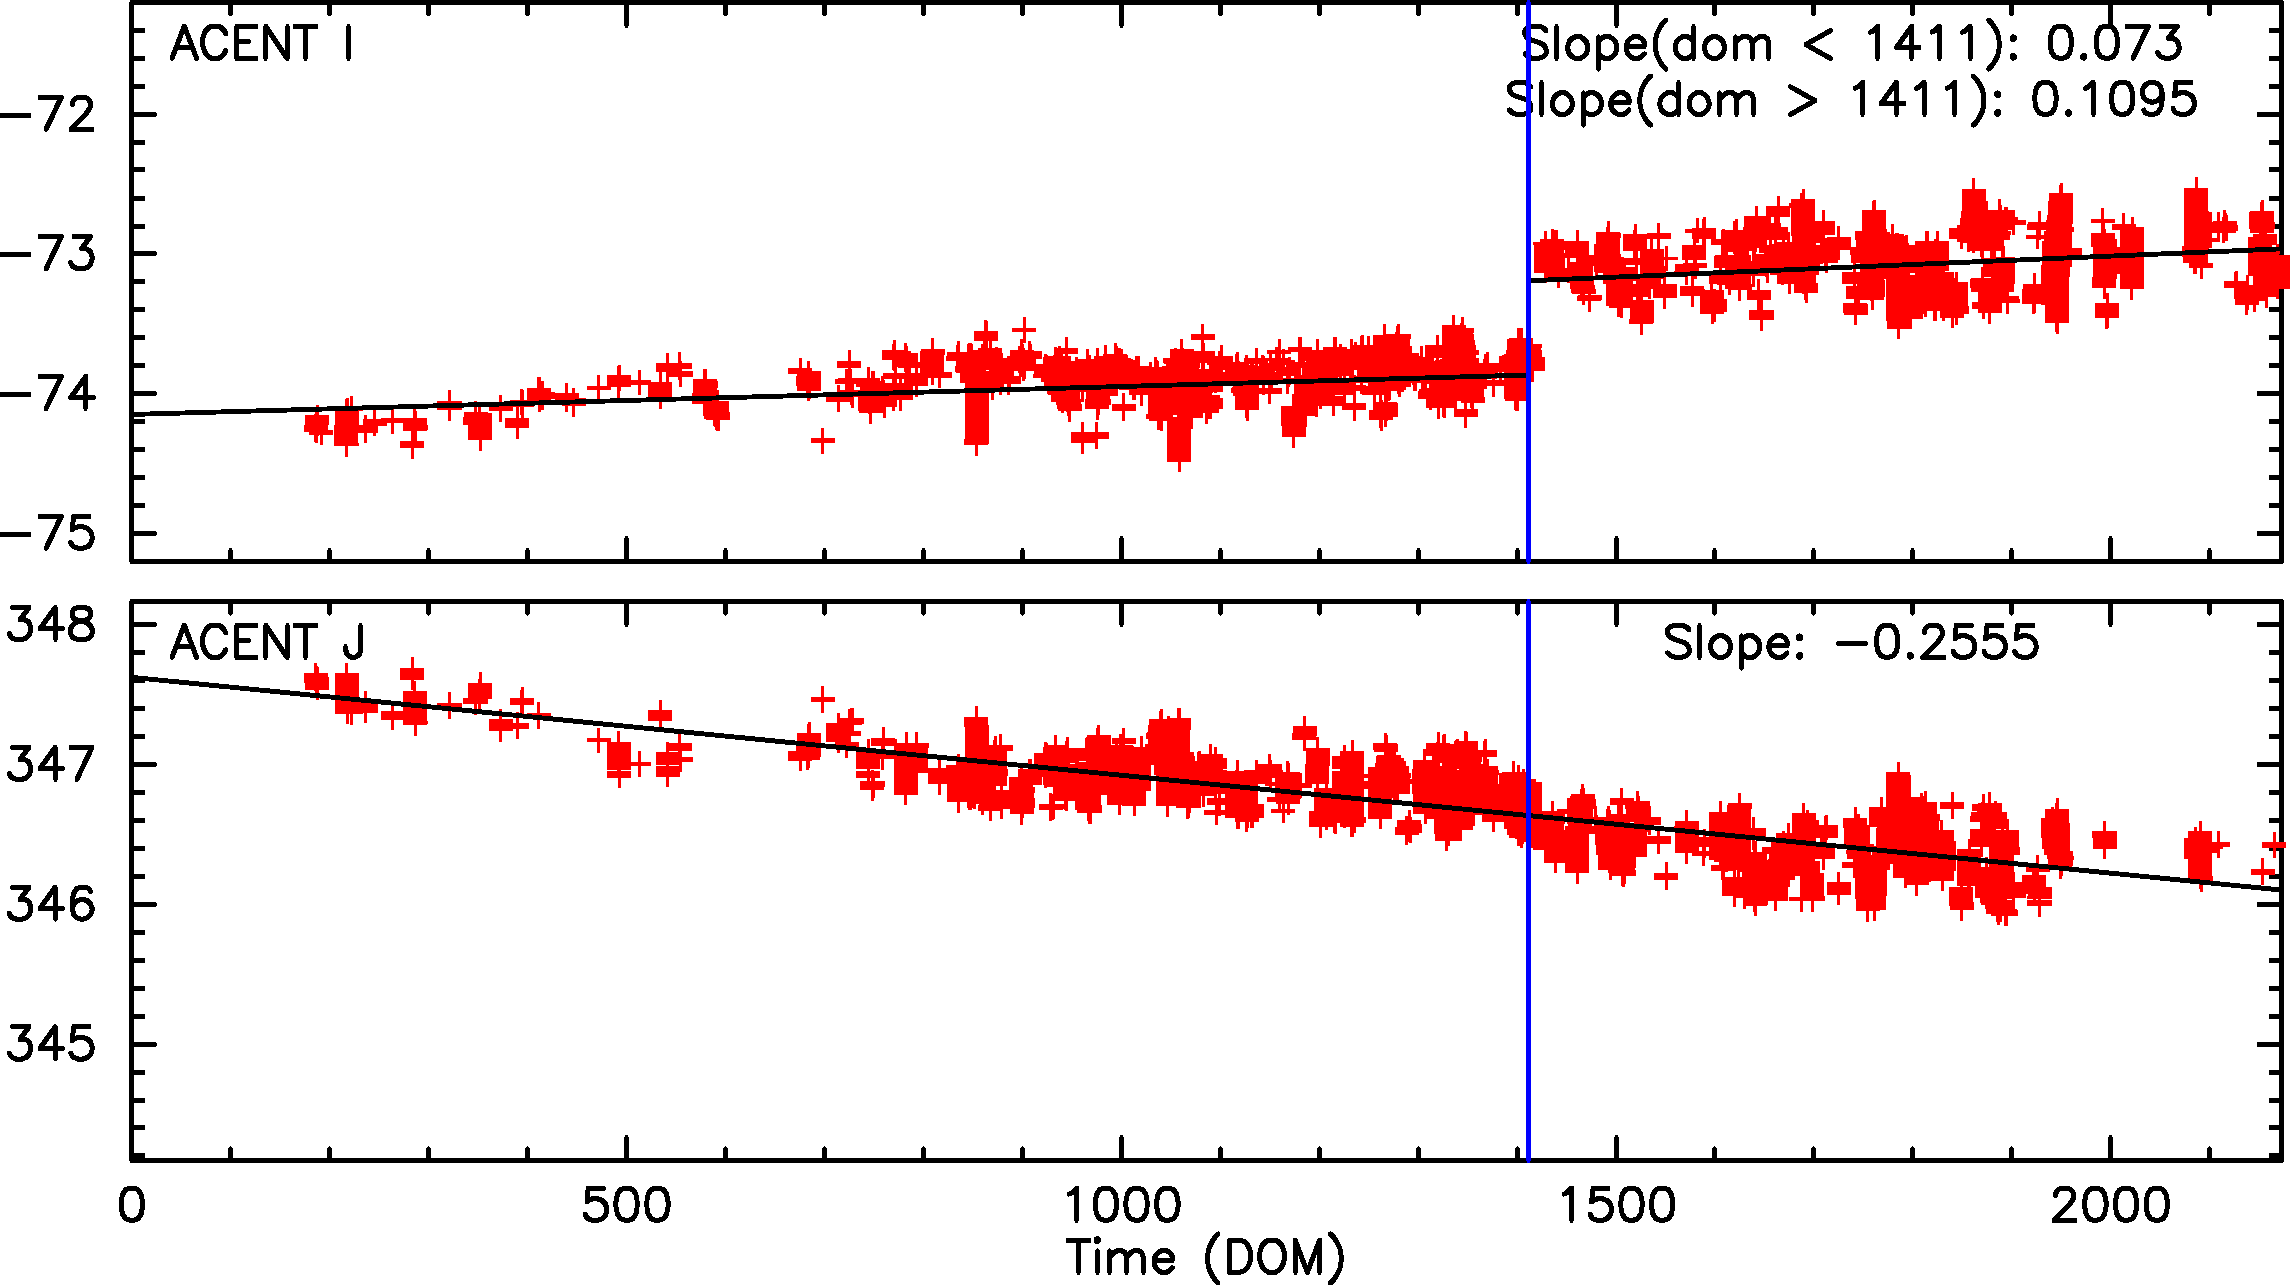
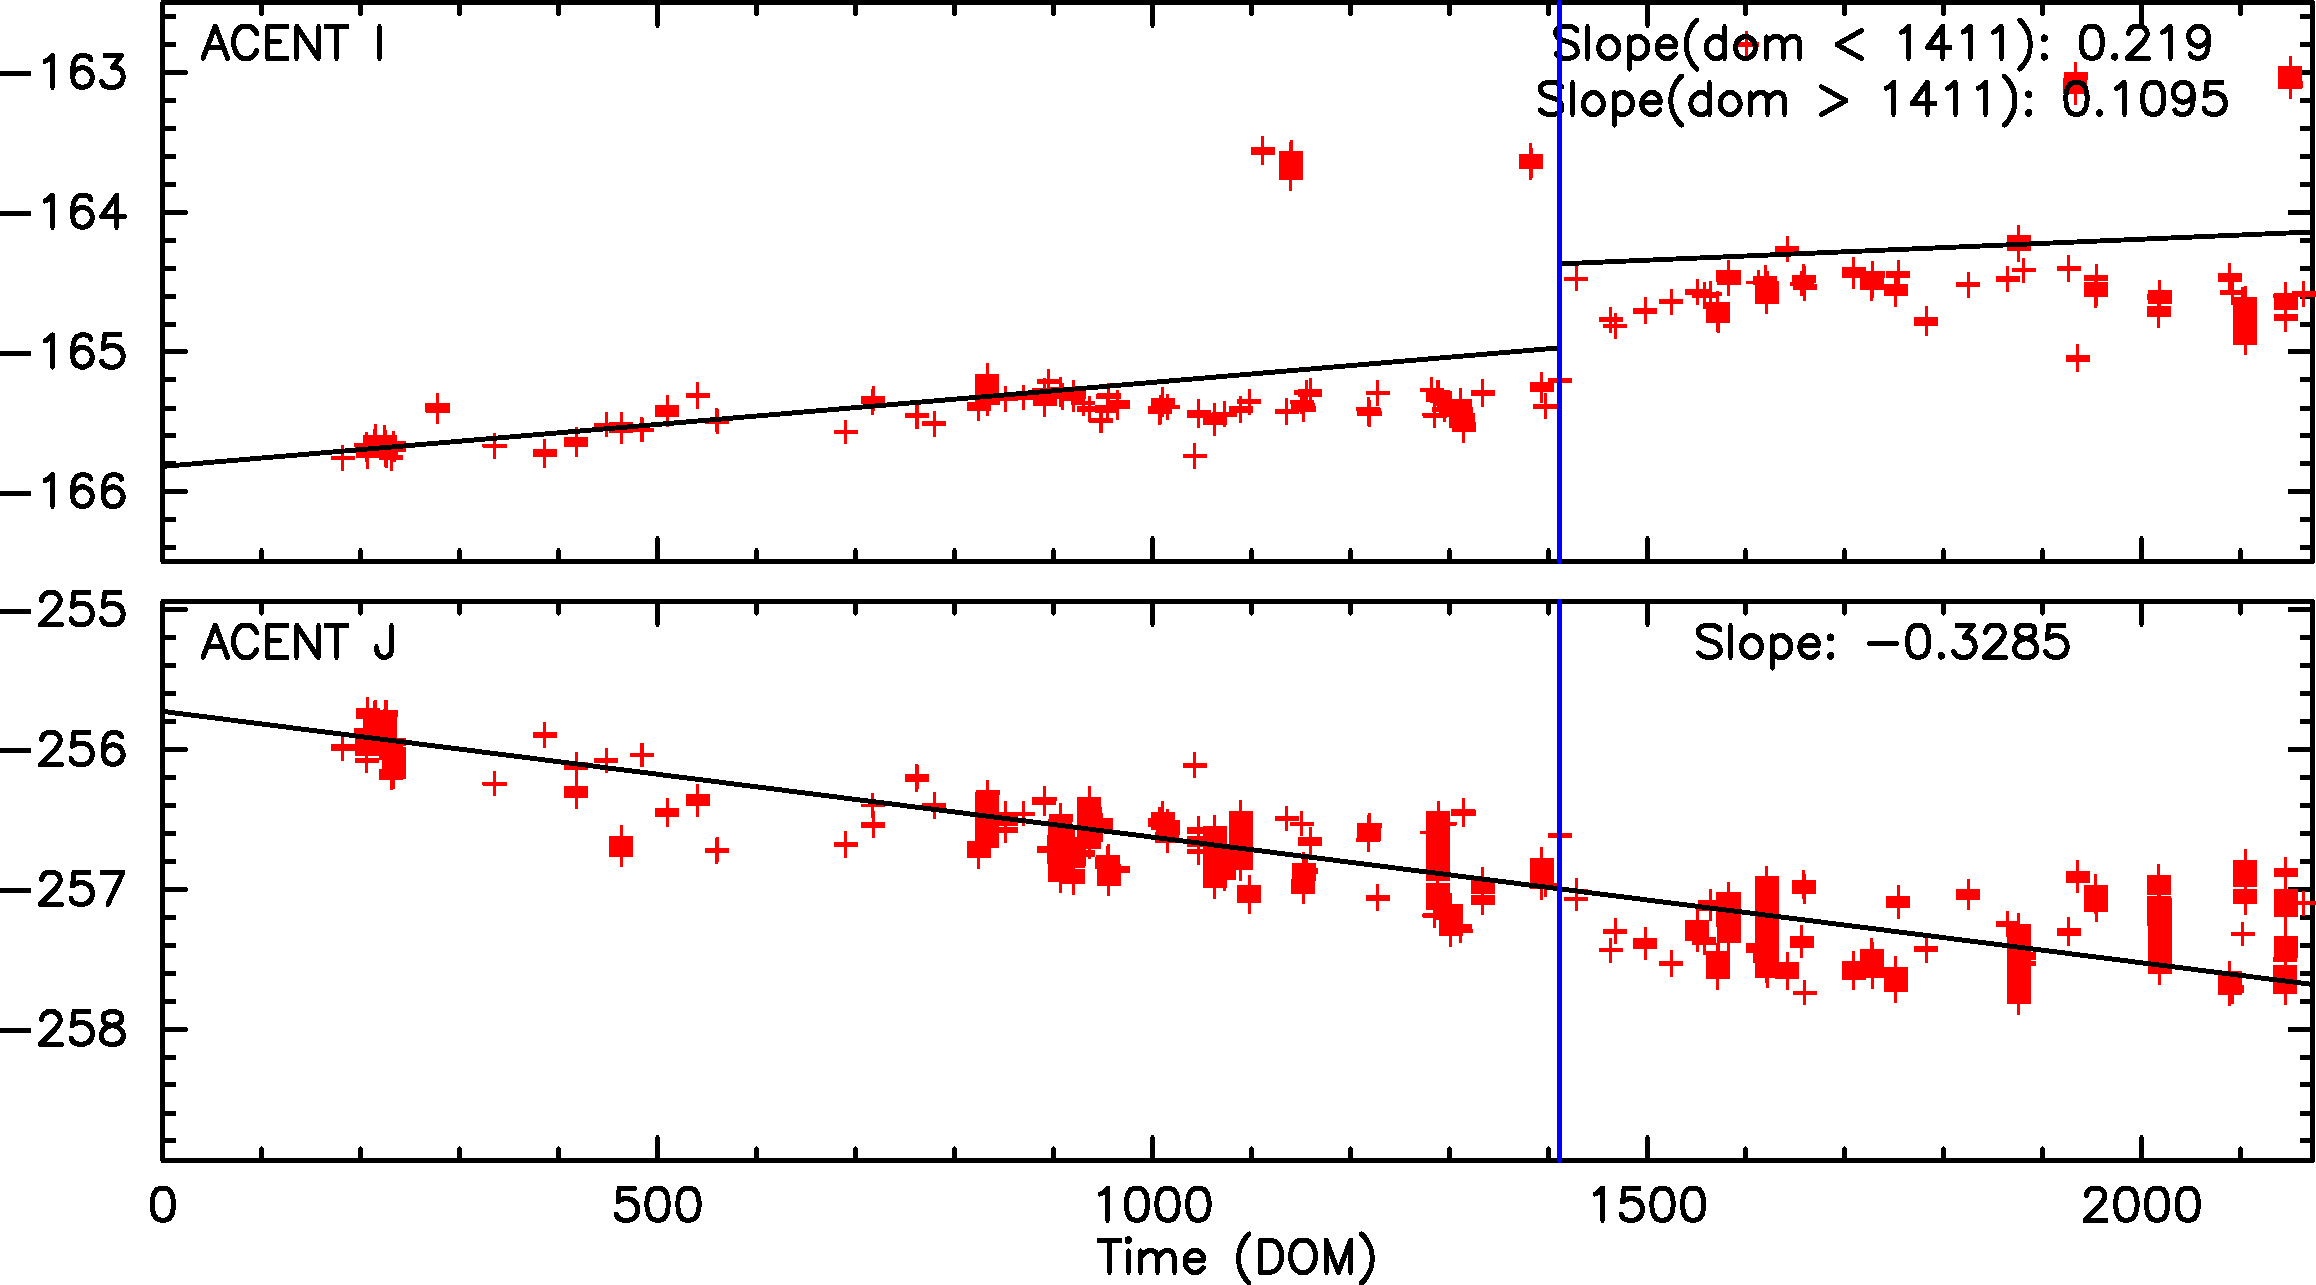
Fid light positions on ACA drift with time. The drift trends of Fid light 6 with ACIS S configuration are shown below.
The top panel shows Fid light 5 drift in ACENT I (app. along with -Y axis), and the
bottom panel shows that in ACENT J (app. along with Z axis). The unit is a pixel, and
one pixel is approximately 5 arcsec. The slope listed at the top right corner is
the change in a position per year (arcsec/yr). The vertical line on DOM = 1411 (June 1, 2003)
indicates a transition date of use of IRU-1 to IRU-2.
See also Tom Aldcroft's updated page: https://cxc.cfa.harvard.edu/mta/ASPECT/fid_drift
| Previous Quarter | ||||||
| MSID | MEAN | RMS | DELTA/YR | DELTA/YR/YR | UNITS | DESCRIPTION |
| PLINE02T | 3.050e+02 | 9.502e+00 | 2.092e+01 | 3.715e+02 | K | PROP LINE TEMP 02 |
| PLINE03T | 3.079e+02 | 1.106e+01 | 2.239e+01 | 4.810e+02 | K | PROP LINE TEMP 03 |
| PLINE04T | 2.936e+02 | 8.863e+00 | 1.694e+01 | 4.335e+02 | K | PROP LINE TEMP 04 |
| PLINE05T | 2.928e+02 | 5.425e+00 | 1.456e+01 | 3.092e+02 | K | PROP LINE TEMP 05 |
| Previous Quarter | ||||||
| MSID | MEAN | RMS | DELTA/YR | DELTA/YR/YR | UNITS | DESCRIPTION |
| AGRNDADC | 9.169e-04 | 2.471e-04 | -6.142e-04 | 3.972e-03 | V | Analog ground A/D convert reading |
| FATABADC | 4.993e+00 | 3.289e-04 | -4.635e-04 | 1.469e-02 | Converter | FA Tab Position Sensor A/D |
| N15VADC | -1.501e+01 | 3.262e-04 | -9.452e-04 | -7.838e-03 | Reading | -15V Power Supply A/D Converter |
| P15VADC | 1.496e+01 | 5.533e-04 | -1.889e-03 | -1.391e-02 | Reading | +5V Power Supply A/D Converter |
| P5VADC | 4.954e+00 | 3.484e-03 | 5.356e-03 | 2.023e-01 | Reading | +5V Power Supply A/D Converter |
| TSCTABADC | 4.991e+00 | 5.068e-04 | -4.156e-04 | 1.866e-02 | converter | TSC Tab Position Sensor A/D |
| Previous Quarter | ||||||
| MSID | MEAN | RMS | DELTA/YR | DELTA/YR/YR | UNITS | DESCRIPTION |
| Previous Quarter | ||||||
| MSID | MEAN | RMS | DELTA/YR | DELTA/YR/YR | UNITS | DESCRIPTION |
| TSCIUSF1 | 2.916e+02 | 3.322e+01 | 4.065e+01 | 1.904e+03 | K | SC-IUS FITTING-1 TEMP |
| TSCIUSF2 | 2.604e+02 | 1.891e+01 | 2.923e+01 | 1.160e+03 | K | SC-IUS FITTING-2 TEMP |
| TSCIUSF5 | 2.480e+02 | 1.639e+01 | 1.543e+01 | 1.540e+03 | K | SC-IUS FITTING-5 TEMP |
| TSCIUSF8 | 2.869e+02 | 3.576e+01 | 4.481e+01 | 2.201e+03 | K | SC-IUS FITTING-8 TEMP |

| 
|

| Year | Month | |||||||||||
|---|---|---|---|---|---|---|---|---|---|---|---|---|
| 1999 | Jul | Aug | Sep | Oct | Nov | Dec | ||||||
| 2000 | Jan | Feb | Mar | Apr | May | Jun | Jul | Aug | Sep | Oct | Nov | Dec |
| 2001 | Jan | Feb | Mar | Apr | May | Jun | Jul | Aug | Sep | Oct | Nov | Dec |
| 2002 | Jan | Feb | Mar | Apr | May | Jun | Jul | Aug | Sep | Oct | Nov | Dec |
| 2003 | Jan | Feb | Mar | Apr | May | Jun | Jul | Aug | Sep | Oct | Nov | Dec |
| 2004 | Jan | Feb | Mar | Apr | May | Jun | Jul | Aug | Sep | Oct | Nov | Dec |
| 2005 | Jan | Feb | Mar | Apr | May | Jun | Jul | Aug | Sep | Oct | Nov | Dec |