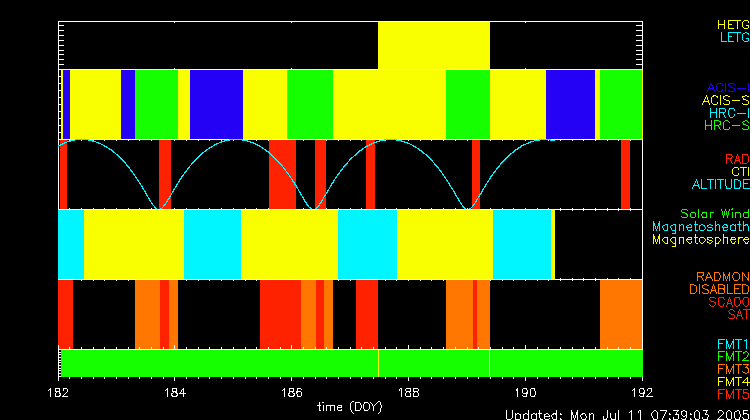

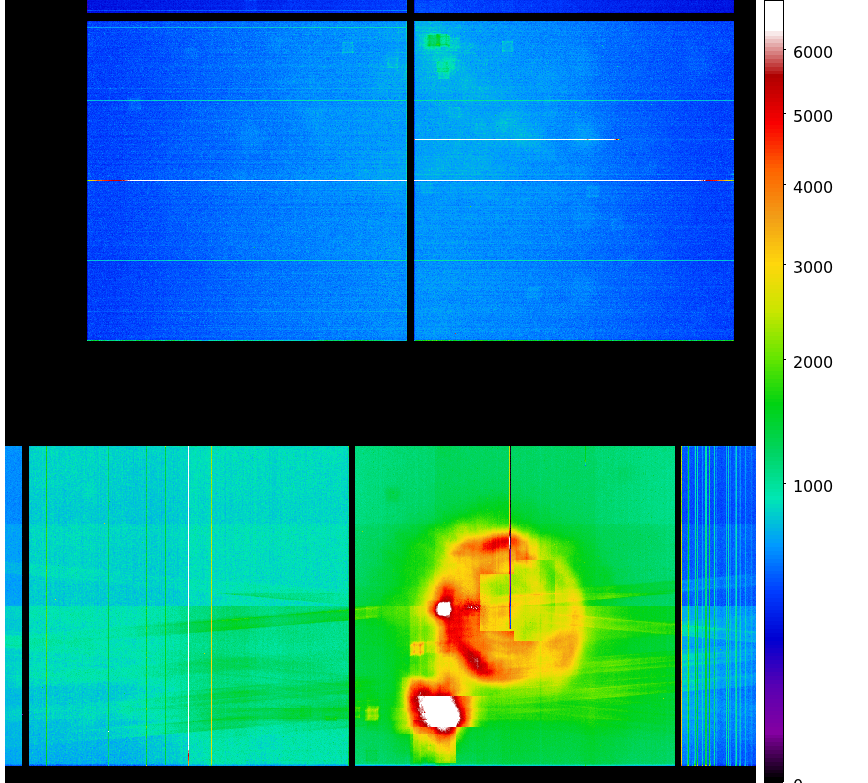
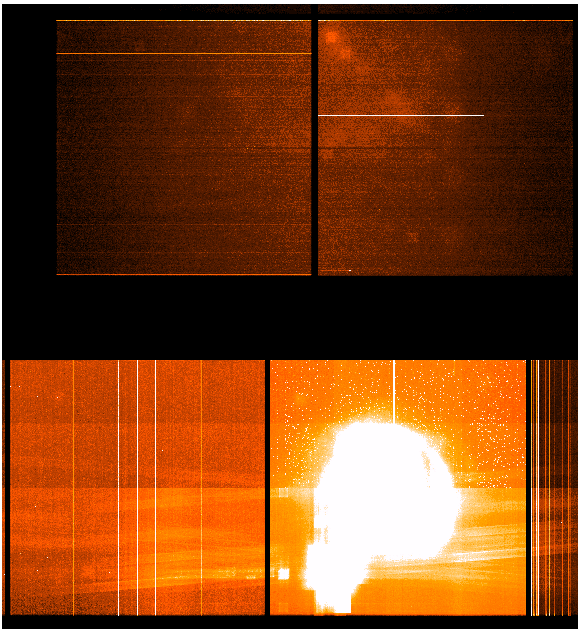
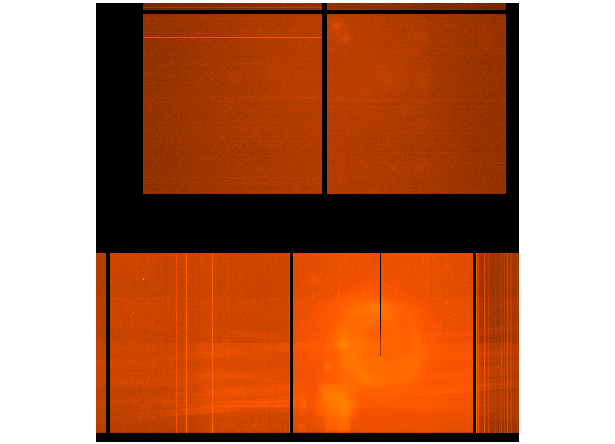
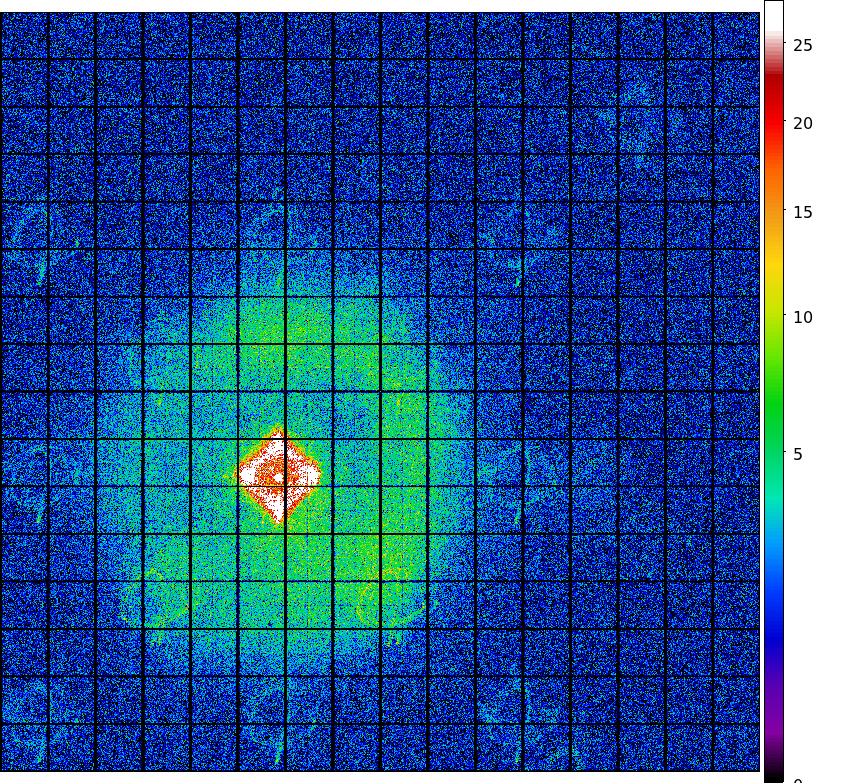
We updated ACIS cumulative dose map from this month. The steps we took to compute a new dose map are;
Please check more detail plots at Telemetered Photon Dose Trend page.
Statistics:
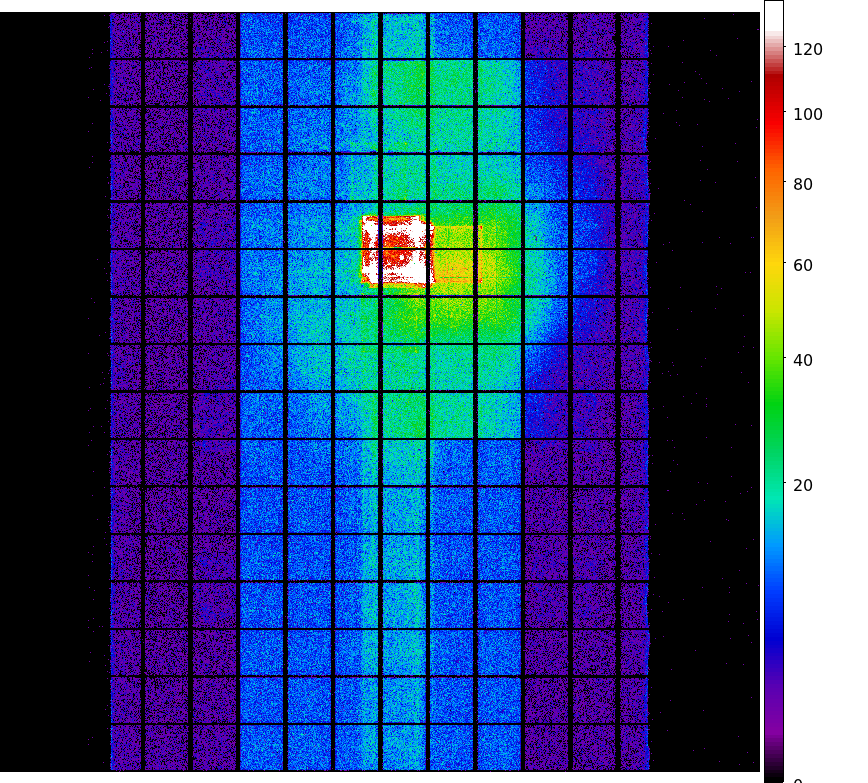
# IMAGE     NPIX      MEAN           RMS               MIN   MAX
ACIS_jul05 6004901    10.2465       15.1564            0.0   807.0


 I2 node 0  262654   11.130140        4.046822        1.0     62.0
 I2 node 1  262654   11.846646        4.982092        1.0     464.0
 I2 node 2  262654   11.725864        4.162978        1.0     221.0
 I2 node 3  262654   11.808007        4.612586        1.0     67.0

 I3 node 0  262654   12.364152        9.759841        0.0     447.0
 I3 node 1  262654   11.946967        9.512692        0.0     349.0
 I3 node 2  262654   11.140183        3.864954        0.0     49.0
 I3 node 3  262654   12.045464        6.463788        0.0     183.0

 S2 node 0  262654   14.904048        4.787066        1.0     161.0
 S2 node 1  262654   14.905832        5.451696        1.0     101.0
 S2 node 2  262654   15.703802        5.461826        1.0     167.0
 S2 node 3  262654   15.271886        4.769790        1.0     563.0

 S3 node 0  262654   14.193738        5.402562        1.0     153.0
 S3 node 1  262654   15.200353        4.512498        1.0     82.0
 S3 node 2  262654   14.816751        4.024710        1.0     65.0
 S3 node 3  262654   14.002657        3.906679        1.0     41.0
Statistics:
 IMAGE        NPIX      MEAN          RMS              MIN    MAX
ACIS_total 6004901   783.943       1121.675           0.0  46223.0

 I2 node 0  262654   535.961958       89.163299       99.0    1985.0
 I2 node 1  262654   564.103217       124.762068      114.0   2198.0
 I2 node 2  262654   568.149206       96.869831       117.0   1843.0
 I2 node 3  262654   567.866427       125.440883      114.0   2616.0

 I3 node 0  262654   613.061240       149.278529      0.0     3155.0
 I3 node 1  262654   632.978730       413.180085      0.0     11400.0
 I3 node 2  262654   566.597774       88.978030       0.0     2005.0
 I3 node 3  262654   561.971445       97.844939       0.0     10413.0

 S2 node 0  262654   874.096975       109.517686      386.0   2792.0
 S2 node 1  262654   918.129474       182.377831      387.0   4465.0
 S2 node 2  262654   1047.858387      212.426301      542.0   7848.0
 S2 node 3  262654   1031.123076      174.684834      541.0   5047.0

 S3 node 0  262654   1796.143696      1020.363640     610.0   8906.0
 S3 node 1  262654   2906.169910      1567.187222     1.0     9891.0
 S3 node 2  262654   1995.047388      700.958520      530.0   4616.0
 S3 node 3  262654   1433.473405      260.187426      659.0   3479.0
|
|
|
|
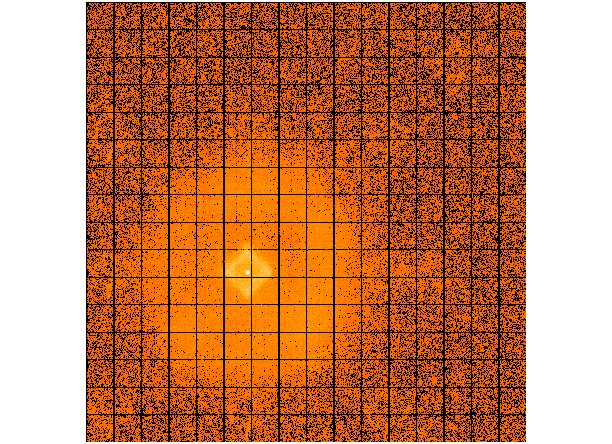
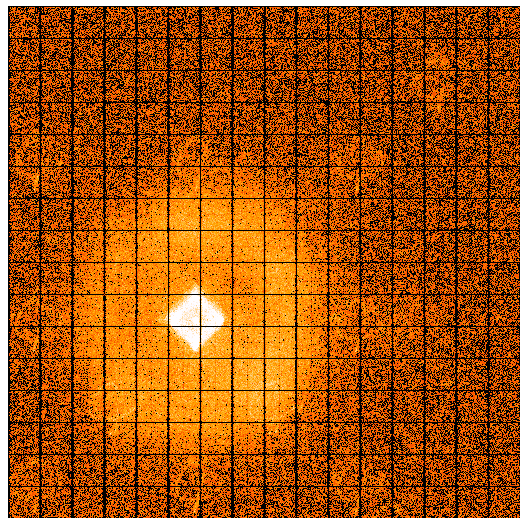
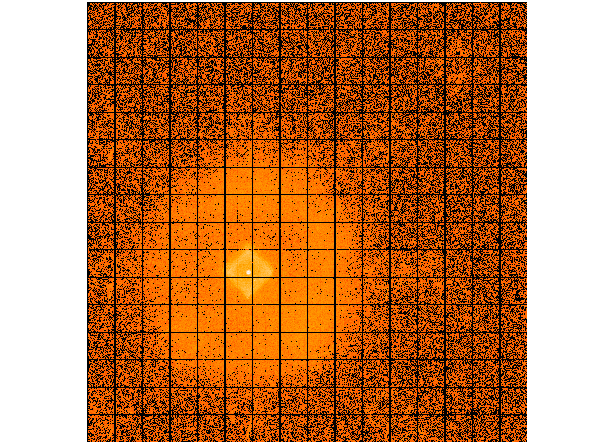
| Apr 2005 | Jan 2005 | Oct 2004 | Jul 2004 |
|---|
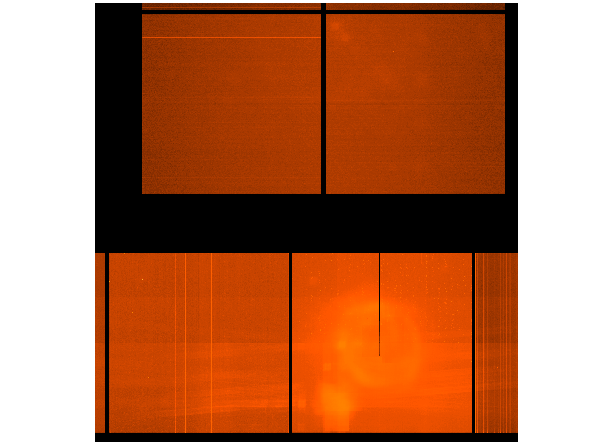
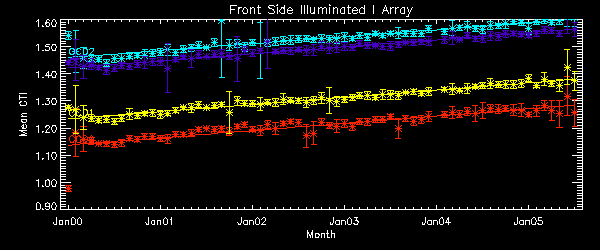
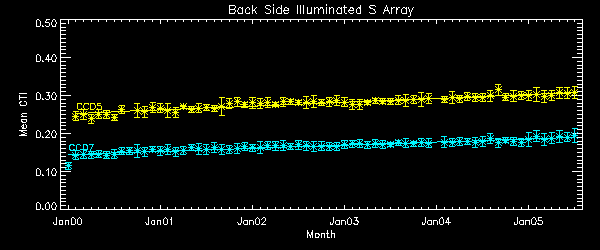
We report CTIs with a refined data definition. CTIs were computed for the temperature dependency corrected data. Please see new CTI page for detailed explanation. CTI's are computed for Mn K alpha, and defined as slope/intercept x10^4 of row # vs ADU. Data file here

       The Mean (max) FPT: -106.71      std dev: 30.02
               mean width:    0.60 days std dev: 0.28
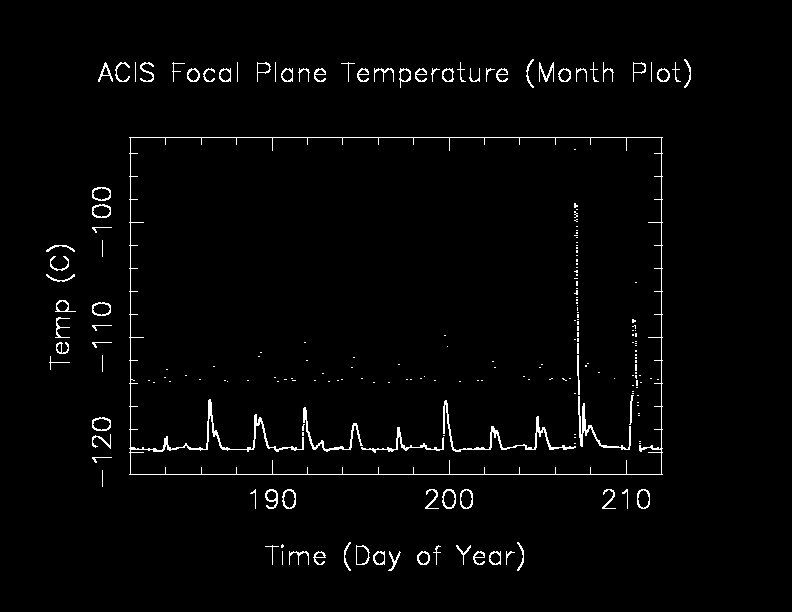

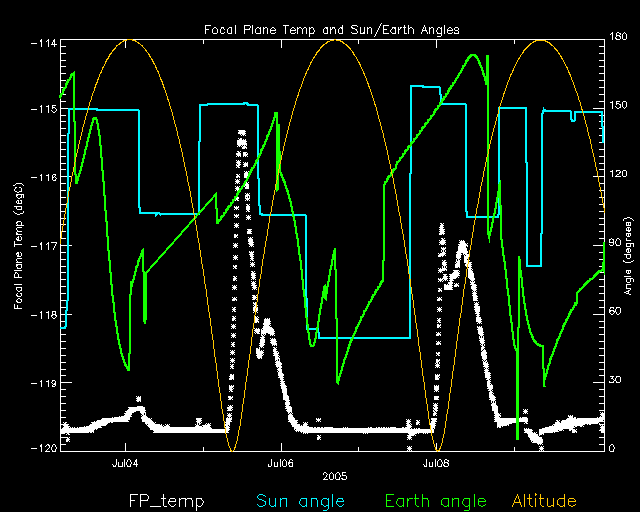
The following is a plot of focal plane temperature and sun angle, earth angle, and altitude. July has seen an increases number of "shoulders", as was seen in February. The shoulders appear on perigee egress now and on perigee ingress 6 months ago.

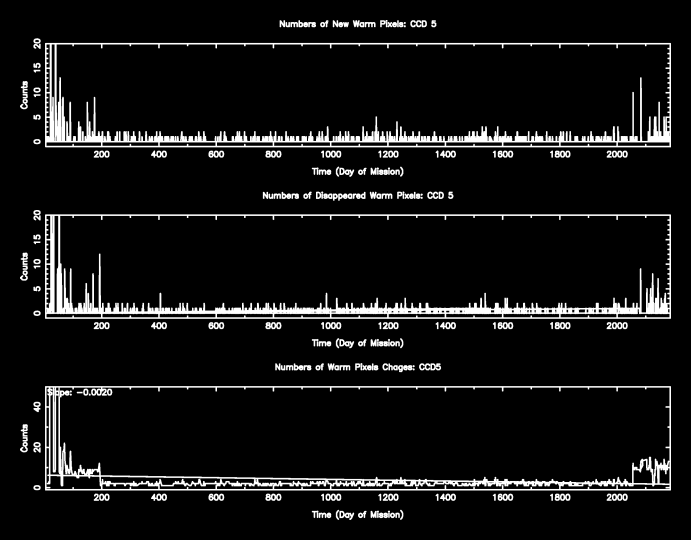
The plots below were generated with a new warm pixel finding script. Please see Acis Bad Pixel Page for details.
Front Side CCDs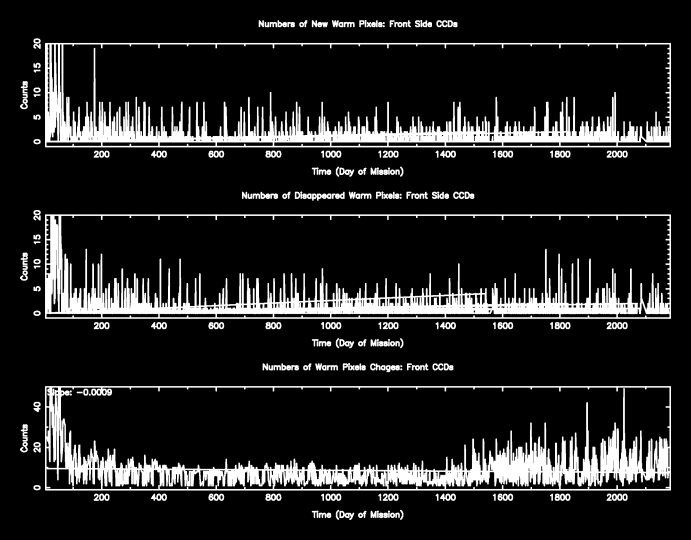
Back Side CCD (CCD5)
| Name | Low (keV) | Hight(KeV) | Description |
|---|---|---|---|
| SSoft | 0.00 | 0.50 | Super soft photons |
| Soft | 0.50 | 1.00 | Soft photons |
| Med | 1.00 | 3.00 | Moderate energy photons |
| Hard | 3.00 | 5.00 | Hard Photons |
| Harder | 5.00 | 10.00 | Very Hard photons |
| Hardest | 10.00 | Beyond 10 keV |
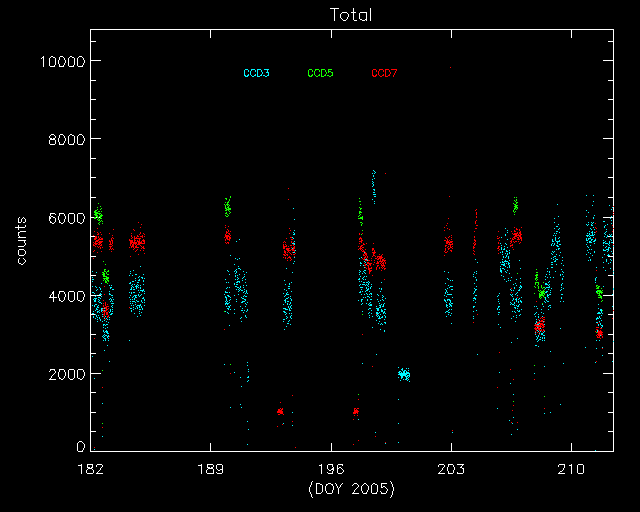
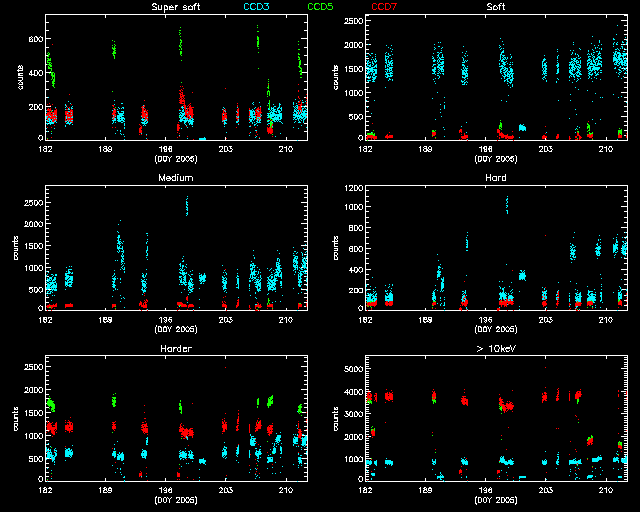
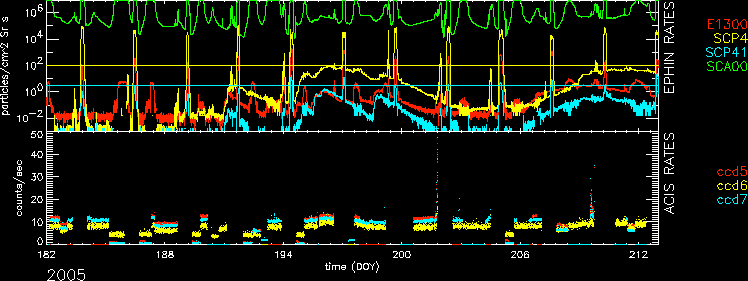
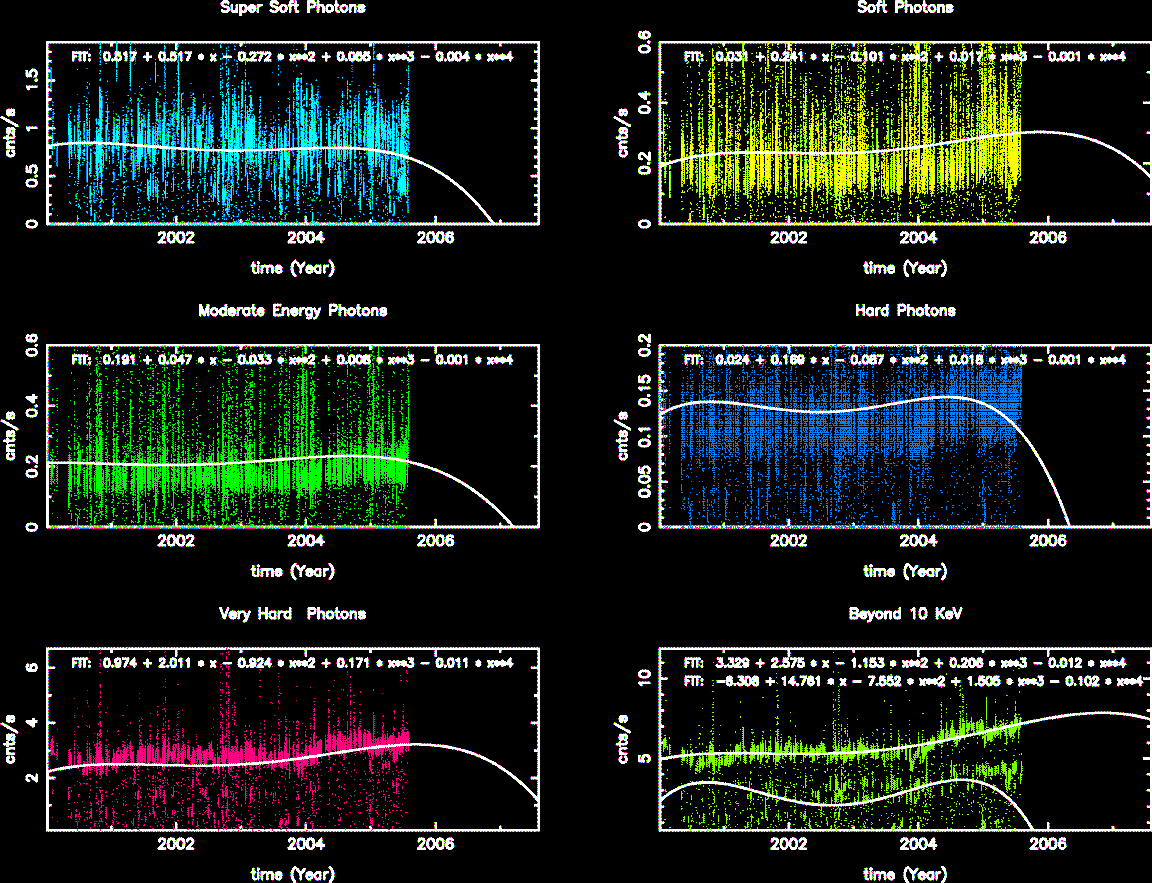
The following three plots show trends of SIB from year 2000. CCDs shown here are CCD3, CCD5, and CCD7. Fitted lines are linear fit after eliminating extreme outliers. For >10 keV plots, 2 lines are fit. One is with a 13 keV filter, and another without.

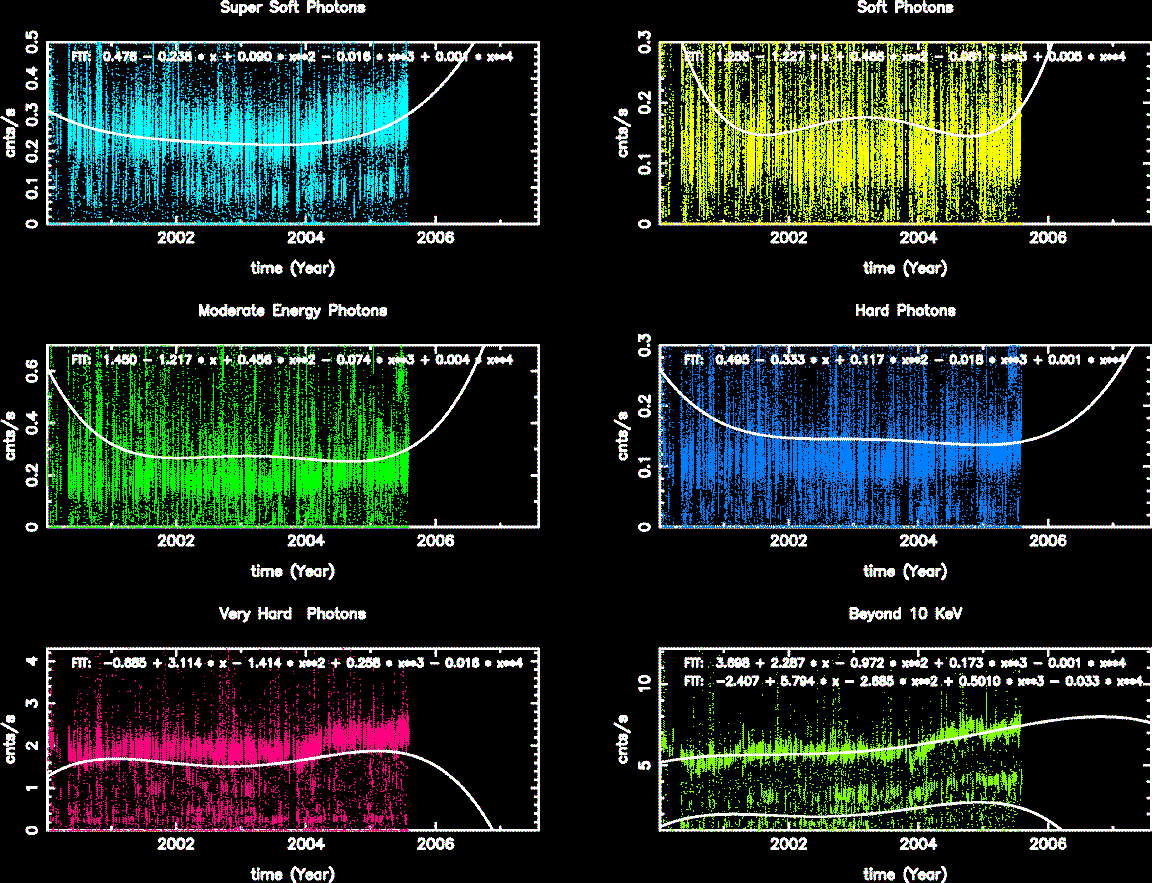
From this month, we trend 10th brightest data points instead of the maximum. This makes the maximum trend values to be about 20% lower than the previous months.
        IMAGE                NPIX      MEAN    STDDEV      MIN       MAX
HRCI_08_1999_07_2005.fits  16777216  1.8286    3.0079      0.0       285.0
        IMAGE                NPIX      MEAN    STDDEV      MIN       MAX
HRCS_07_2005.fits          16777216  0.0185    0.2210      0.0       27.0
        IMAGE                NPIX     MEAN      STDDEV      MIN      MAX
HRCS_08_1999_07_2005.fits  16777216  6.2521    14.0884      0.0      1503.0
We display a max dose trend plot corrected for events that "pile-up" in the center of the taps due to bad position information.

|
|
|
|
| Apr 2005 | Jan 2005 | Oct 2004 | Aug 2004 |
|---|
|
|
|
|
| Apr 2005 | Jan 2005 | Oct 2004 | Aug 2004 |
|---|

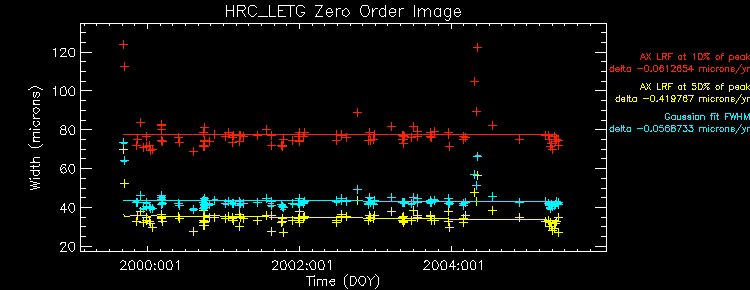
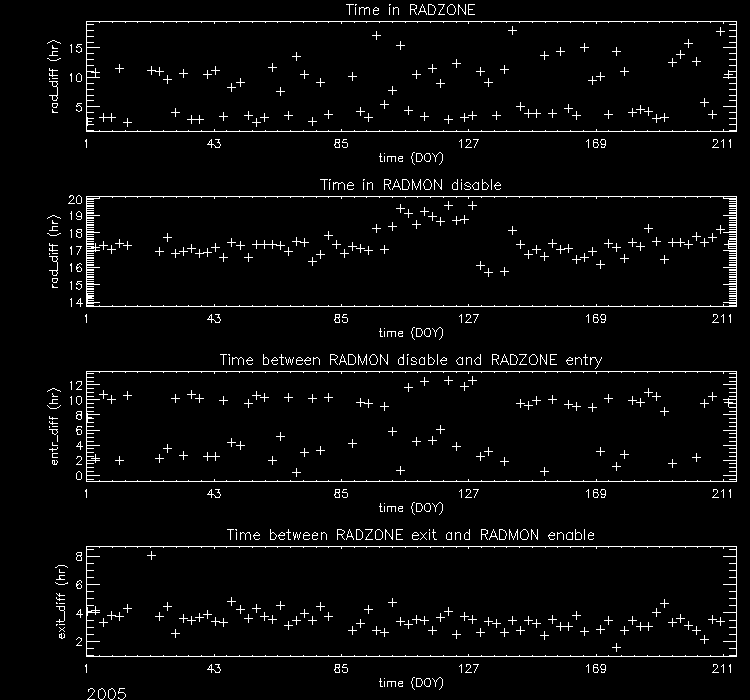
| TSTART | TSTOP | |
| 5.53496e+07 Seconds since Jan. 1 1998 | 2.39193e+08 Seconds since Jan. 1 1998 | |
| 72 Day of Mission | 2200 Day of Mission |
| id_num | id_string | good | marginal | bad | number | mag_i_avg (mag) | mag_i_min (mag) | mag_i_max (mag) |
| 1 | ACIS-1 | 100.000 | 0.000 | 0.000 | 47 | Inf | 6.218 | Inf |
| 2 | ACIS-2 | 100.000 | 0.000 | 0.000 | 93 | 7.014 | 5.467 | 7.238 |
| 3 | ACIS-3 | 100.000 | 0.000 | 0.000 | 2 | 7.285 | 7.170 | 7.353 |
| 4 | ACIS-4 | 100.000 | 0.000 | 0.000 | 109 | 7.104 | 6.147 | 7.421 |
| 5 | ACIS-5 | 100.000 | 0.000 | 0.000 | 127 | 7.126 | 5.724 | 7.460 |
| 6 | ACIS-6 | 100.000 | 0.000 | 0.000 | 40 | 7.197 | 5.822 | 7.448 |
| 7 | HRC-I-1 | 100.000 | 0.000 | 0.000 | 17 | 6.872 | 6.794 | 6.892 |
| 8 | HRC-I-2 | 0.000 | 0.000 | 0.000 | 0 | 0.000 | 0.000 | 0.000 |
| 9 | HRC-I-3 | 100.000 | 0.000 | 0.000 | 17 | 6.951 | 6.908 | 6.968 |
| 10 | HRC-I-4 | 82.353 | 0.000 | 17.647 | 17 | 6.891 | 6.805 | 6.926 |
| 11 | HRC-S-1 | 90.909 | 0.000 | 9.091 | 11 | 6.872 | 6.692 | 6.942 |
| 12 | HRC-S-2 | 85.714 | 0.000 | 14.286 | 7 | 6.885 | 6.183 | 8.385 |
| 13 | HRC-S-3 | 87.500 | 0.000 | 12.500 | 8 | 6.915 | 6.758 | 8.232 |
| 14 | HRC-S-4 | 100.000 | 0.000 | 0.000 | 9 | 6.867 | 6.532 | 8.060 |
| Previous Quarter | ||||||
| MSID | MEAN | RMS | DELTA/YR | DELTA/YR/YR | UNITS | DESCRIPTION |
| AACBPPT | 2.960e+02 | 2.903e-01 | 1.306e-01 | 4.696e+00 | K | AC BASEPLATE TEMP (PRIME) |
| AACBPRT | 2.919e+02 | 2.514e-01 | 1.504e-01 | 1.790e+00 | K | AC BASEPLATE TEMP (RDNT) |
| AACCCDPT | 2.576e+02 | 1.708e-03 | -9.356e-04 | -3.442e-03 | K | AC CCD TEMP (PRI) |
| AACCCDRT | 2.913e+02 | 2.631e-01 | 1.876e-01 | 3.985e+00 | K | AC CCD TEMP (RDNT) |
| AACH1T | 2.894e+02 | 2.522e-01 | 1.233e-01 | 3.024e+00 | K | AC HOUSING TEMP (ACH1) |
| AACH2T | 2.895e+02 | 2.514e-01 | 1.508e-01 | 4.179e+00 | K | AC HOUSING TEMP (ACH2) |
| AAOTALT | 2.892e+02 | 2.475e-01 | 1.188e-01 | 3.821e+00 | K | AC OPT TEL ASSY LENS TEMP |
| AAOTAPMT | 2.887e+02 | 2.510e-01 | 1.703e-01 | 4.521e+00 | K | AC OPT TEL ASSY PRIMARY MIRROR TEMP |
| AAOTASMT | 2.888e+02 | 2.451e-01 | 2.000e-01 | 3.750e+00 | K | AC OPT TEL ASSY SECONDARY MIRROR TEMP |
| AAOTH2MT | 2.891e+02 | 2.497e-01 | 1.340e-01 | 3.045e+00 | K | AC OPT TEL ASSY SECONDARY MIRROR TEMP (HRMA) |
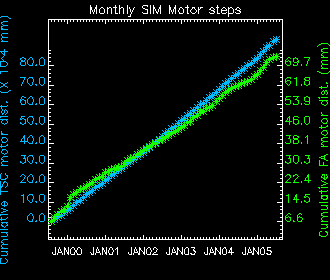
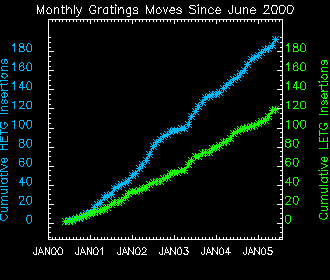
| 
|

| Year | Month | |||||||||||
|---|---|---|---|---|---|---|---|---|---|---|---|---|
| 1999 | Jul | Aug | Sep | Oct | Nov | Dec | ||||||
| 2000 | Jan | Feb | Mar | Apr | May | Jun | Jul | Aug | Sep | Oct | Nov | Dec |
| 2001 | Jan | Feb | Mar | Apr | May | Jun | Jul | Aug | Sep | Oct | Nov | Dec |
| 2002 | Jan | Feb | Mar | Apr | May | Jun | Jul | Aug | Sep | Oct | Nov | Dec |
| 2003 | Jan | Feb | Mar | Apr | May | Jun | Jul | Aug | Sep | Oct | Nov | Dec |
| 2004 | Jan | Feb | Mar | Apr | May | Jun | Jul | Aug | Sep | Oct | Nov | Dec |
| 2005 | Jan | Feb | Mar | Apr | May | Jun | Jul | Aug | Sep | Oct | Nov | Dec |