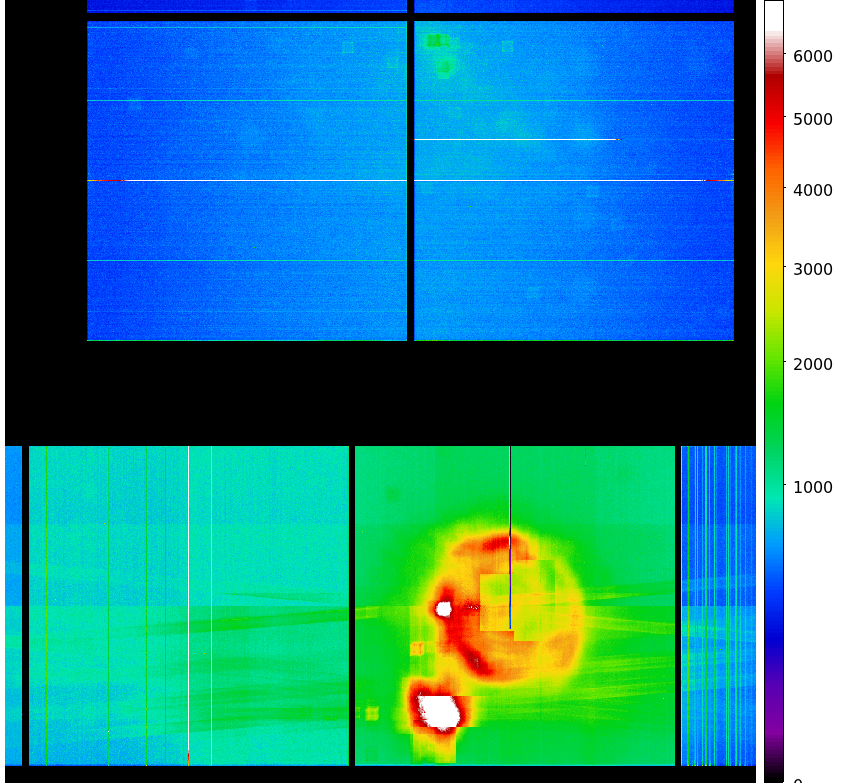
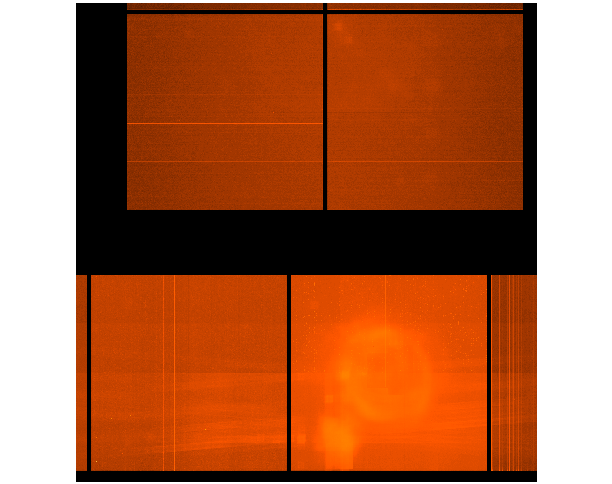
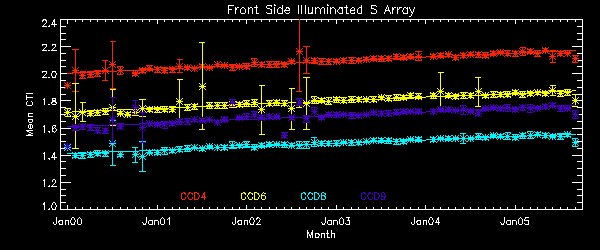
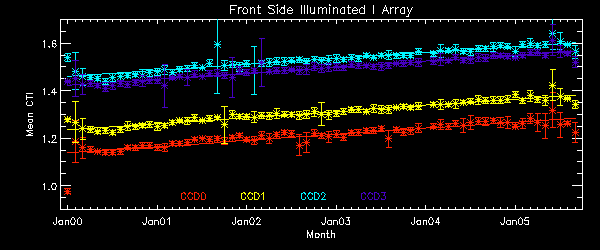
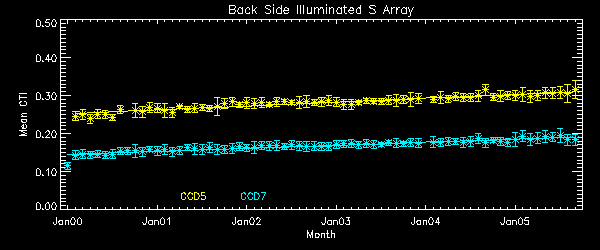
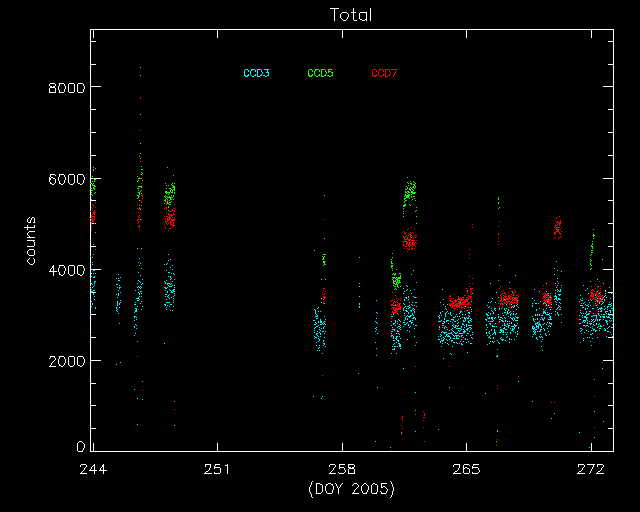
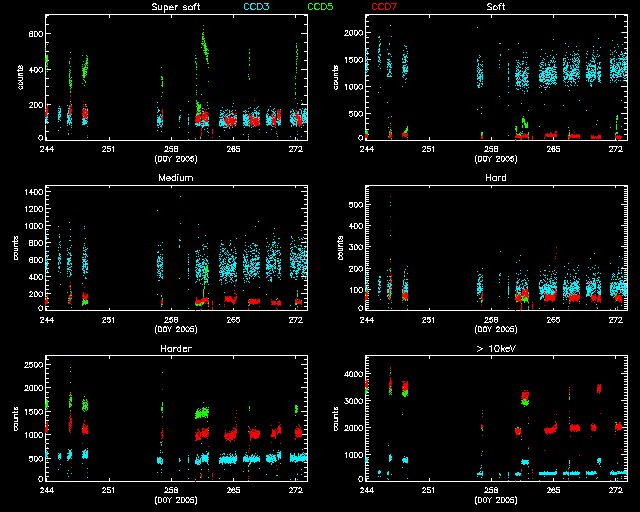
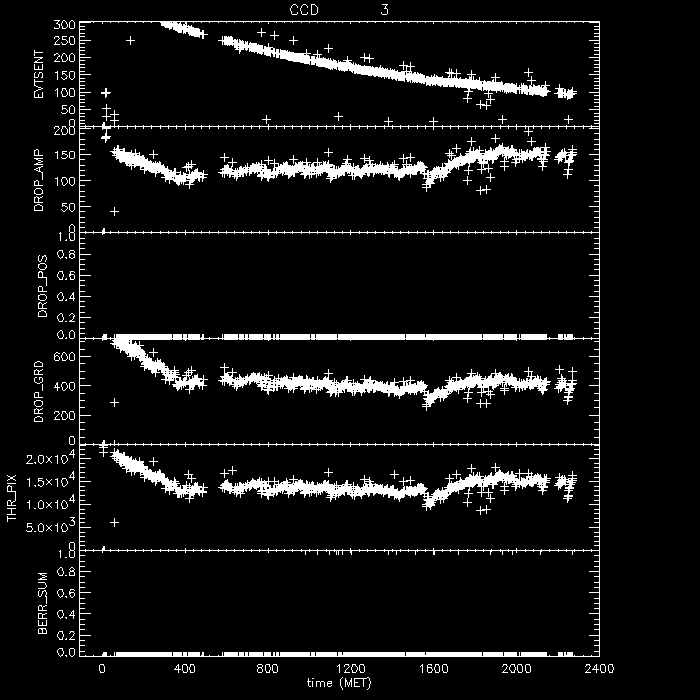
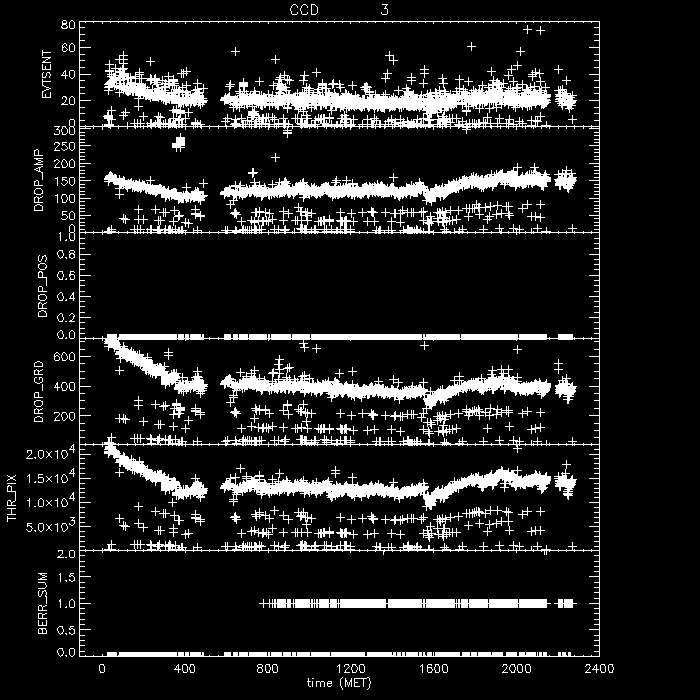
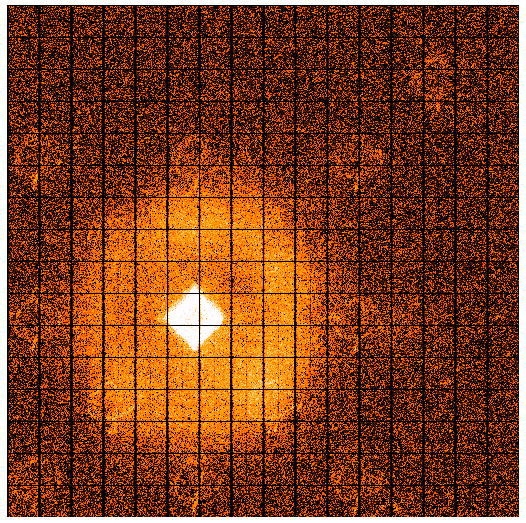
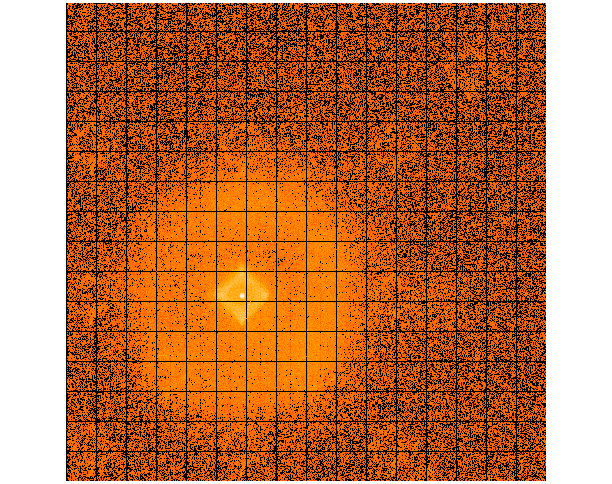
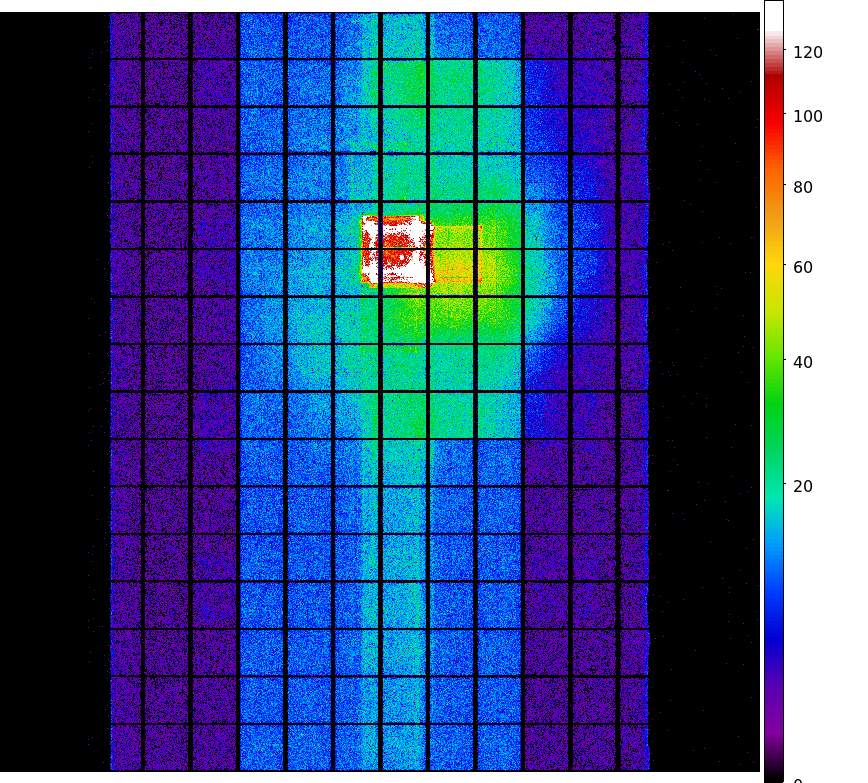
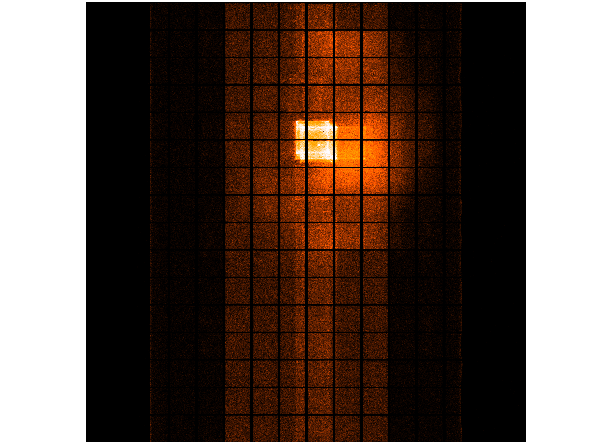
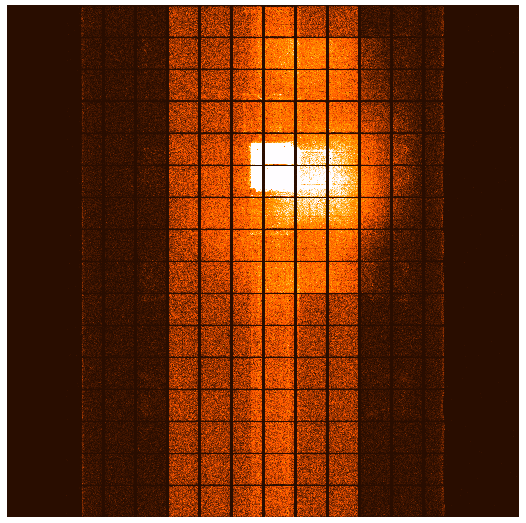
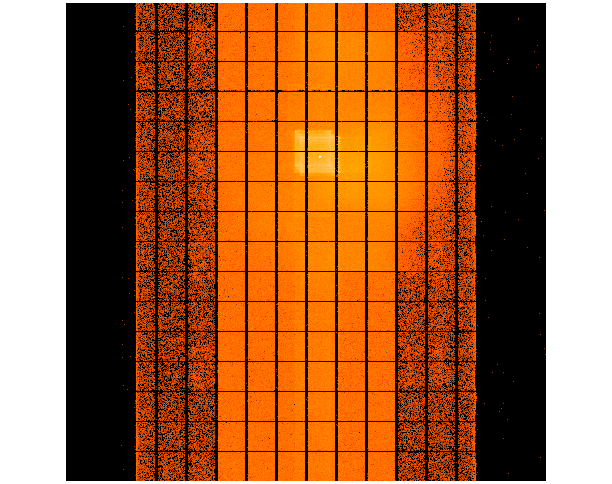
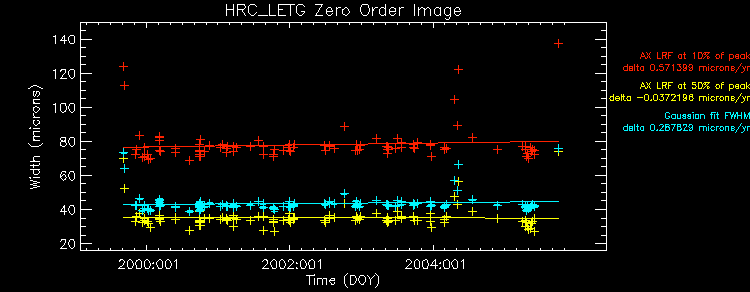
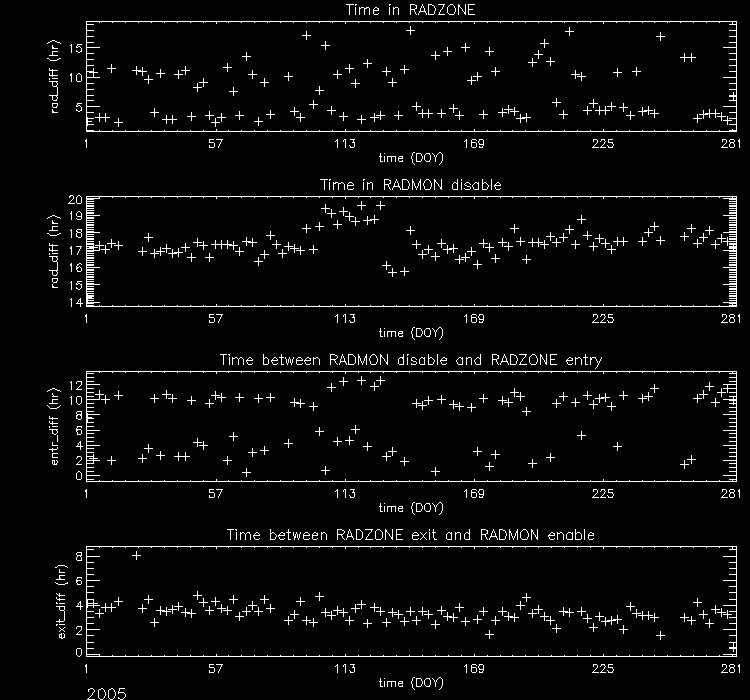
We updated ACIS cumulative dose map from this month. The steps we took to compute a new dose map are;
- Level 1 Event files for a specified month are obtained from archive.
- Image data including I2, I3, S2, S3 CCDs are extracted from all event files.
- All the extracted image data were merged to create a month long exposure map for the month.
- The exposure map is opened with ds9, and check a distribution of count rates against energy.
From this, estimate the upper threshold value. Any events beyond this upper threshold are
assumed erroneous events such as bad pixels.
- Using this upper threshold, the data is filtered, and create a cleaned exposure map for the month.
- The exposure map from each month from the Aug 1999 is added up to create a cumulative exposure
map for each month.
- Using fimgstatistic, we compute count rate statistics for each CCDs.
- For observations with high data drop rates (e.g., Crab nebula, Cas A), we corrected the observations
by adding events.
Note: Counts and RMS's of Cumulative maps are lower than the previous months. This is because we excluded
extreme outliers.
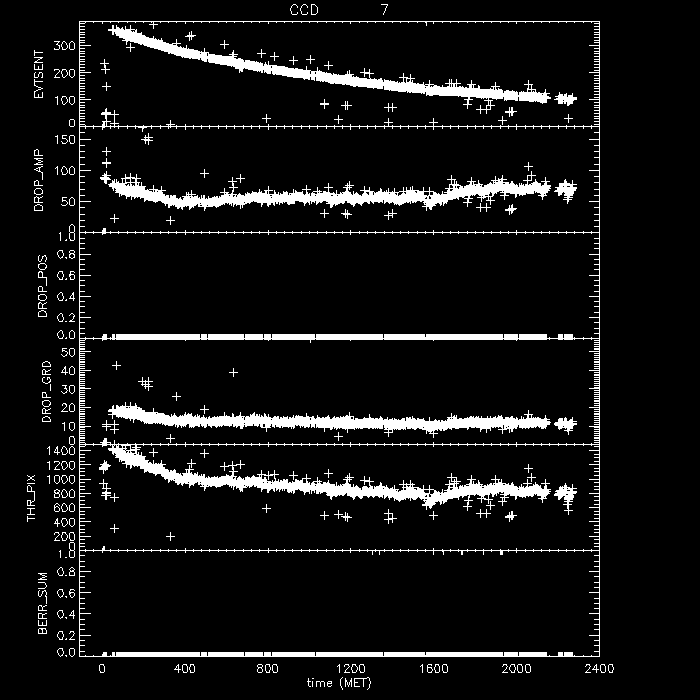
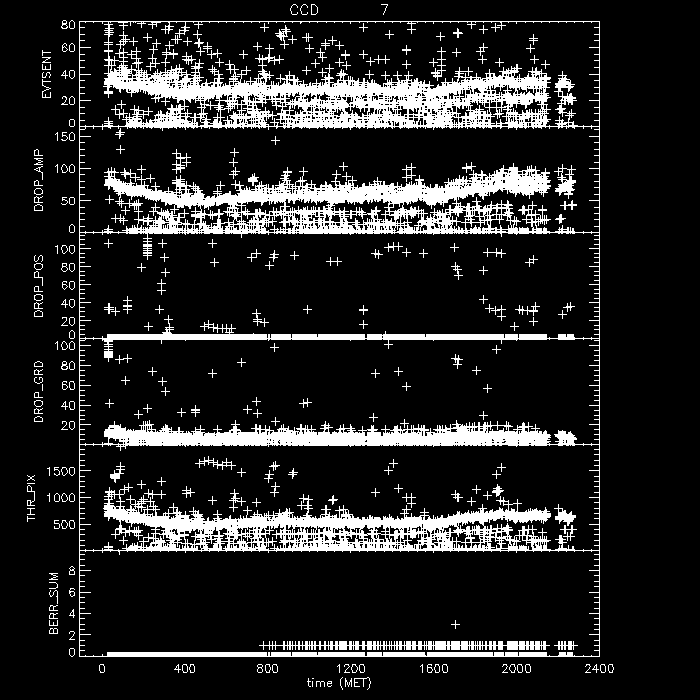
Please check more detail plots at Telemetered Photon Dose Trend page.
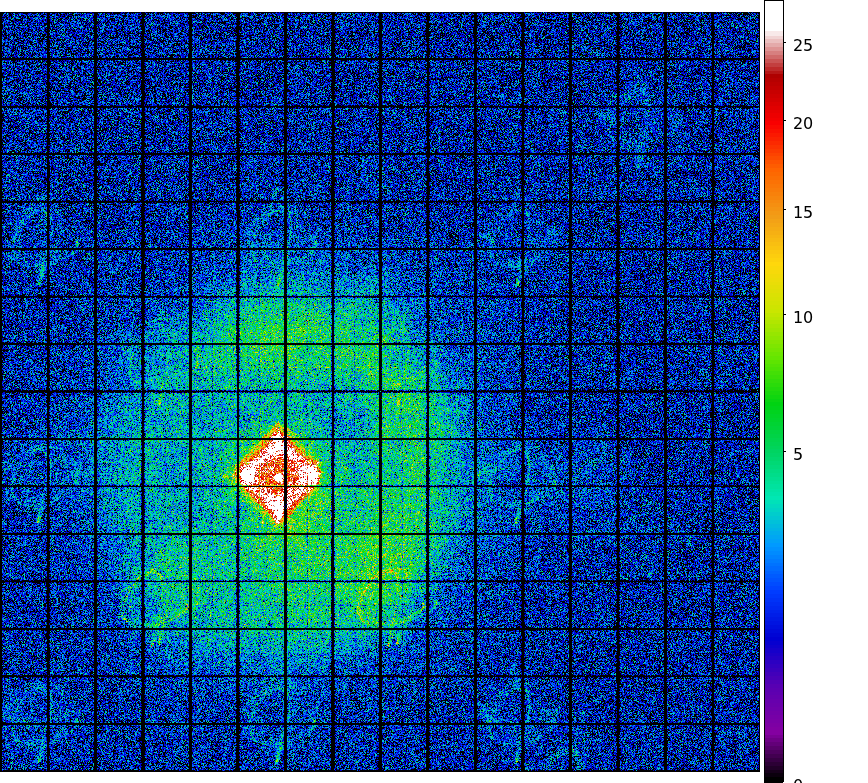
- SEPTEMBER registered-photon-map in fits
Statistics:
# IMAGE     NPIX      MEAN           RMS               MIN   MAX
ACIS_sep05 6004901    8.55236       19.8927            0.0   641.0

 I2 node 0  262654      9.296631        3.661700        0.0      44.0
 I2 node 1  262654      9.894477        4.148422        0.0     343.0
 I2 node 2  262654      9.889702        3.847765        0.0      96.0
 I2 node 3  262654      10.241742       4.114897        0.0      49.0

 I3 node 0  262654      11.393028       3.723943        0.0      50.0
 I3 node 1  262654      11.738342       7.555370        0.0     190.0
 I3 node 2  262654      10.795592       3.643464        0.0      65.0
 I3 node 3  262654      10.264446       3.640054        0.0     160.0

 S2 node 0  262654      10.335290       3.651278        0.0      77.0
 S2 node 1  262654      10.610862       4.151249        0.0      74.0
 S2 node 2  262654      10.966552       3.925130        0.0      79.0
 S2 node 3  262654      10.585837       3.726711        0.0     261.0

 S3 node 0  262654      15.525816       44.129432       0.0     551.0
 S3 node 1  262654      22.599132       64.610981       0.0     617.0
 S3 node 2  262654      9.485413        3.184710        0.0      26.0
 S3 node 3  262654      8.916853        3.087245        0.0      26.0
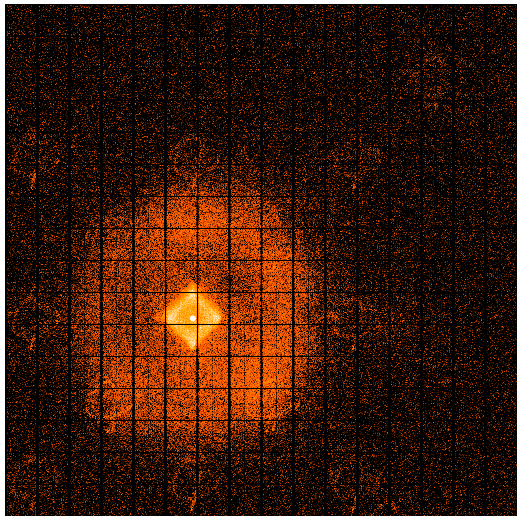
- Aug 1999 - Sep 2005 registered-photon-map in fits
Statistics:
 IMAGE        NPIX      MEAN          RMS              MIN    MAX
ACIS_total 6004901   800.6854      1144.3800          0.0  47275.0

 I2 node 0  262654      551.906654      95.378501       0.0     2085.0
 I2 node 1  262654      581.050591      131.885298      0.0     2541.0
 I2 node 2  262654      584.951214      103.357775      0.0     1913.0
 I2 node 3  262654      585.004646      132.041086      0.0     2699.0

 I3 node 0  262654      631.412179      153.772585      0.0     3184.0
 I3 node 1  262654      652.247124      425.833060      0.0     11723.0
 I3 node 2  262654      583.986948      94.718992       0.0     2137.0
 I3 node 3  262654      578.871479      103.610462      0.0     10716.0

 S2 node 0  262654      896.310394      112.123062      400.0   2974.0
 S2 node 1  262654      940.616768      186.506298      396.0   4597.0
 S2 node 2  262654      1071.390962     214.559336      553.0   7933.0
 S2 node 3  262654      1053.817780     174.823779      549.0   5308.0

 S3 node 0  262654      1828.317107     1065.741265     622.0   9465.0
 S3 node 1  262654      2943.088360     1612.522075     0.0     10374.0
 S3 node 2  262654      2018.160662     701.498898      541.0   4635.0
 S3 node 3  262654      1455.196946     260.922867      670.0   3526.0
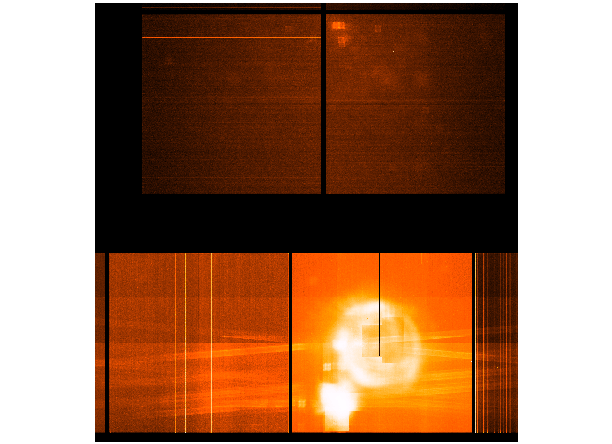
- SEP 2005 dose PNG image
- SEP I3 dose PNG image
- SEP S3 dose PNG image
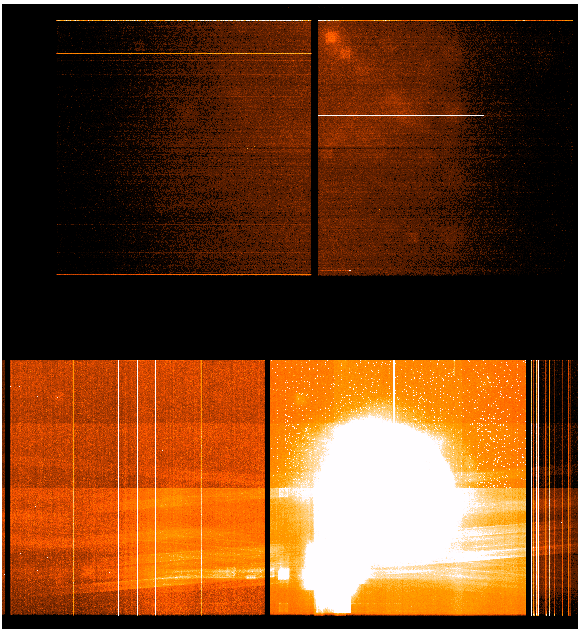
- TOTAL AUG 1999 - SEP 2005 dose PNG image
- TOTAL I3 dose PNG image
- TOTAL S3 dose PNG image
