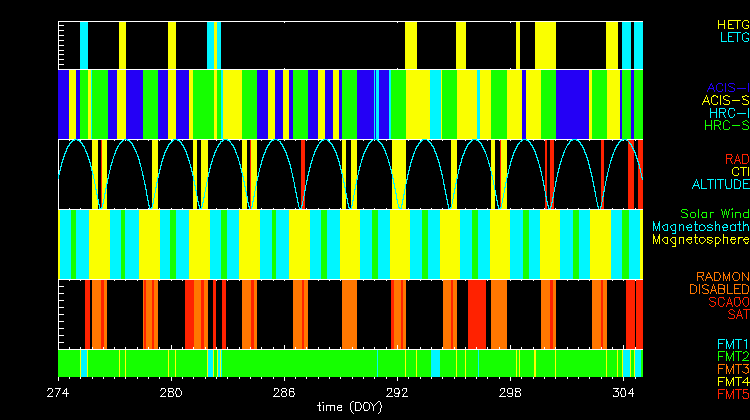

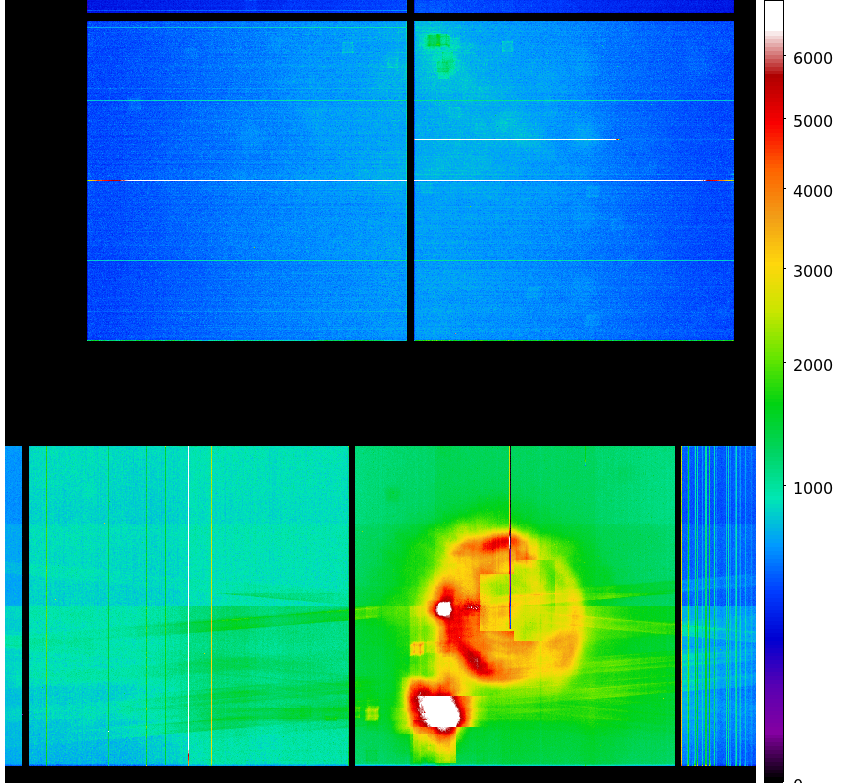
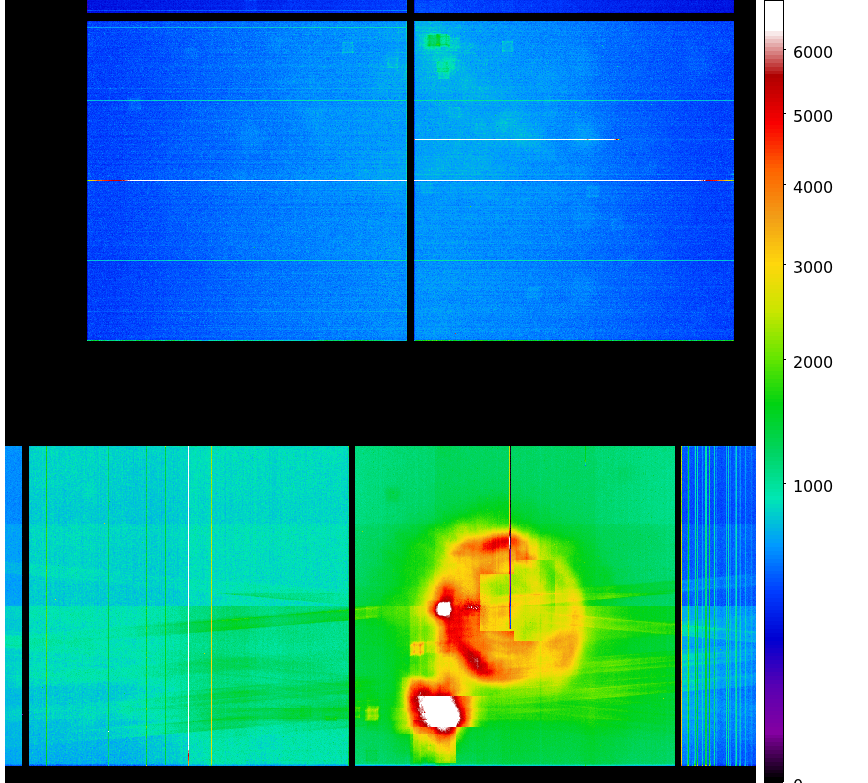
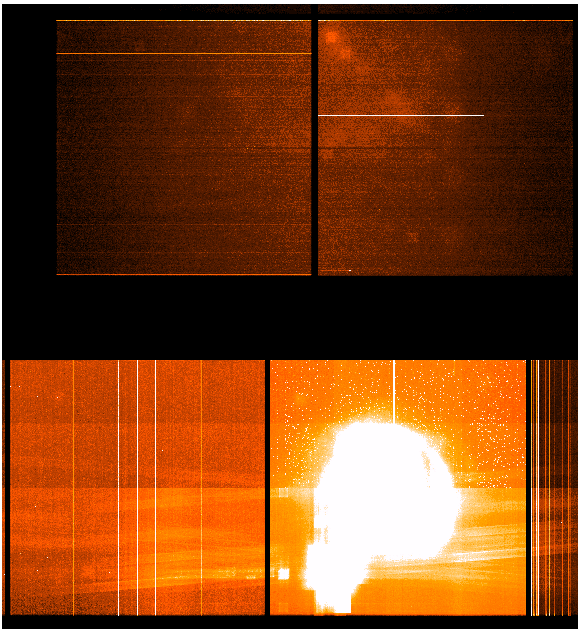
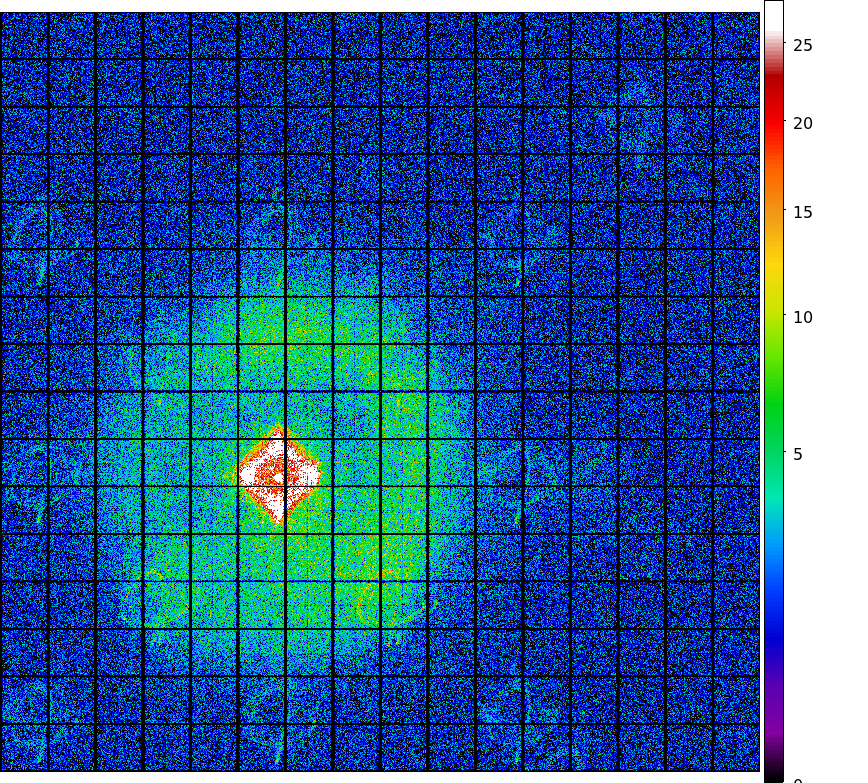
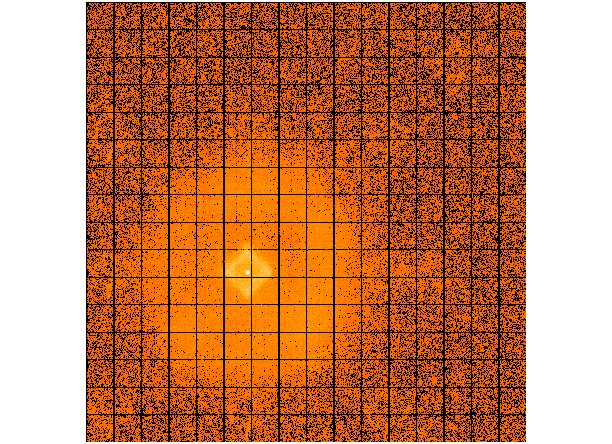
We updated ACIS cumulative dose map from this month. The steps we took to compute a new dose map are;
Please check more detail plots at Telemetered Photon Dose Trend page.
Statistics:
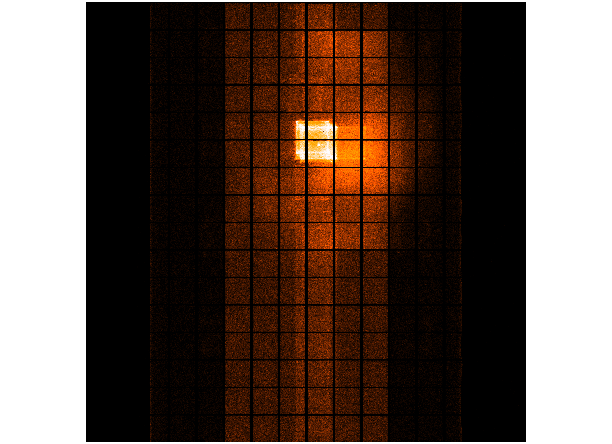
# IMAGE     NPIX      MEAN           RMS               MIN   MAX
ACIS_oct05 6004901    10.231        16.481             0.0   686.0

 I2 node 0  262654      8.619736        3.393337        0.0      42.0
 I2 node 1  262654      9.093734        3.718098        0.0     144.0
 I2 node 2  262654      9.089314        3.562421        0.0     149.0
 I2 node 3  262654      8.984142        3.739477        0.0      59.0

 I3 node 0  262654      9.499500        3.967538        0.0      98.0
 I3 node 1  262654      10.601486       8.615846        0.0     507.0
 I3 node 2  262654      9.744377        3.715868        0.0      54.0
 I3 node 3  262654      9.065525        3.517425        0.0     157.0

 S2 node 0  262654      13.688756       4.057378        0.0     148.0
 S2 node 1  262654      14.479260       4.930335        1.0     120.0
 S2 node 2  262654      17.716893       6.236616        2.0     115.0
 S2 node 3  262654      18.567577       6.928959        1.0     451.0

 S3 node 0  262654      18.775352       25.652285       1.0     317.0
 S3 node 1  262654      24.819542       34.436191       0.0     338.0
 S3 node 2  262654      19.907380       9.233953        1.0      78.0
 S3 node 3  262654      15.032656       5.749239        0.0      58.0
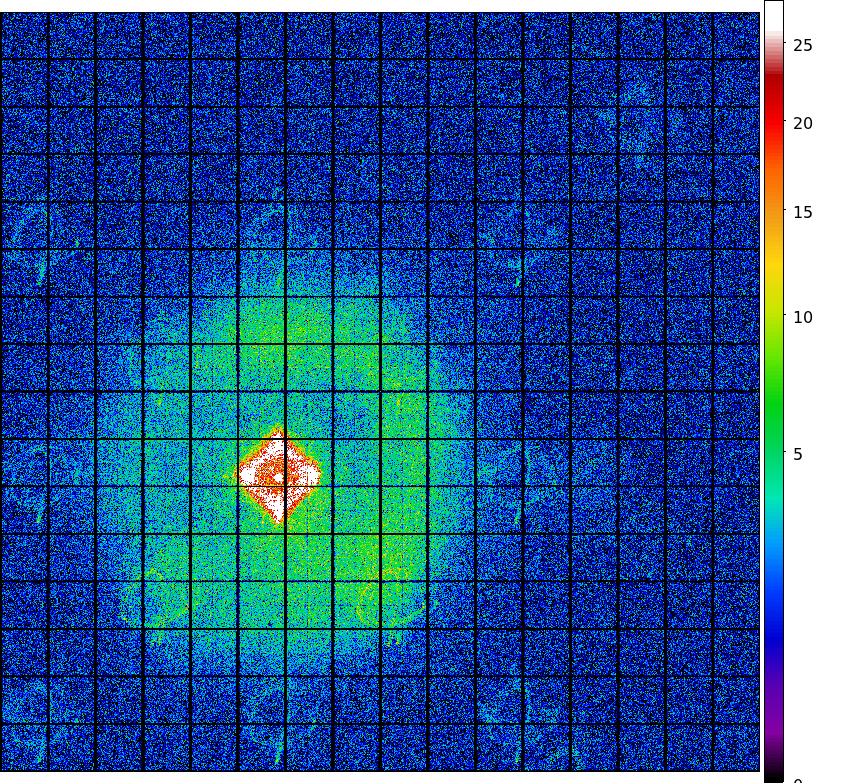
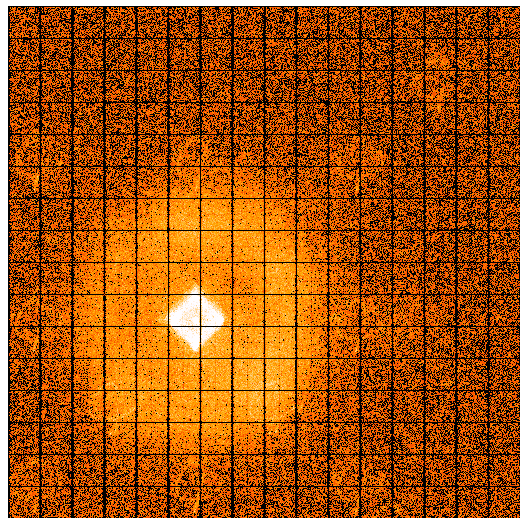
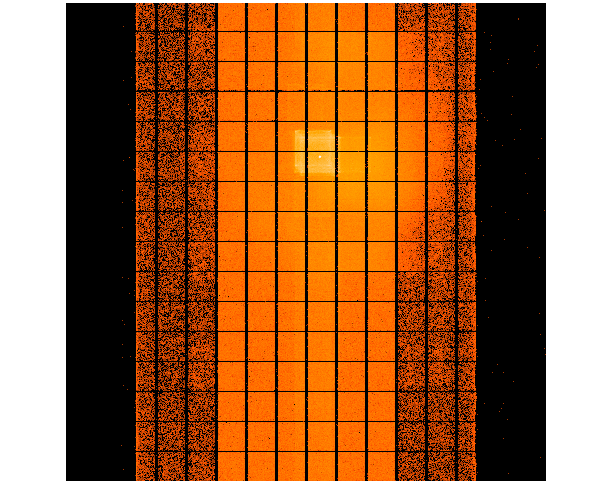
Statistics:
 IMAGE        NPIX      MEAN          RMS              MIN    MAX
ACIS_total  6004901   810.916       1158.384           0.0  47853.0

 I2 node 0  262654      560.526390      96.931936       0.0     2127.0
 I2 node 1  262654      590.144326      133.899992      0.0     2541.0
 I2 node 2  262654      594.040527      105.056992      0.0     1937.0
 I2 node 3  262654      593.988789      134.057441      0.0     2755.0

 I3 node 0  262654      640.911679      155.799613      0.0     3184.0
 I3 node 1  262654      662.848610      433.672668      0.0     11912.0
 I3 node 2  262654      593.731325      96.427881       0.0     2191.0
 I3 node 3  262654      587.937004      105.305954      0.0     10873.0

 S2 node 0  262654      909.999150      113.564748      408.0   3058.0
 S2 node 1  262654      955.096028      189.432397      411.0   4667.0
 S2 node 2  262654      1089.107855     218.145177      564.0   7998.0
 S2 node 3  262654      1072.385357     178.997465      570.0   5759.0

 S3 node 0  262654      1847.092459     1086.418358     639.0   9704.0
 S3 node 1  262654      2967.907902     1632.565803     0.0     10662.0
 S3 node 2  262654      2038.068041     704.970972      548.0   4655.0
 S3 node 3  262654      1470.229602     264.174257      681.0   3550.0
|
|
|
|
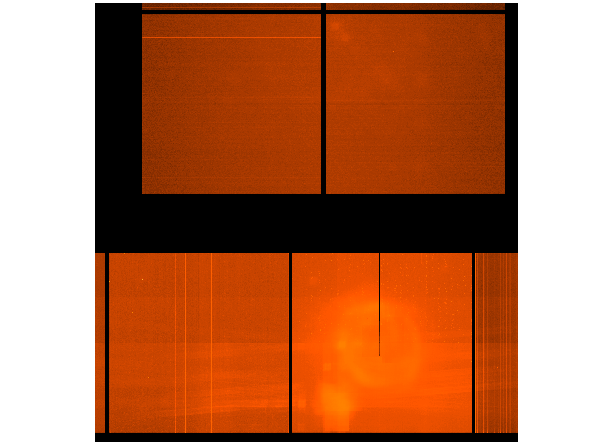
| Jul 2005 | Apr 2005 | Jan 2005 | Oct 2004 |
|---|
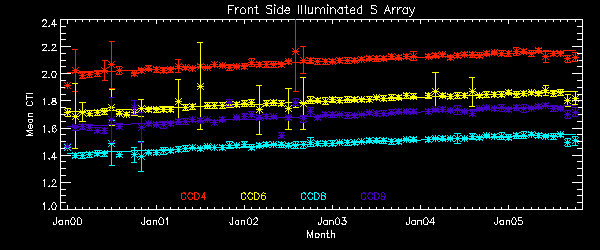
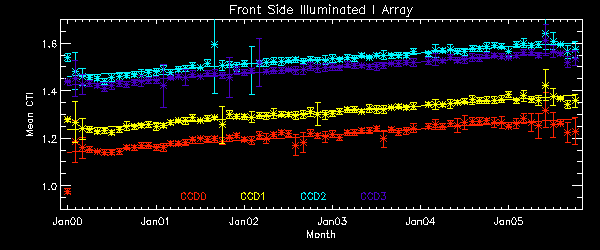
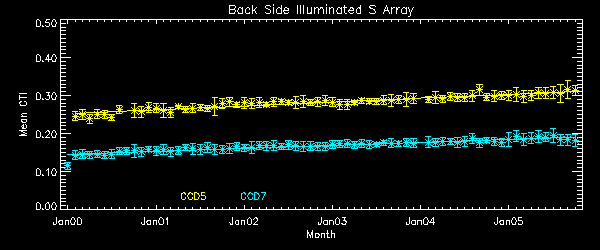
We report CTIs with a refined data definition. CTIs were computed for the temperature
dependency corrected data.
Please see
new CTI page
for detailed explanation.
CTI's are computed for Mn K alpha, and defined as slope/intercept x10^4 of row # vs ADU.
Data file here
September and October 2005 points are miscorrected. The temperature is unknown
due to the DEA reboot glitch, causing the focal plane temperature to be
uncalibrated.
       The Mean (max) FPT: -117.99      std dev: 0.92
               mean width:    0.52 days std dev: 0.41
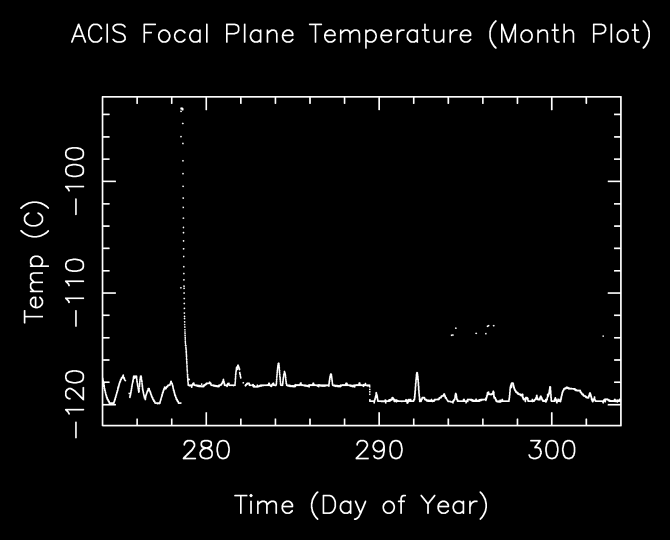

The following is a plot of focal plane temperature and sun angle, earth angle, and altitude.

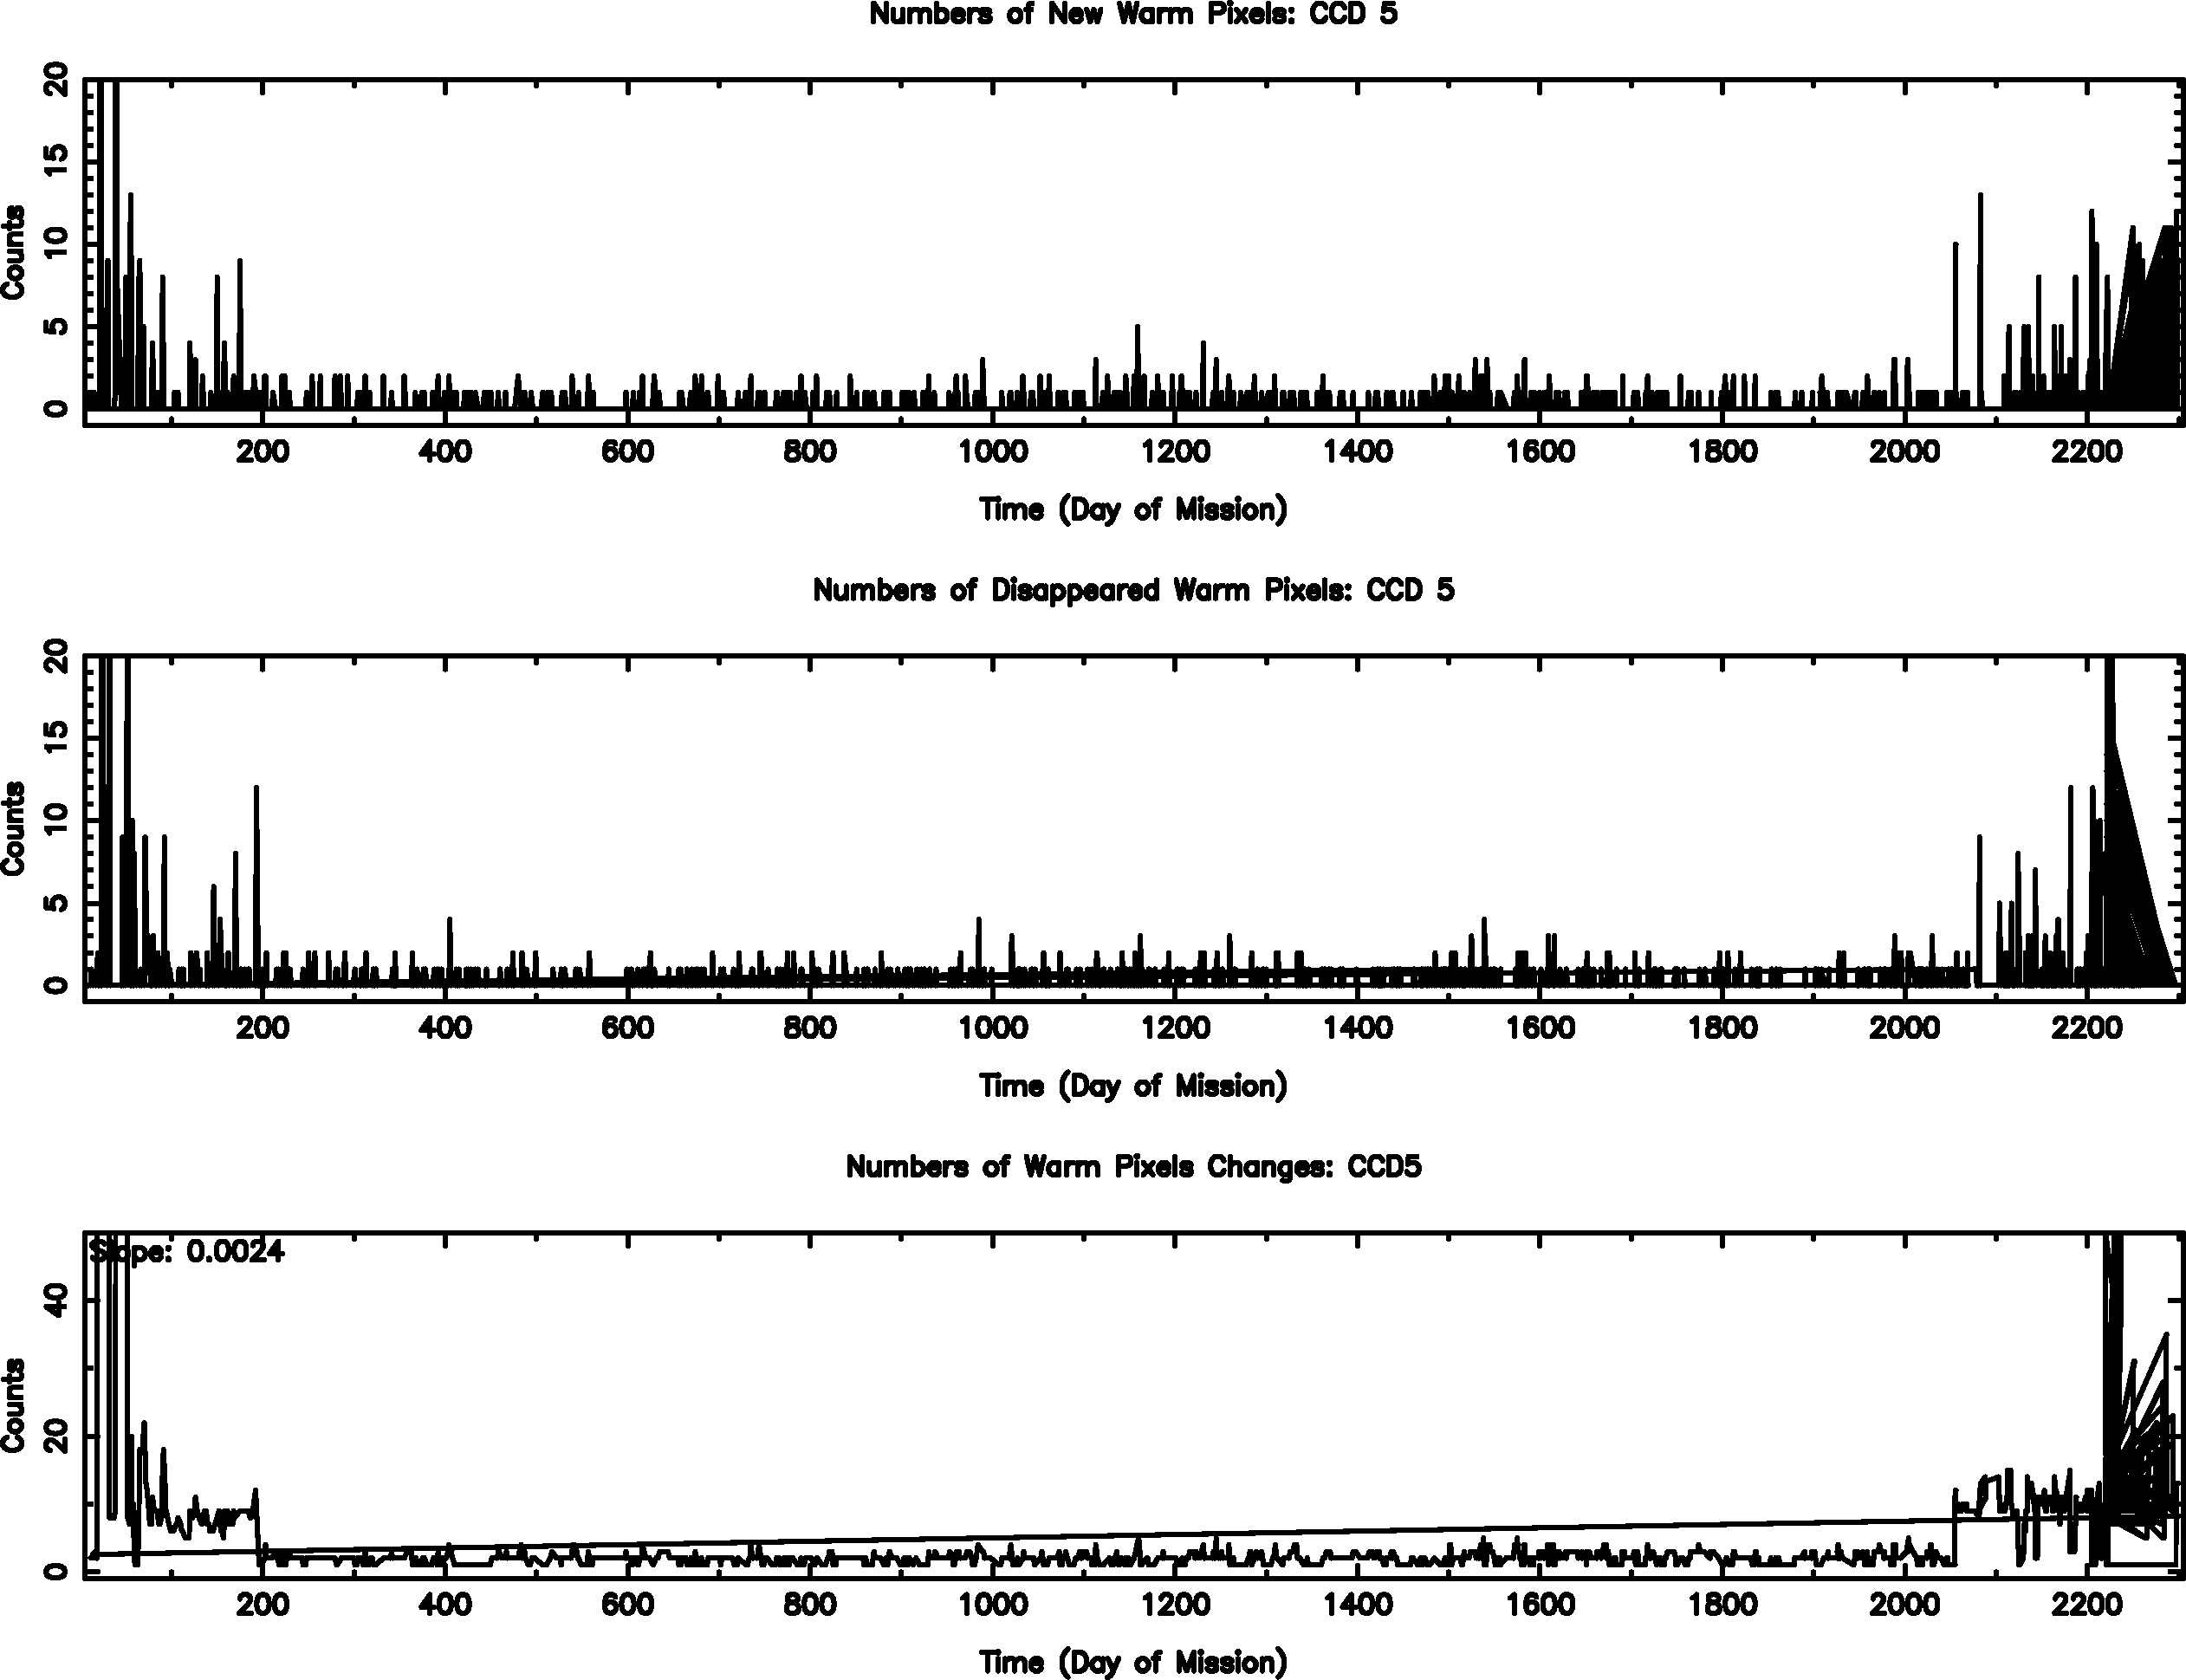
The plots below were generated with a new warm pixel finding script. Please see Acis Bad Pixel Page for details.
Front Side CCDs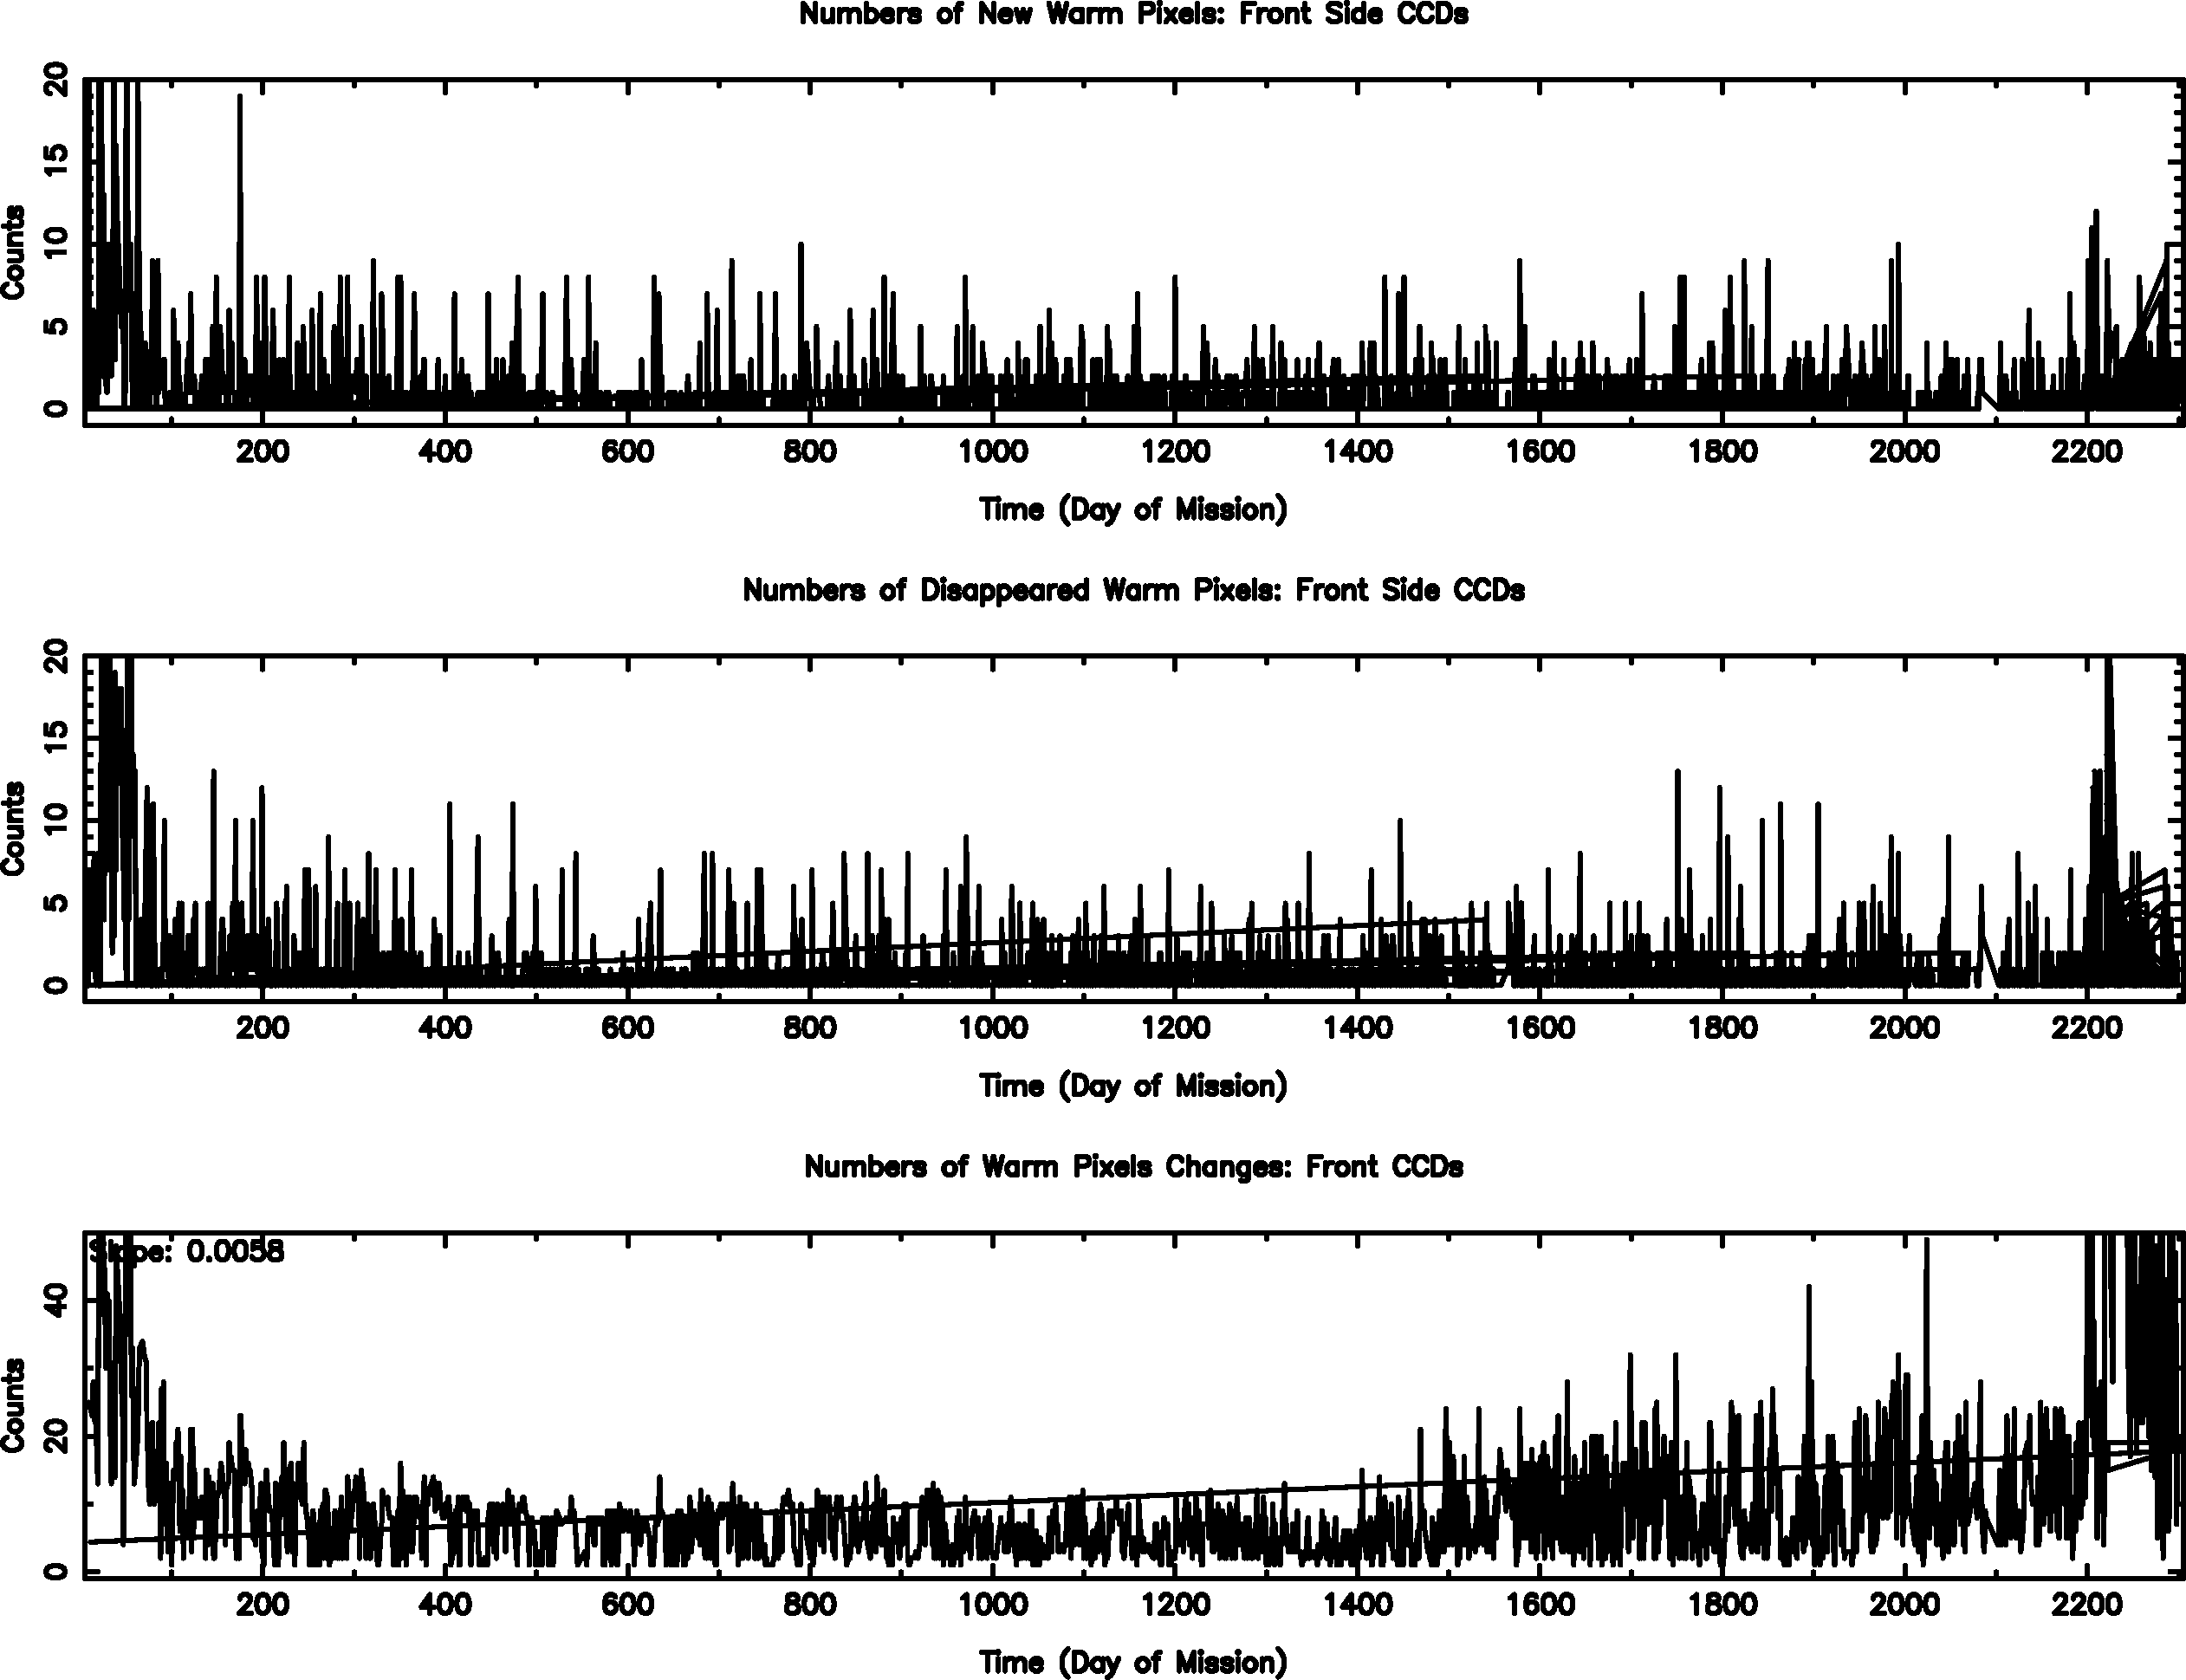
Back Side CCD (CCD5)
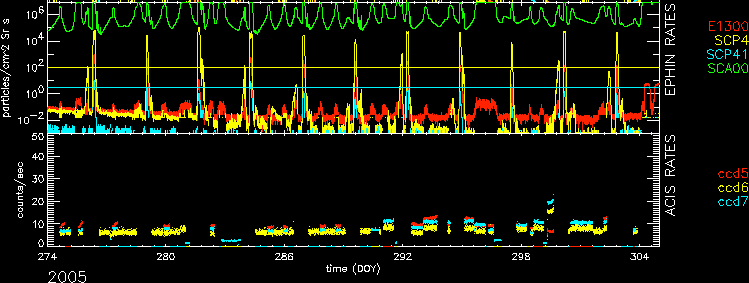
| Name | Low (keV) | High(KeV) | Description |
|---|---|---|---|
| SSoft | 0.00 | 0.50 | Super soft photons |
| Soft | 0.50 | 1.00 | Soft photons |
| Med | 1.00 | 3.00 | Moderate energy photons |
| Hard | 3.00 | 5.00 | Hard Photons |
| Harder | 5.00 | 10.00 | Very Hard photons |
| Hardest | 10.00 | Beyond 10 keV |
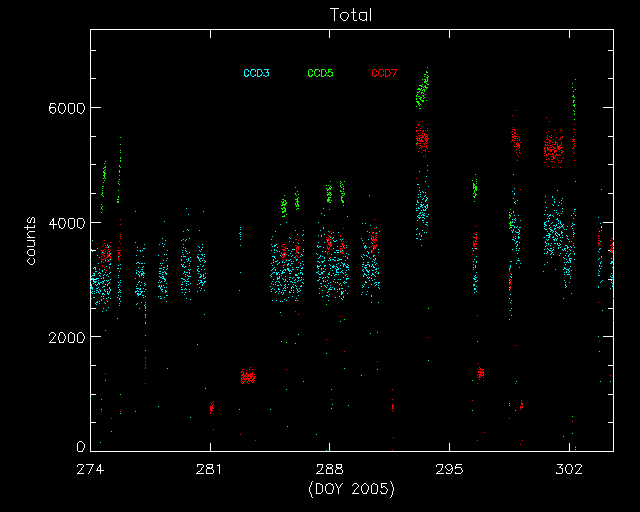
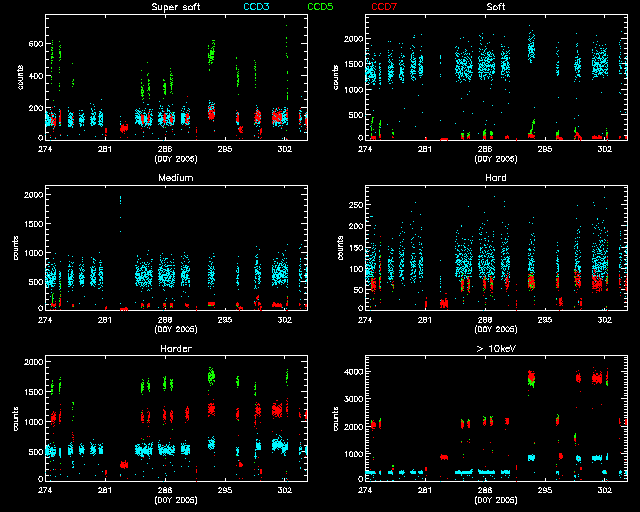
From this month, we trend 10th brightest data points instead of the maximum. This makes the maximum trend values to be about 20% lower than the previous months.
        IMAGE                NPIX      MEAN    STDDEV      MIN       MAX
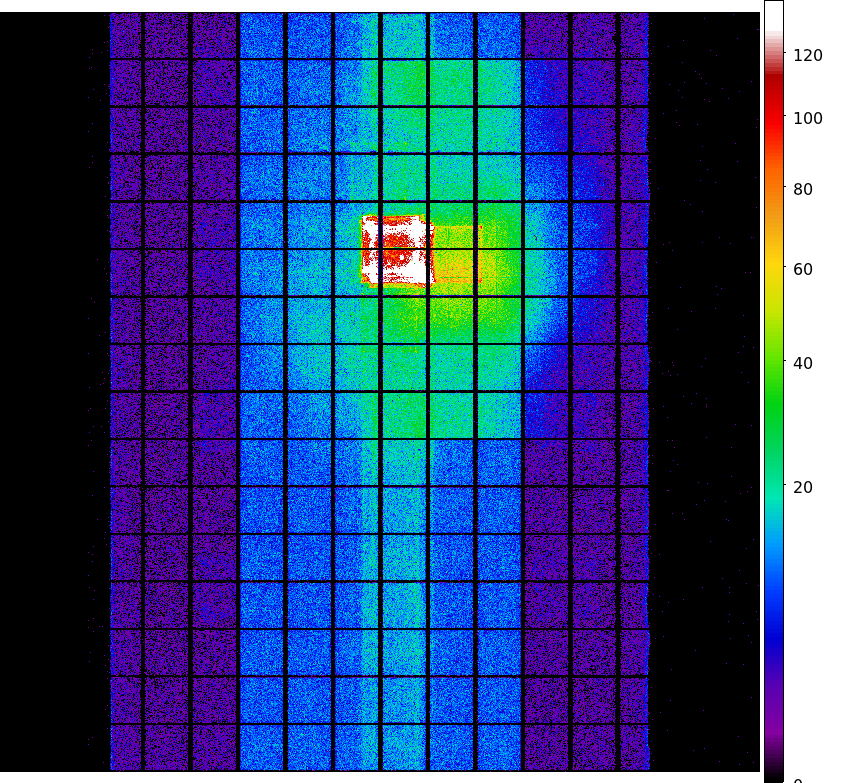
HRCI_10_2005.fits          16777216  0.0518    0.2372      0.0       9.0
        IMAGE                NPIX      MEAN    STDDEV      MIN       MAX
HRCI_08_1999_10_2005.fits  16777216  1.8991    3.0526      0.0       285.0
        IMAGE                NPIX      MEAN    STDDEV      MIN       MAX
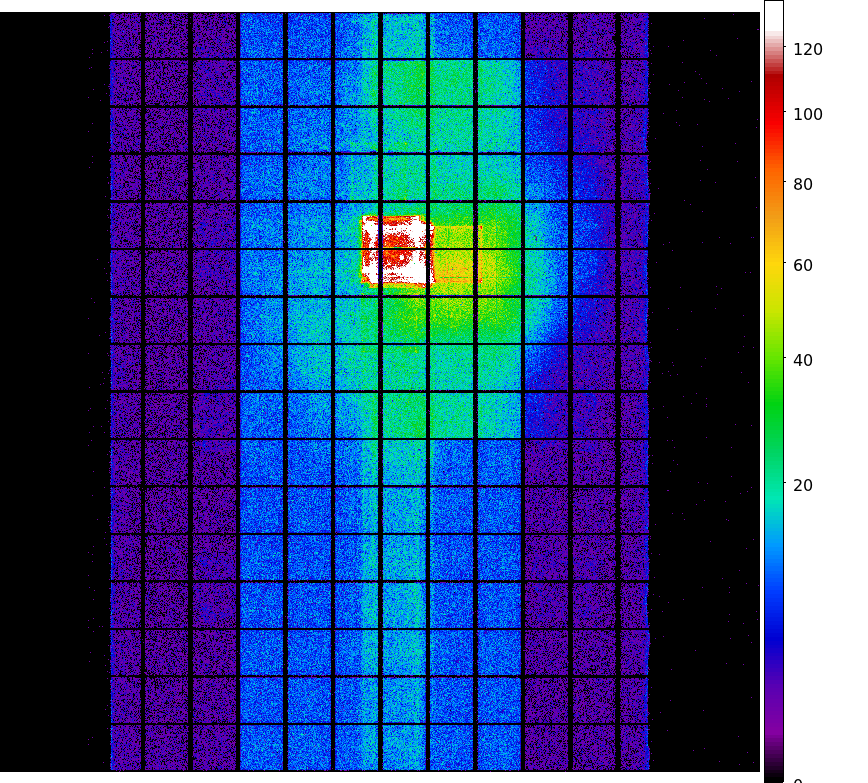
HRCS_10_2005.fits          16777216  0.0578    0.2717      0.0       15.0
        IMAGE                NPIX     MEAN      STDDEV      MIN      MAX
HRCS_08_1999_10_2005.fits  16777216  6.3676    14.1762      0.0      1503.0
We display a max dose trend plot corrected for events that "pile-up" in the center of the taps due to bad position information.

|
|
|
|
| Jul 2005 | Apr 2005 | Jan 2005 | Oct 2004 |
|---|
|
|
|
|
| Jul 2005 | Apr 2005 | Jan 2005 | Oct 2004 |
|---|

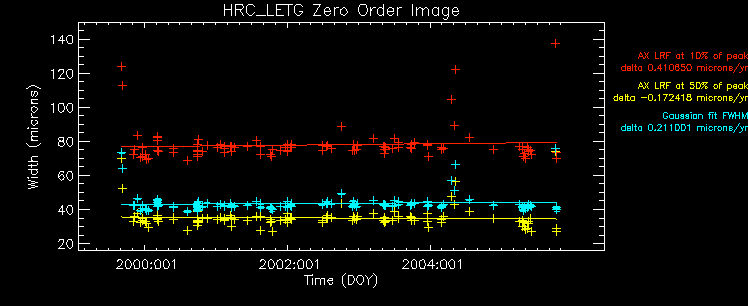
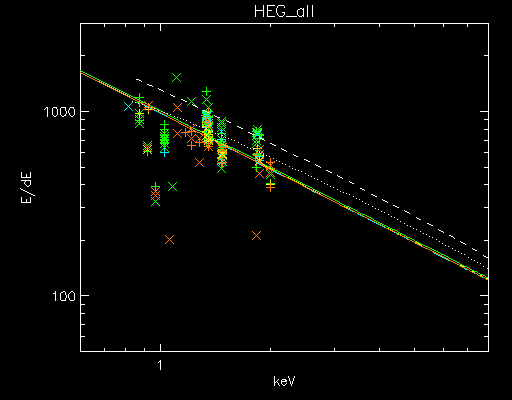
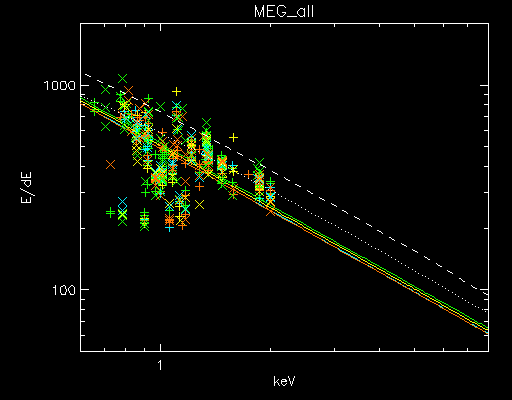
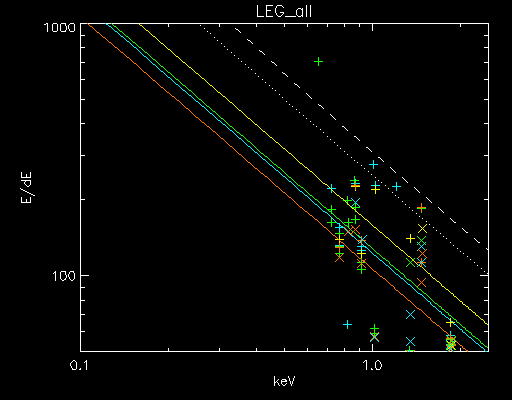
| Plot symbol indicates dispersion arm: | Color indicates observation date: |
Minus side = cross (x) |
2001-2002 blue 2003-2004 yellow 2005 orange |
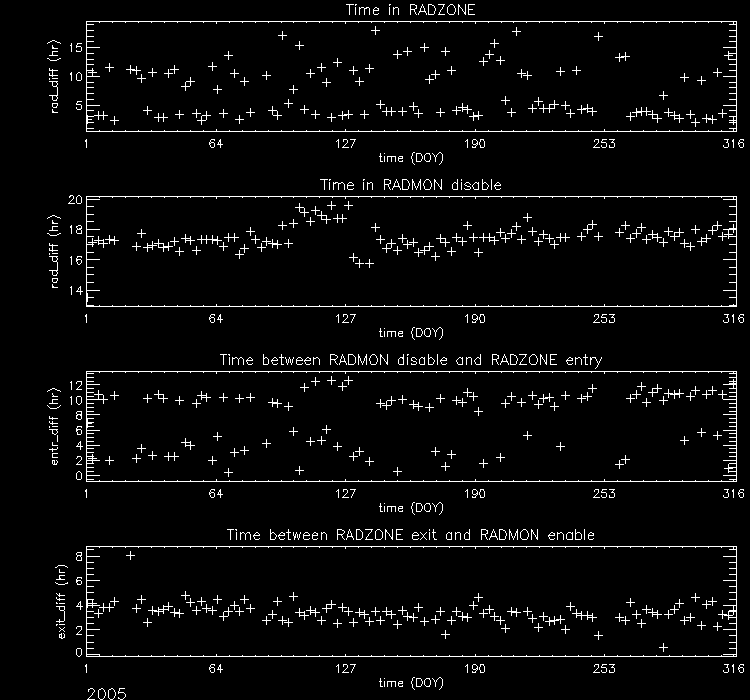
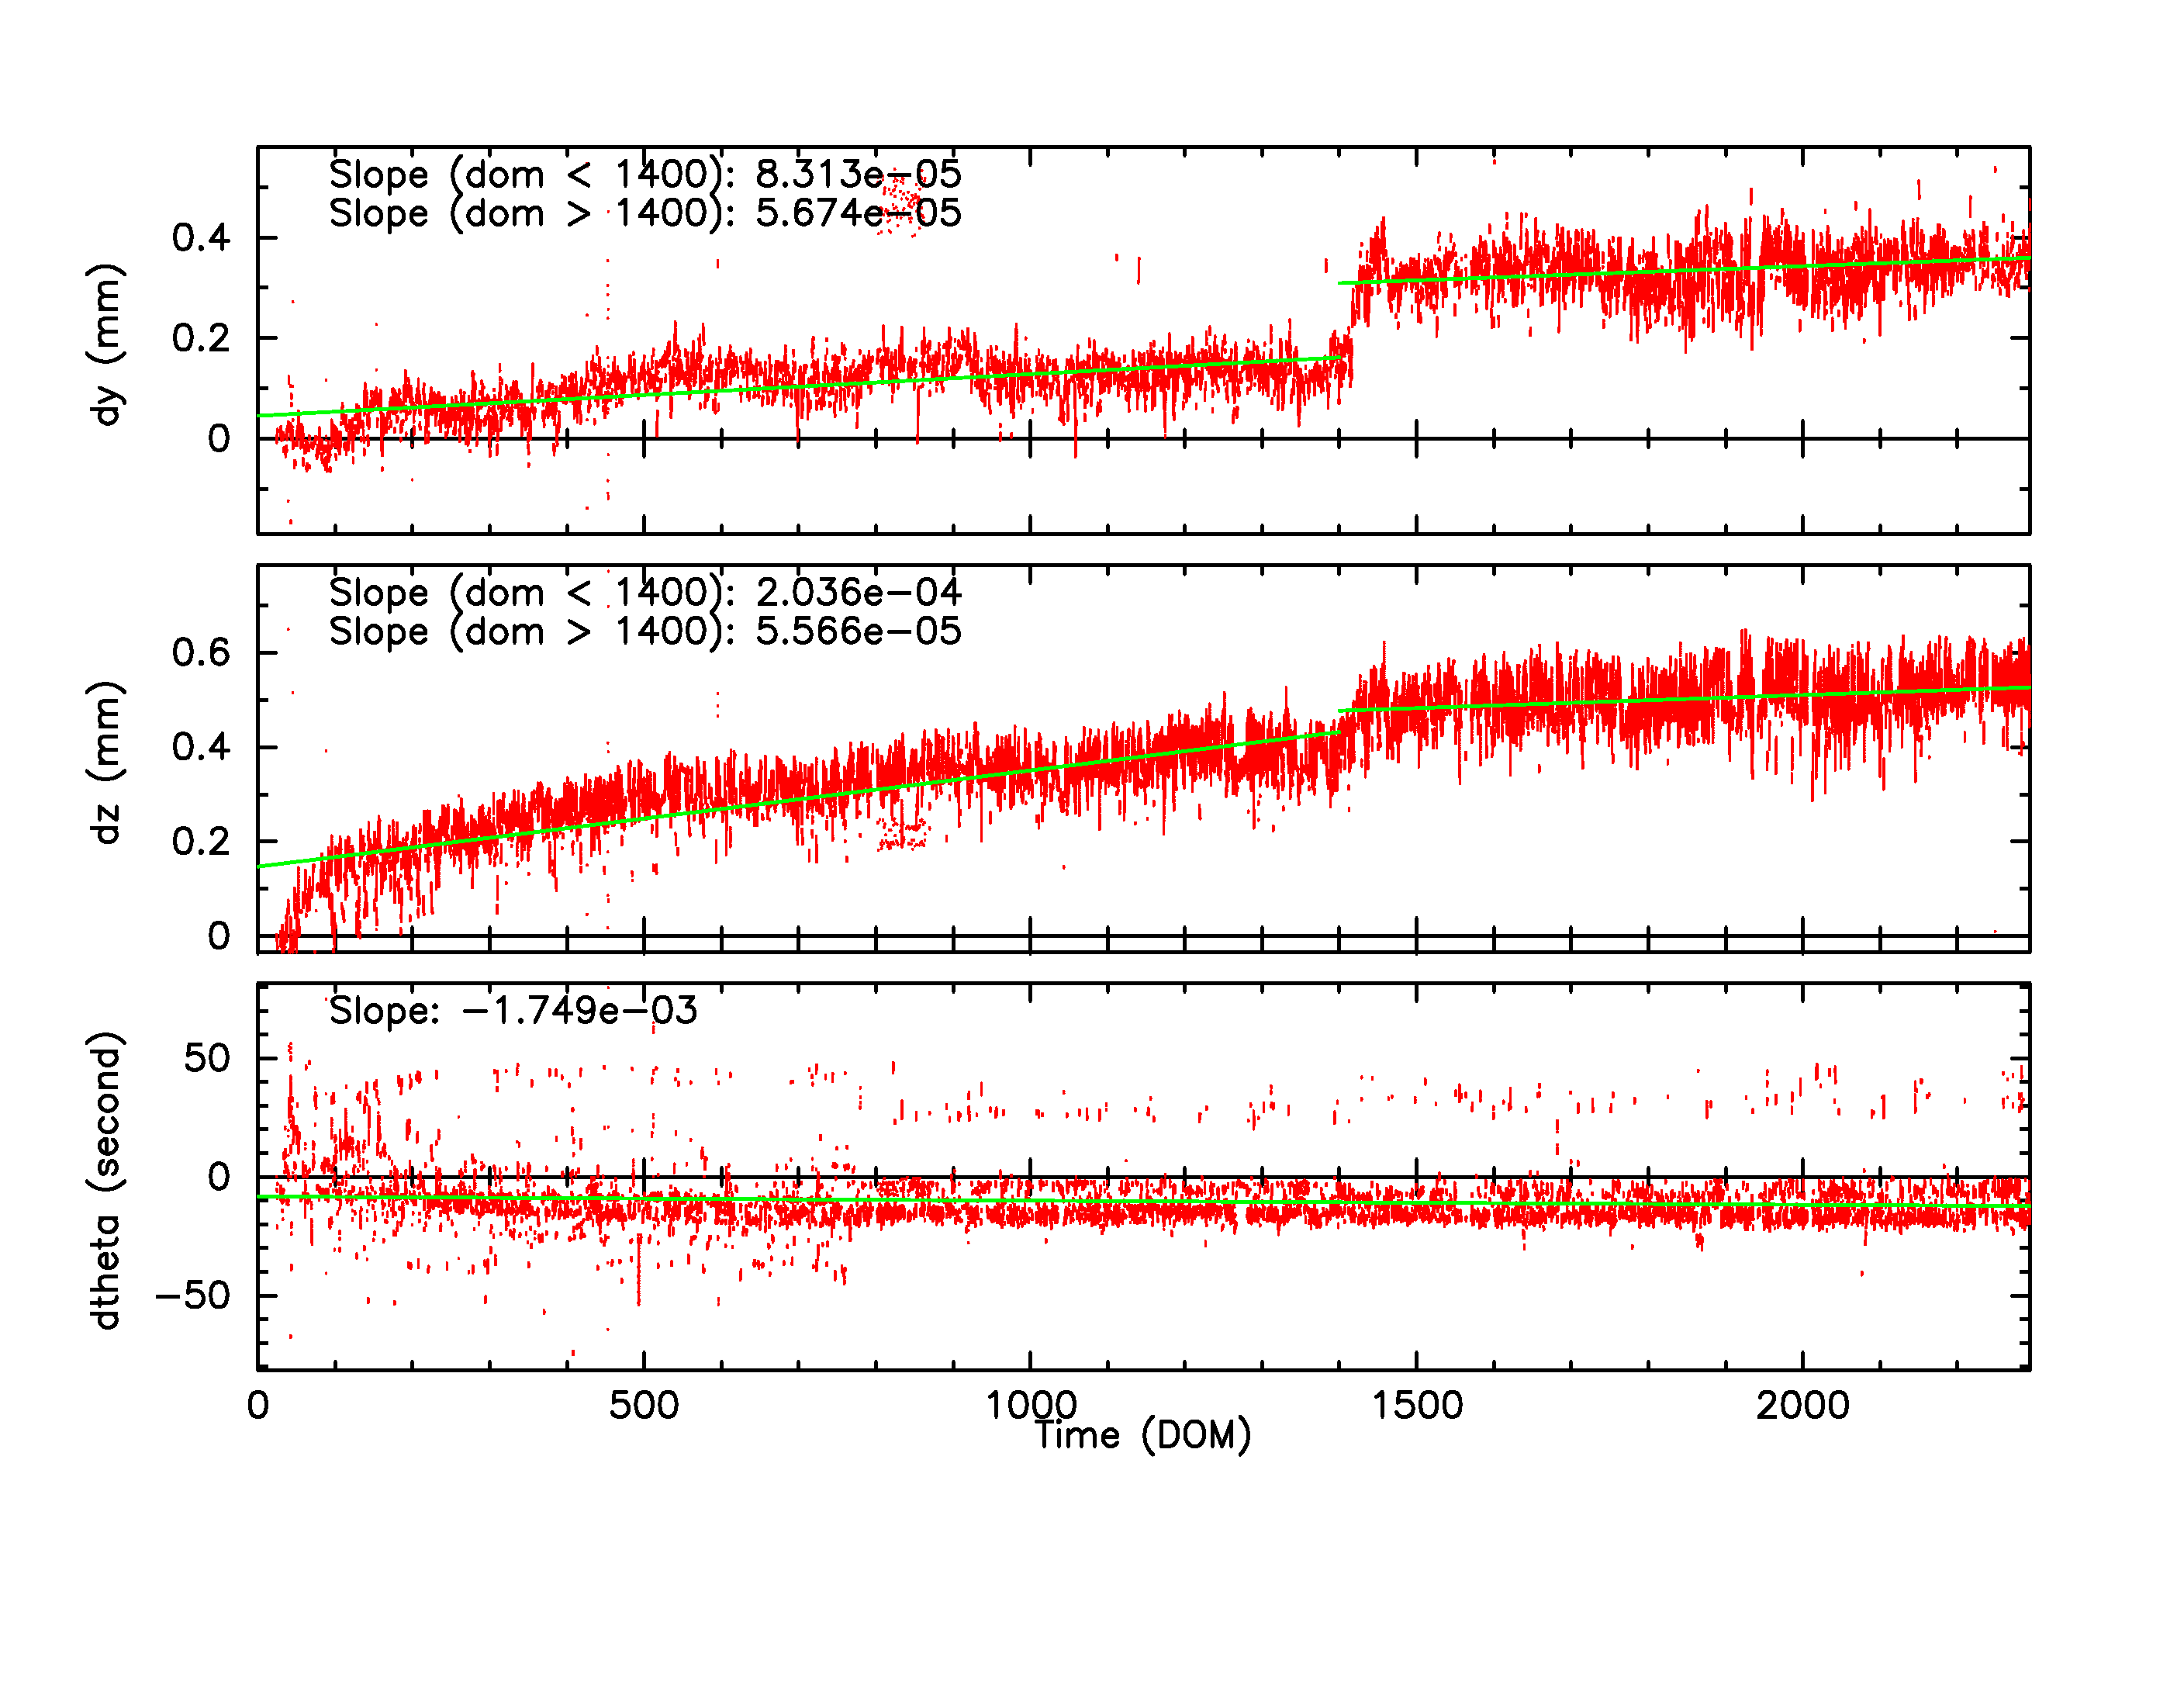
SIM Shift and Twist Trend The following plots show trends of SIM shifts (dy and dz) and twist (dtheta). All quantities are directly taken from pcaf*_asol1.fits files. The units are mm for dy and dz, and degree for dtheta. We fit two lines separated before and after (Days of Mission)= 1400 (May 21, 2003). The unit of slopes are mm per day or degree per day.
The sudden shift around DOM = 1400 was due to fid light drift (see a memo by Aldcroft
fiducial light drfit). On the dtheta plot, two tracks
are clearly observed. The track around 0.01 is due to HRC-I, and all others are clustered around -0.002.
For more detail, please see
SIM Shift and Twist Trend page
SIM Motor Temperature
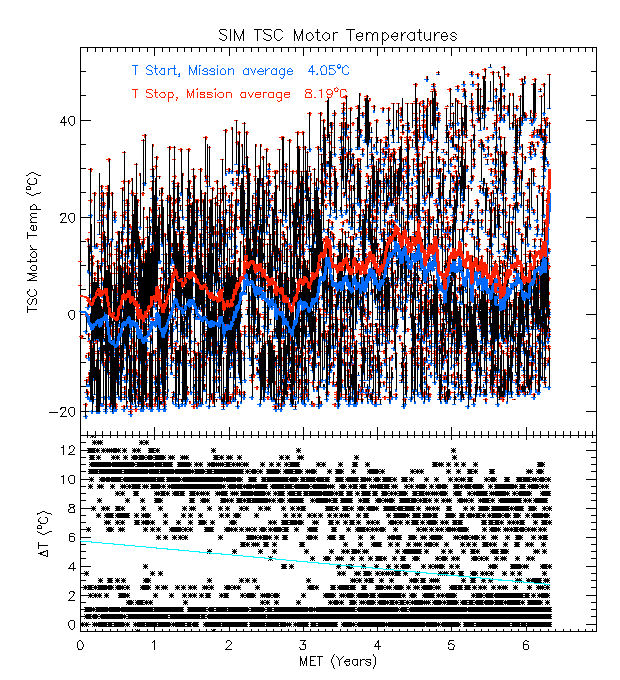
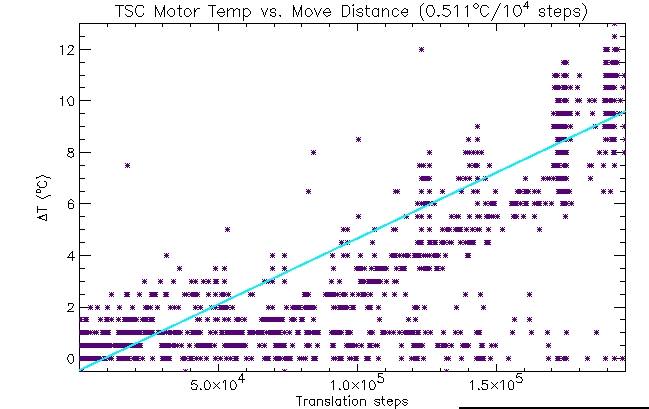
We track the SIM Translation Drive Motor Temperature using msid 3TRMTRAT. Below are plots for the entire mission showing temperature changes during each translation. Solid lines indicate the start temperatures (blue) and stop temperatures (red) smoothed by a factor of 100. Also plotted is spacecraft pitch angle (pt_suncent_ang) for reference. We explore the relationship between delta T and attitude and delta T vs. move distance.
| Previous Quarter | ||||||
| MSID | MEAN | RMS | DELTA/YR | DELTA/YR/YR | UNITS | DESCRIPTION |
| AOGBIAS1 | -4.561e-06 | 4.547e-08 | -6.338e-07 | 6.927e-07 | RADPS | GYRO DRIFT RATE ESTIMATE (ROLL) |
| AOGBIAS2 | -9.990e-06 | 2.228e-08 | -3.028e-07 | -3.457e-07 | RADPS | GYRO DRIFT RATE ESTIMATE (PITCH) |
| AOGBIAS3 | -5.763e-06 | 2.631e-08 | -3.652e-07 | 4.087e-07 | RADPS | GYRO DRIFT RATE ESTIMATE (YAW) |
| Previous Quarter | ||||||
| MSID | MEAN | RMS | DELTA/YR | DELTA/YR/YR | UNITS | DESCRIPTION |
| PFTANK1T | 2.970e+02 | 1.280e+00 | -1.828e+00 | -6.669e+01 | K | FUEL TANK TEMP 01 |
| PFTANK2T | 2.958e+02 | 6.020e-01 | -6.215e-01 | -3.095e+01 | K | FUEL TANK TEMP 02 |
| PLINE01T | 2.883e+02 | 1.486e+00 | -1.169e+00 | -5.844e+01 | K | PROP LINE TEMP 01 |
| PLINE02T | 3.066e+02 | 9.378e+00 | 2.608e+01 | 2.829e+02 | K | PROP LINE TEMP 02 |
| PLINE03T | 3.098e+02 | 1.098e+01 | 2.929e+01 | 4.586e+02 | K | PROP LINE TEMP 03 |
| PLINE04T | 2.952e+02 | 8.671e+00 | 2.307e+01 | 3.881e+02 | K | PROP LINE TEMP 04 |
| PLINE05T | 2.941e+02 | 5.045e+00 | 1.970e+01 | 3.338e+02 | K | PROP LINE TEMP 05 |
| Previous Quarter | ||||||
| MSID | MEAN | RMS | DELTA/YR | DELTA/YR/YR | UNITS | DESCRIPTION |
| EB1CI | 3.424e-01 | 9.478e-03 | 8.509e-02 | 2.786e-01 | AMP | BATT 1 CHARGE CURRENT |
| EB1DI | 2.159e-02 | 2.850e-03 | -8.413e-03 | -3.147e-01 | AMP | BATT 1 DISCHARGE CURRENT |
| EB1V | 3.259e+01 | 3.497e-02 | 2.944e-01 | -6.609e+00 | V | BATT 1 VOLTAGE |
| EB2CI | 3.521e-01 | 9.522e-03 | 7.713e-02 | -4.668e-02 | AMP | BATT 2 CHARGE CURRENT |
| EB2DI | 1.500e-02 | 0.000e+00 | 0.000e+00 | 0.000e+00 | AMP | BATT 2 DISCHARGE CURRENT |
| EB2V | 3.259e+01 | 4.703e-02 | 4.242e-01 | -8.330e+00 | V | BATT 2 VOLTAGE |
| EB3CI | 3.409e-01 | 1.058e-02 | 8.941e-02 | 7.686e-02 | AMP | BATT 3 CHARGE CURRENT |
| EB3DI | 1.500e-02 | 0.000e+00 | 0.000e+00 | 0.000e+00 | AMP | BATT 3 DISCHARGE CURRENT |
| EB3V | 3.230e+01 | 5.318e-02 | 5.699e-01 | -7.050e+00 | V | BATT 3 VOLTAGE |
| ECNV1V | 1.489e+01 | 3.064e-03 | -3.717e-03 | 3.115e-02 | V | CONV 1 +15V OUTPUT |
| ECNV2V | 1.483e+01 | 7.031e-03 | -6.862e-03 | 5.699e-02 | V | CONV 2 +15V OUTPUT |
| ECNV3V | 1.531e+01 | 2.962e-03 | -1.555e-03 | -7.191e-03 | V | CONV 3 +15V OUTPUT |
| Previous Quarter | ||||||
| MSID | MEAN | RMS | DELTA/YR | DELTA/YR/YR | UNITS | DESCRIPTION |
| TSCIUSF1 | 2.955e+02 | 3.268e+01 | 3.975e+01 | -4.278e+02 | K | SC-IUS FITTING-1 TEMP |
| TSCIUSF2 | 2.634e+02 | 1.783e+01 | 2.676e+01 | -4.901e+02 | K | SC-IUS FITTING-2 TEMP |
| TSCIUSF5 | 2.454e+02 | 1.174e+01 | 3.004e+01 | 7.269e+02 | K | SC-IUS FITTING-5 TEMP |
| TSCIUSF8 | 2.911e+02 | 3.478e+01 | 4.087e+01 | -4.391e+02 | K | SC-IUS FITTING-8 TEMP |
| TSCTSF1 | 2.881e+02 | 2.335e+00 | 1.343e+00 | 1.278e+02 | K | SC-TS FITTING -1 TEMP |
| TSCTSF2 | 2.732e+02 | 1.087e+00 | 1.766e+00 | 3.905e+01 | K | SC-TS FITTING -2 TEMP |
| TSCTSF3 | 2.633e+02 | 6.494e-01 | 1.590e+00 | 2.522e+01 | K | SC-TS FITTING -3 TEMP |
| TSCTSF4 | 2.668e+02 | 9.450e-01 | 1.600e+00 | 1.556e+01 | K | SC-TS FITTING -4 TEMP |
| TSCTSF5 | 2.758e+02 | 1.655e+00 | 1.241e+00 | 2.043e+01 | K | SC-TS FITTING -5 TEMP |
| TSCTSF6 | 2.875e+02 | 2.464e+00 | 1.105e+00 | 1.106e+02 | K | SC-TS FITTING -6 TEMP |
| Previous Quarter | ||||||
| MSID | MEAN | RMS | DELTA/YR | DELTA/YR/YR | UNITS | DESCRIPTION |
| AWD1CV5V | 5.319e+00 | 8.250e-04 | 1.764e-03 | 3.302e-02 | V | WDE-1 +5V CONVERTER VOLTAGE |
| AWD1TQI | -1.714e-01 | 4.148e-02 | -3.048e-02 | -5.552e-01 | AMP | WHEEL 1 TORQUE CURRENT |
| AWD2CV5V | 5.280e+00 | 3.431e-04 | -4.957e-06 | 3.645e-03 | V | WDE-2 +5V CONVERTER VOLTAGE |
| AWD2TQI | 1.008e-01 | 3.319e-02 | -6.941e-02 | -1.155e+00 | AMP | WHEEL 2 TORQUE CURRENT |
| AWD3CV5V | 5.312e+00 | 3.290e-03 | 6.143e-03 | 6.564e-02 | V | WDE-3 +5V CONVERTER VOLTAGE |
| AWD3TQI | -2.203e-01 | 3.880e-02 | 7.532e-04 | -2.454e-01 | AMP | WHEEL 3 TORQUE CURRENT |
| AWD4CV5V | 5.320e+00 | 0.000e+00 | 0.000e+00 | 0.000e+00 | V | WDE-4 +5V CONVERTER VOLTAGE |
| AWD4TQI | 1.303e-01 | 3.988e-02 | 2.357e-02 | -9.285e-02 | AMP | WHEEL 4 TORQUE CURRENT |
| AWD5CV5V | 5.320e+00 | 0.000e+00 | 0.000e+00 | 0.000e+00 | V | WDE-5 +5V CONVERTER VOLTAGE |
| AWD5TQI | -1.706e-01 | 3.179e-02 | 4.614e-02 | 4.640e-01 | AMP | WHEEL 5 TORQUE CURRENT |
| AWD6CV5V | 5.280e+00 | 0.000e+00 | 0.000e+00 | 0.000e+00 | V | WDE-6 +5V CONVERTER VOLTAGE |
| AWD6TQI | 1.193e-01 | 4.056e-02 | -8.270e-03 | -2.028e-01 | AMP | WHEEL 6 TORQUE CURRENT |
| 
|

| Year | Month | |||||||||||
|---|---|---|---|---|---|---|---|---|---|---|---|---|
| 1999 | Jul | Aug | Sep | Oct | Nov | Dec | ||||||
| 2000 | Jan | Feb | Mar | Apr | May | Jun | Jul | Aug | Sep | Oct | Nov | Dec |
| 2001 | Jan | Feb | Mar | Apr | May | Jun | Jul | Aug | Sep | Oct | Nov | Dec |
| 2002 | Jan | Feb | Mar | Apr | May | Jun | Jul | Aug | Sep | Oct | Nov | Dec |
| 2003 | Jan | Feb | Mar | Apr | May | Jun | Jul | Aug | Sep | Oct | Nov | Dec |
| 2004 | Jan | Feb | Mar | Apr | May | Jun | Jul | Aug | Sep | Oct | Nov | Dec |
| 2005 | Jan | Feb | Mar | Apr | May | Jun | Jul | Aug | Sep | Oct | Nov | Dec |