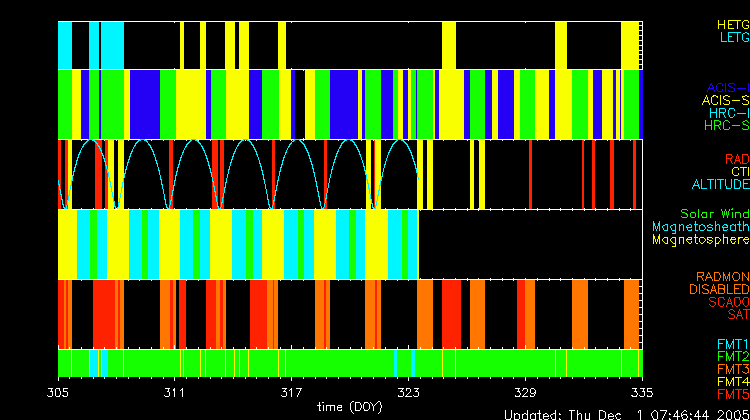

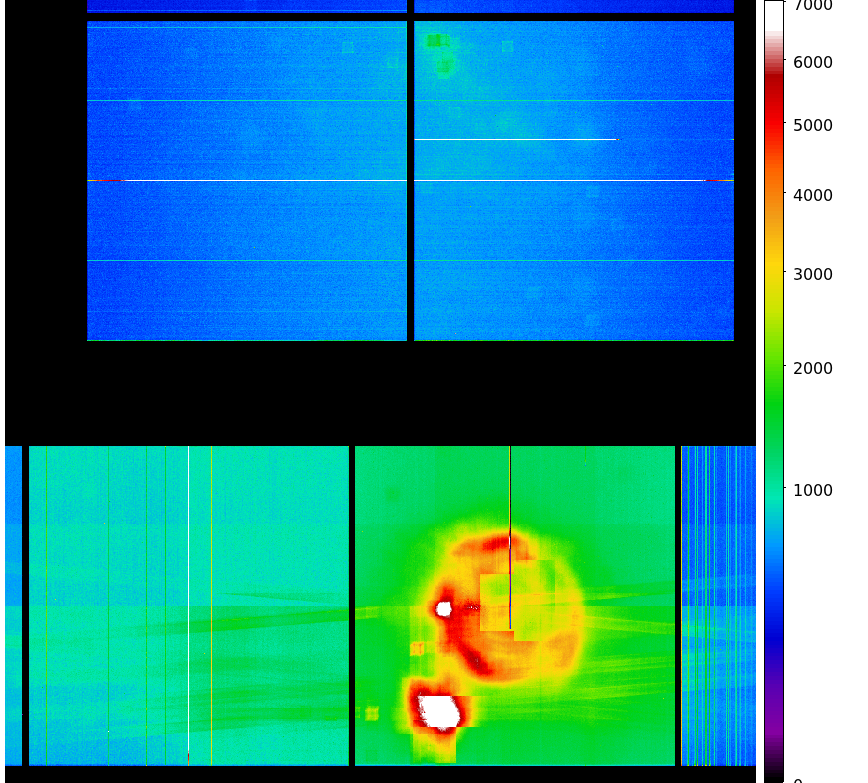
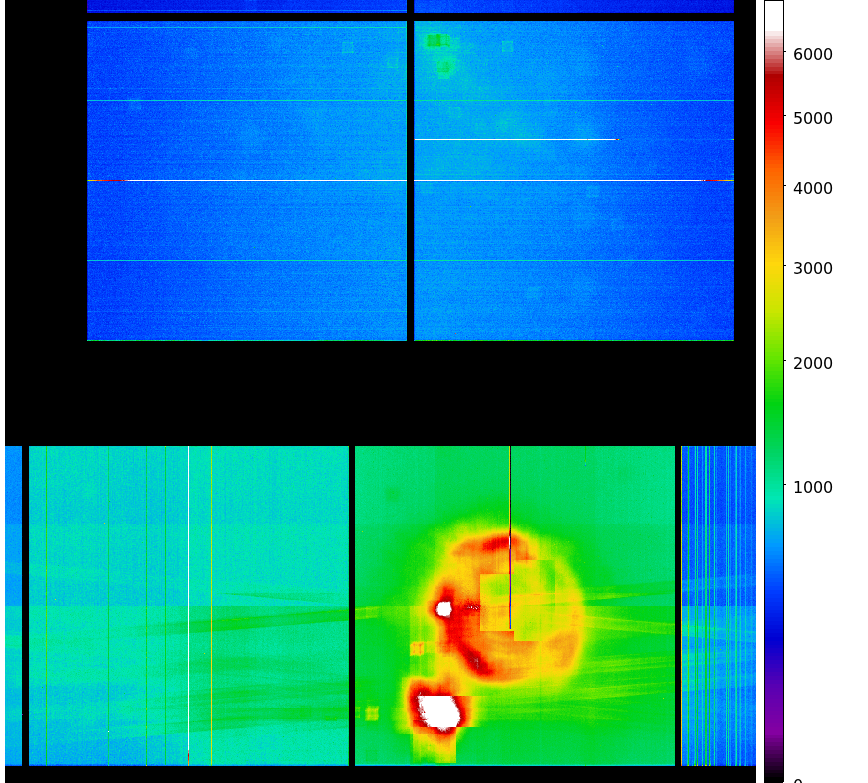
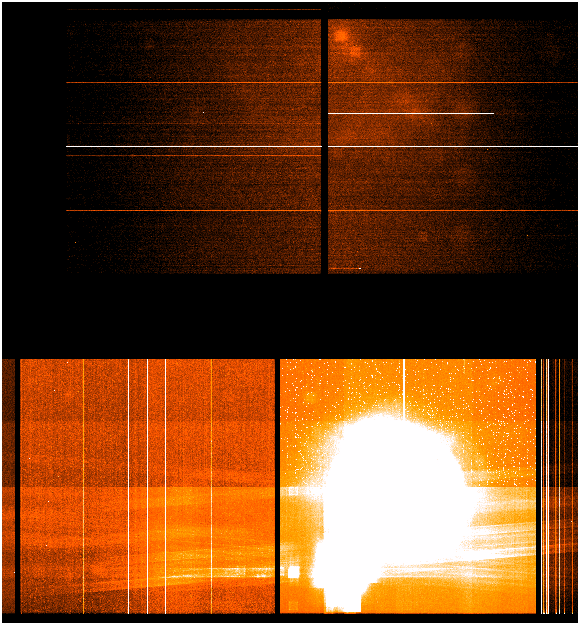
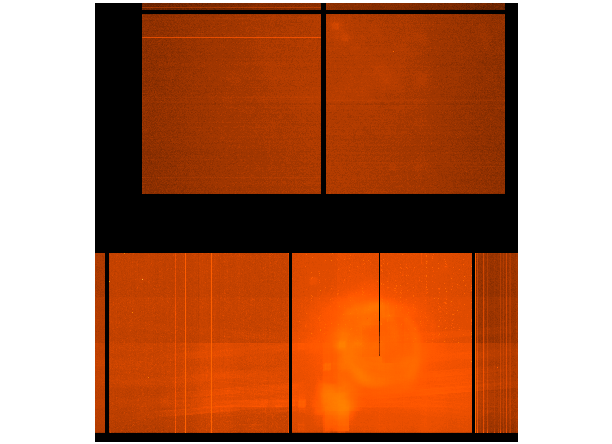
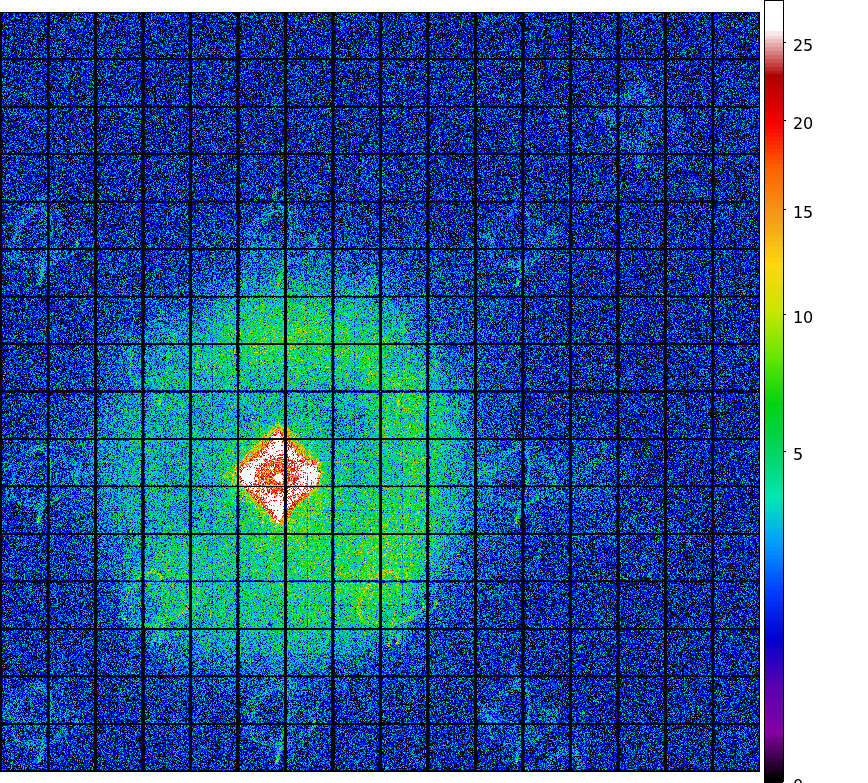
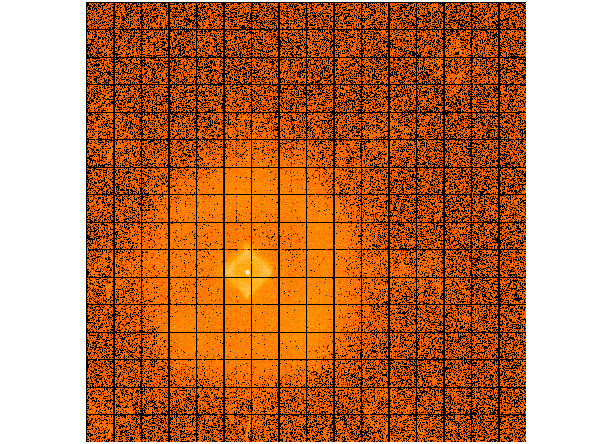
We updated ACIS cumulative dose map from this month. The steps we took to compute a new dose map are;
Please check more detail plots at Telemetered Photon Dose Trend page.
Statistics:
# IMAGE     NPIX      MEAN           RMS               MIN   MAX
ACIS_nov05 6004901    10.650        24.347             0.0   715.0

 I2 node 0  262654      10.255917       3.772056        0.0      39.0
 I2 node 1  262654      11.014191       4.222378        0.0     358.0
 I2 node 2  262654      11.306995       4.205951        0.0      71.0
 I2 node 3  262654      11.557454       4.671248        0.0      60.0

 I3 node 0  262654      15.506658       11.074338       0.0     257.0
 I3 node 1  262654      12.803806       9.344965        0.0     215.0
 I3 node 2  262654      10.559462       3.853488        0.0      48.0
 I3 node 3  262654      10.171162       3.779851        0.0     168.0

 I2 node 0  262654      12.726329       4.096924        0.0     102.0
 I2 node 1  262654      13.013247       4.753586        0.0      80.0
 I2 node 2  262654      13.402715       4.356347        0.0      90.0
 I2 node 3  262654      12.861956       4.045931        0.0     354.0

 I3 node 0  262654      21.710340       54.690563       0.0     658.0
 I3 node 1  262654      31.594993       77.462619       0.0     662.0
 I3 node 2  262654      14.261497       3.970942        0.0      41.0
 I3 node 3  262654      13.360524       3.823633        0.0      33.0
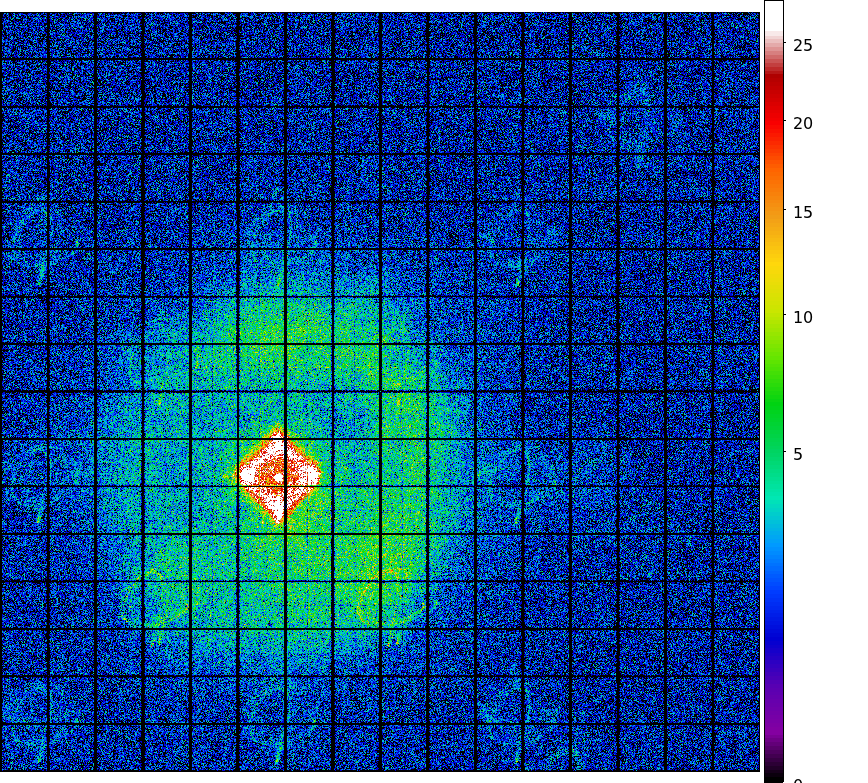
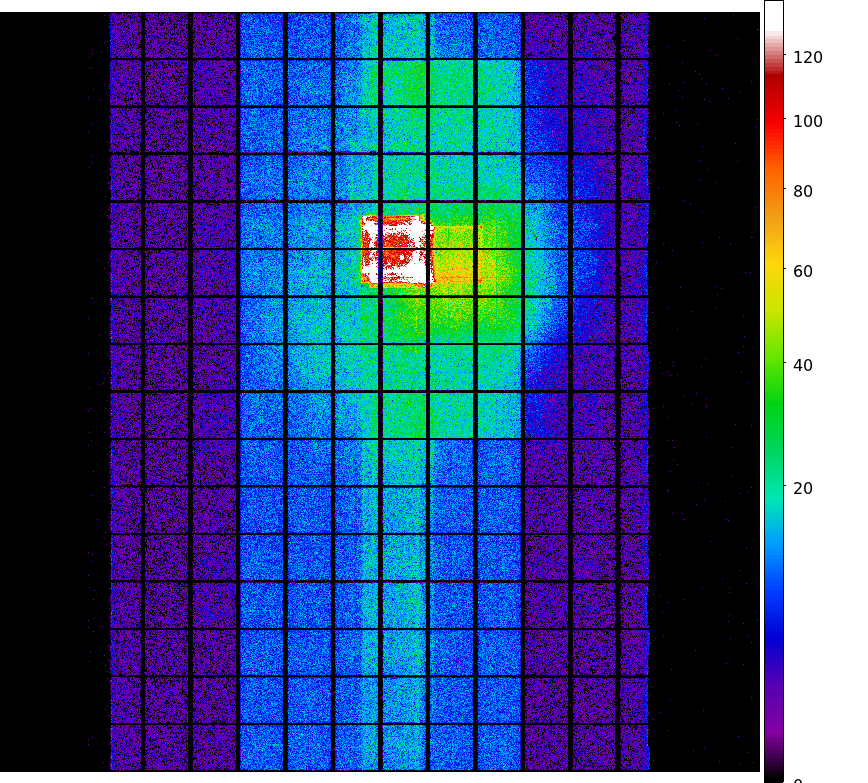
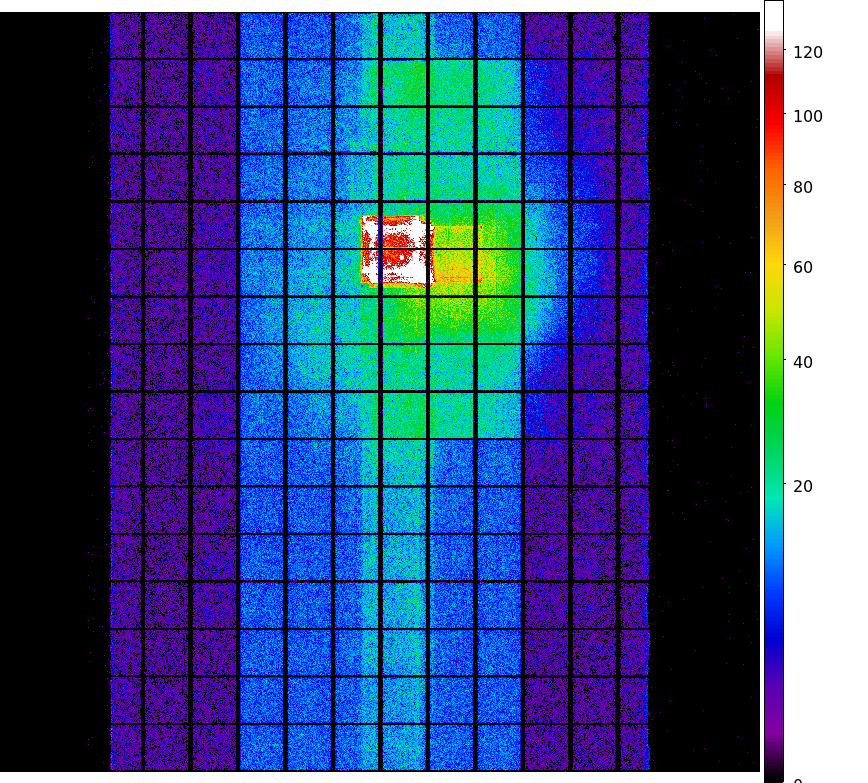
Statistics:
 IMAGE        NPIX      MEAN          RMS              MIN    MAX
ACIS_total  6004901   821.567       1175.212           0.0  48560.0

 I2 node 0  262654      570.782307      98.758361       0.0     2166.0
 I2 node 1  262654      601.158517      136.282616      0.0     2899.0
 I2 node 2  262654      605.347523      107.391588      0.0     1969.0
 I2 node 3  262654      605.546243      136.984503      0.0     2803.0

 I3 node 0  262654      656.418337      162.677820      0.0     3233.0
 I3 node 1  262654      675.652416      442.152350      0.0     12127.0
 I3 node 2  262654      604.290787      98.330800       0.0     2239.0
 I3 node 3  262654      598.108166      107.158094      0.0     11041.0

 I2 node 0  262654      922.725479      114.950287      413.0   3113.0
 I2 node 1  262654      968.109275      191.690404      417.0   4728.0
 I2 node 2  262654      1102.510570     218.626908      569.0   8051.0
 I2 node 3  262654      1085.247313     178.612440      574.0   6113.0

 I3 node 0  262654      1868.802799     1128.747096     646.0   10201.0
 I3 node 1  262654      2999.502894     1680.598364     0.0     11204.0
 I3 node 2  262654      2052.329538     704.925569      556.0   4672.0
 I3 node 3  262654      1483.590126     263.985905      690.0   3578.0
|
|
|
|
| Aug 2005 | May 2005 | Feb 2005 | Nov 2004 |
|---|
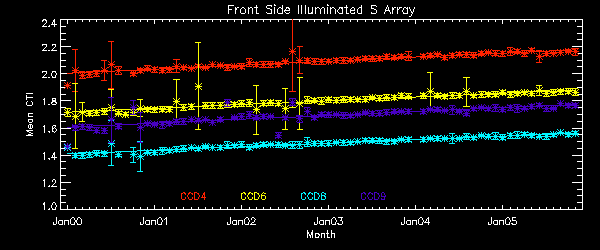
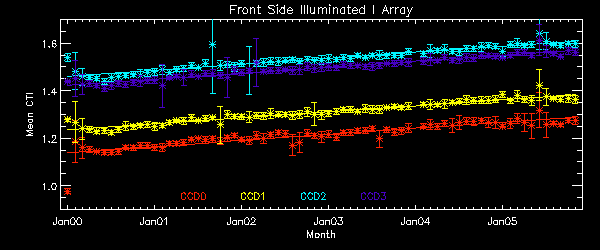
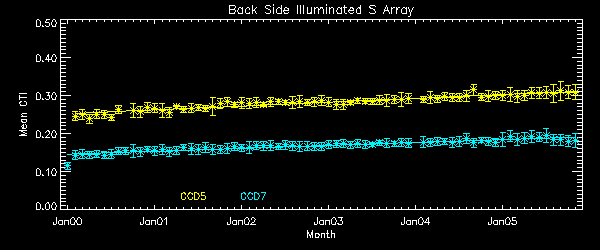
We report CTIs with a refined data definition. CTIs were computed for the temperature
dependency corrected data.
Please see
CTI page
for detailed explanation.
CTI's are computed for Mn K alpha, and defined as slope/intercept x10^4 of row # vs ADU.
Data file here
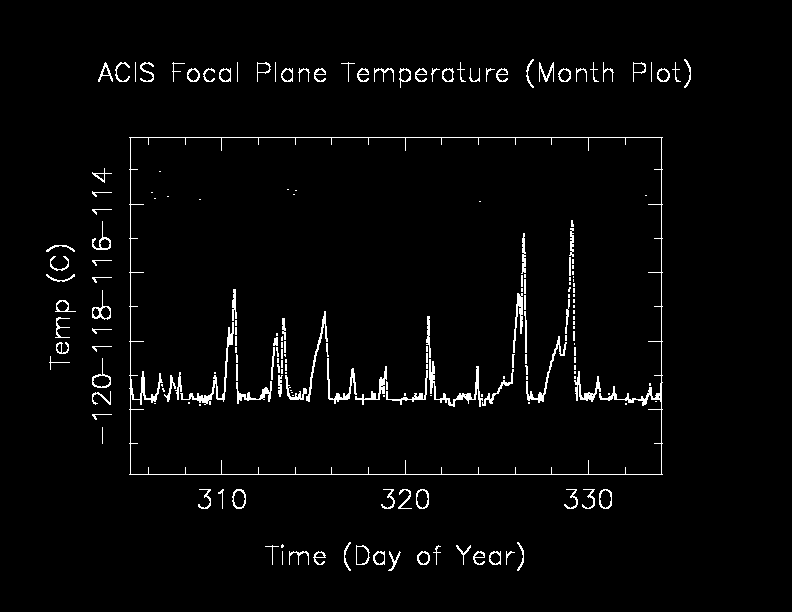
Focal plane temperature between Sept and Oct was re-calibrated, and the data points are corrected accordingly.
       The Mean (max) FPT: -117.99      std dev: 1.11
               mean width:    0.41 days std dev: 0.26

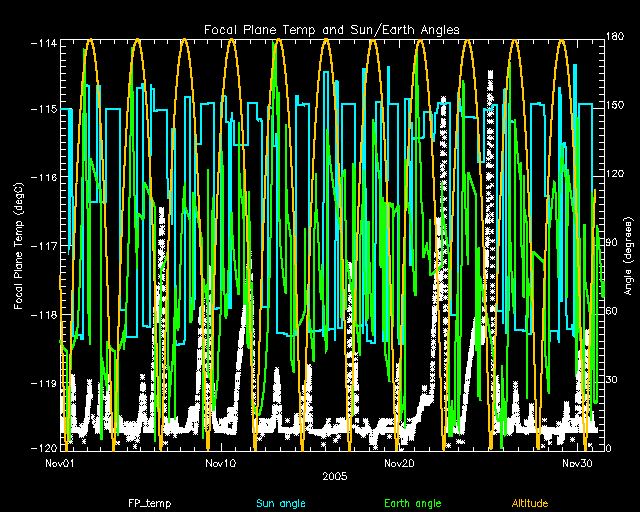
The following is a plot of focal plane temperature and sun angle, earth angle, and altitude.
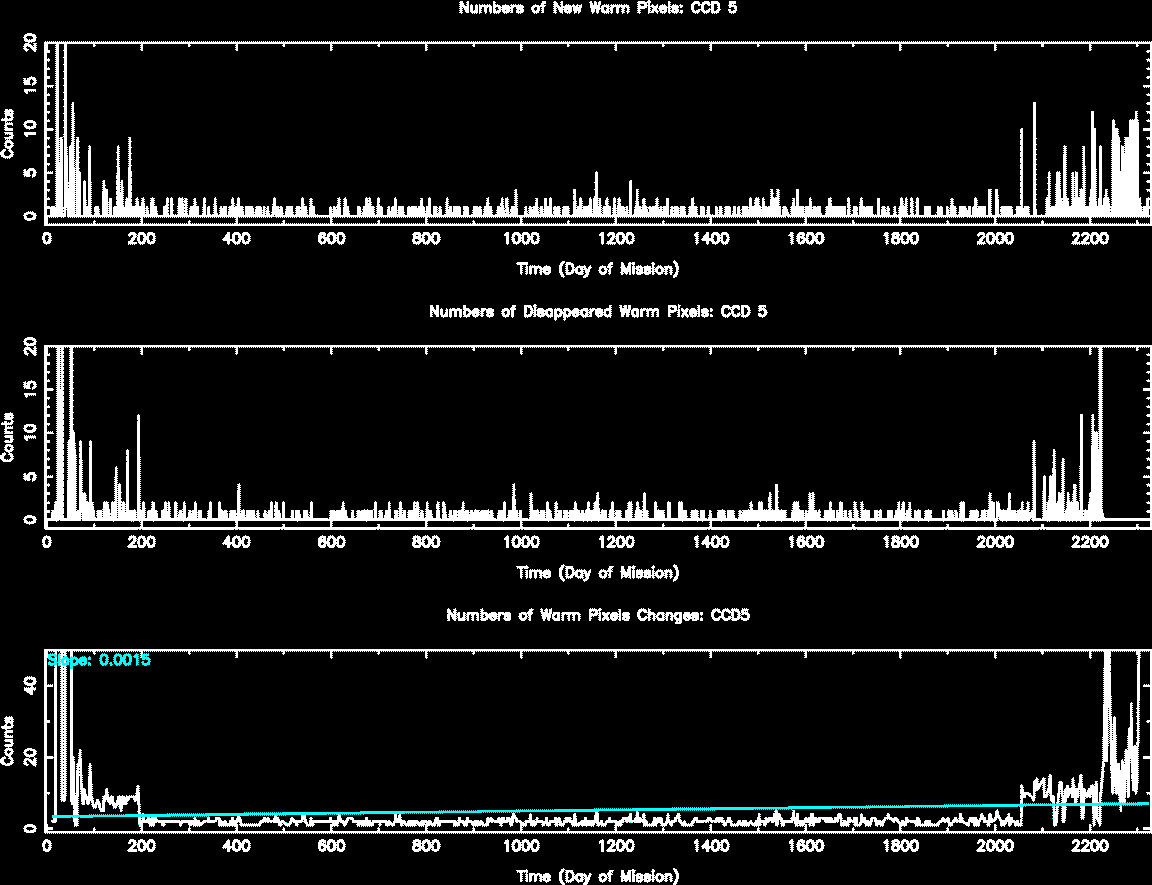
The plots below were generated with a new warm pixel finding script. Please see Acis Bad Pixel Page for details.
Front Side CCDs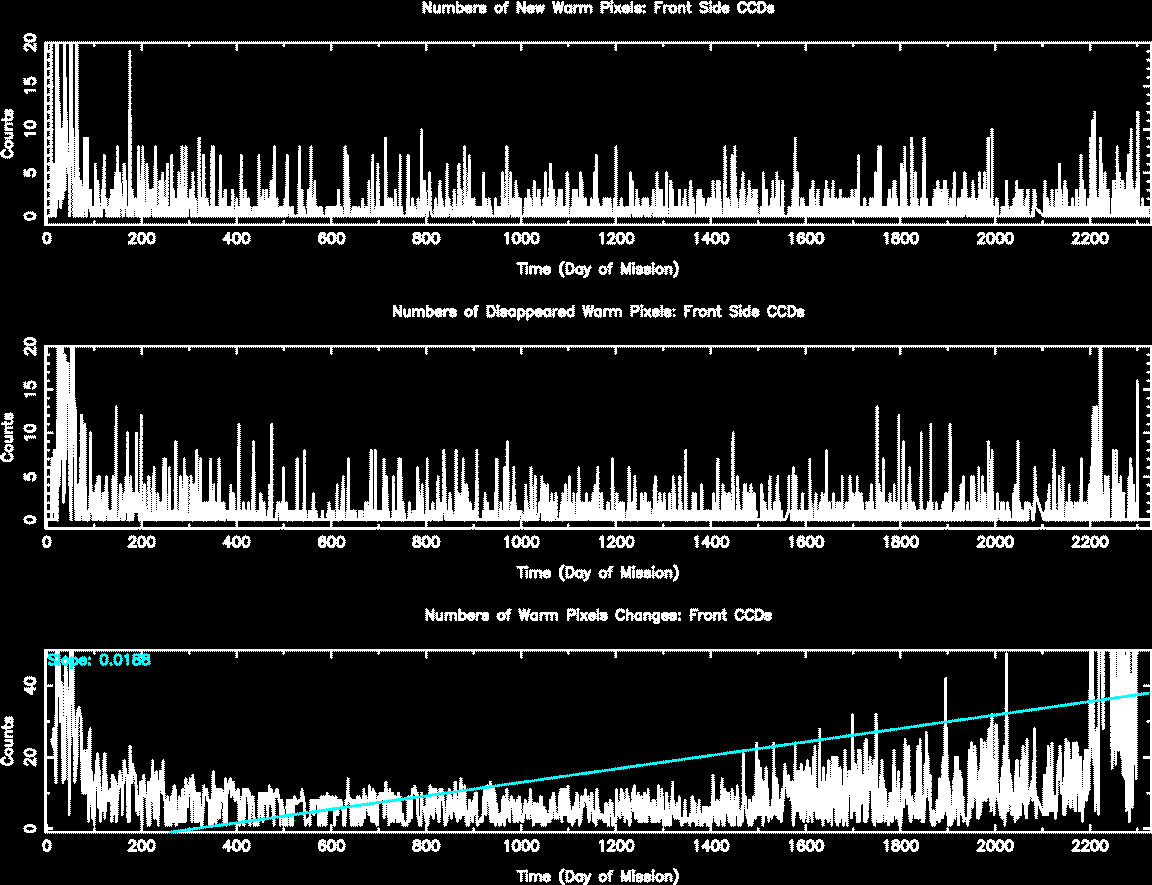
Back Side CCD (CCD5)
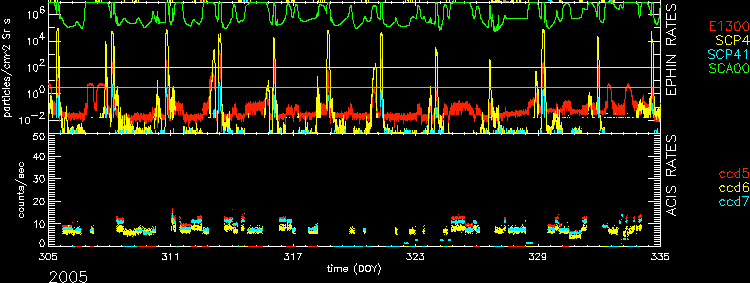
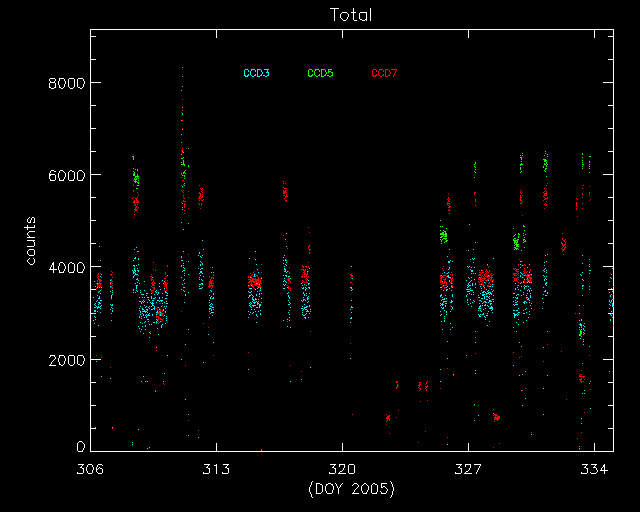
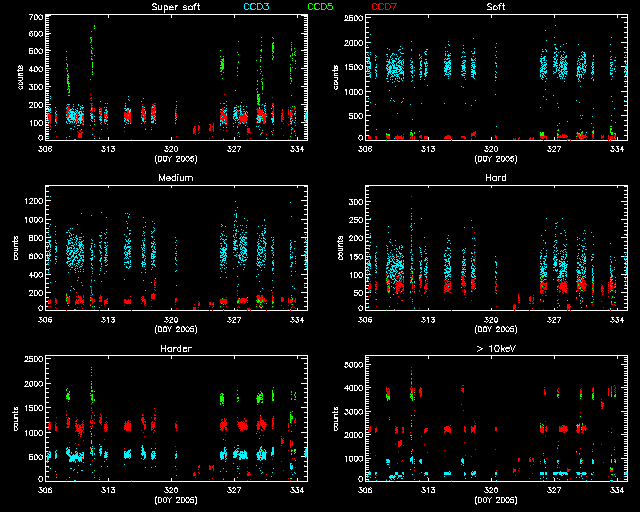
| Name | Low (keV) | High(KeV) | Description |
|---|---|---|---|
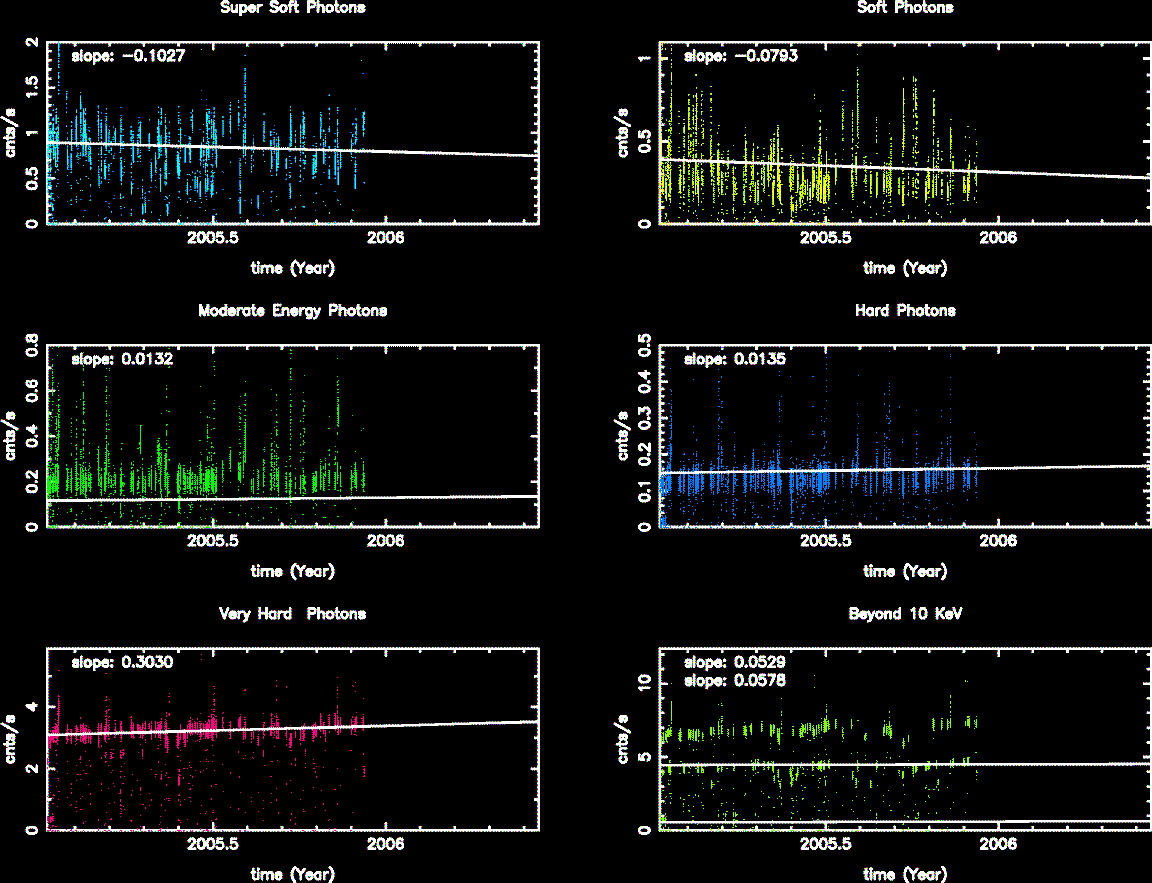
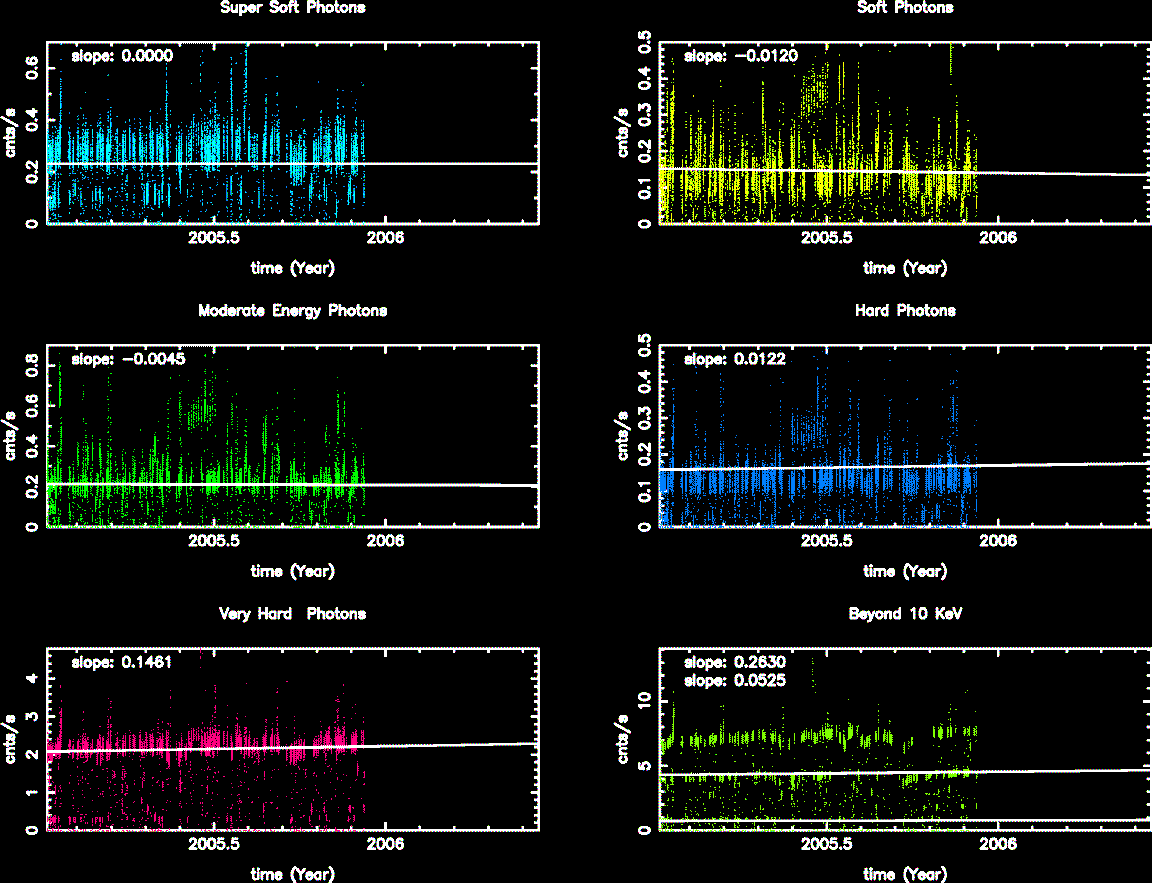
| SSoft | 0.00 | 0.50 | Super soft photons |
| Soft | 0.50 | 1.00 | Soft photons |
| Med | 1.00 | 3.00 | Moderate energy photons |
| Hard | 3.00 | 5.00 | Hard Photons |
| Harder | 5.00 | 10.00 | Very Hard photons |
| Hardest | 10.00 | Beyond 10 keV |
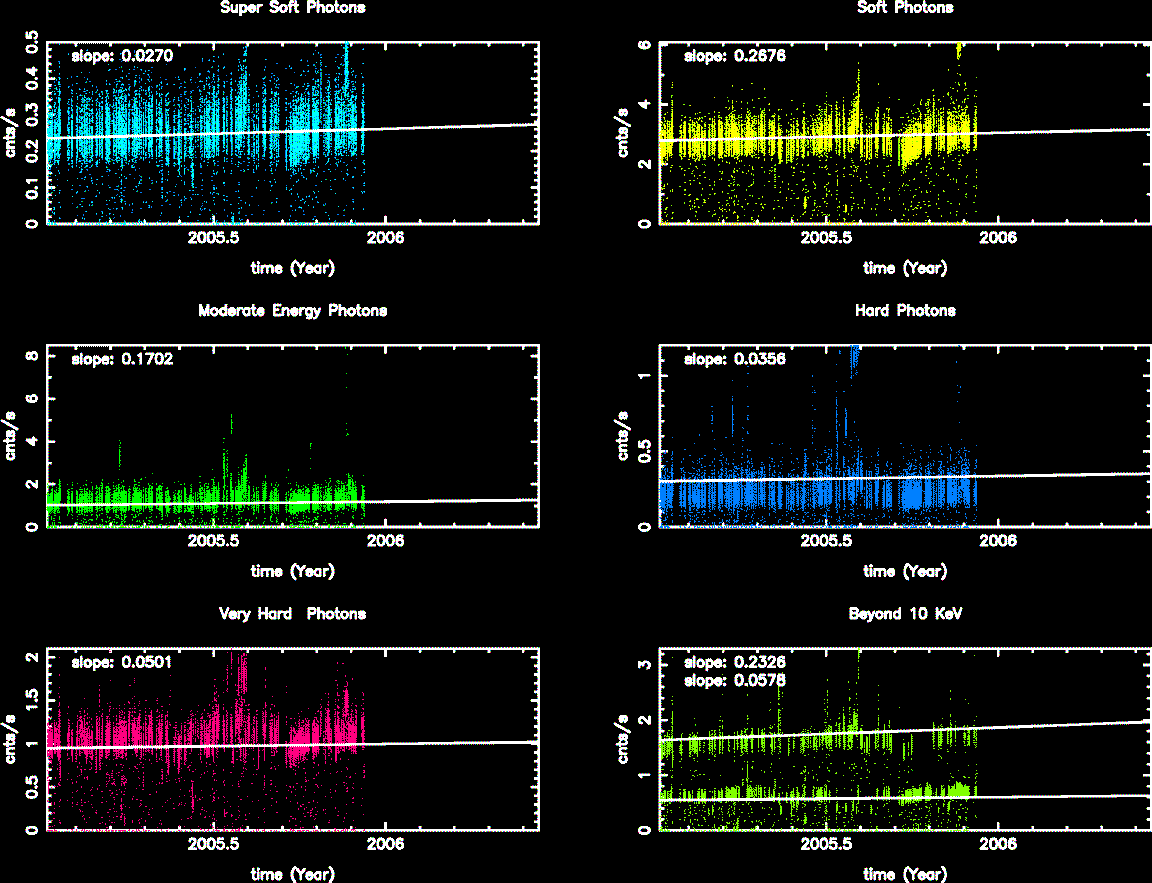
The following three plots show trends of SIB from year 2000. CCDs shown here are CCD3, CCD5, and CCD7. Fitted lines are linear fit after eliminating extreme outliers. For >10 keV plots, 2 lines are fit. One is with a 13 keV filter, and another without.
We collected data from acis histogram mode data, and created trend plots of peak portions and peak widths against time (DOM). The peaks were estimated by fitting a simple Gaussian on three peaks (Al, Ti, and Mn), and the widths were estimated by a width at the half max from the peak.
All histogram data are taken under TIMED and GRADED_HIST mode, SIM position is at an external calibration source position, the focal temperature is around -119.7 C, and parameter settings in aciselec, acistemp are set to about same for all.
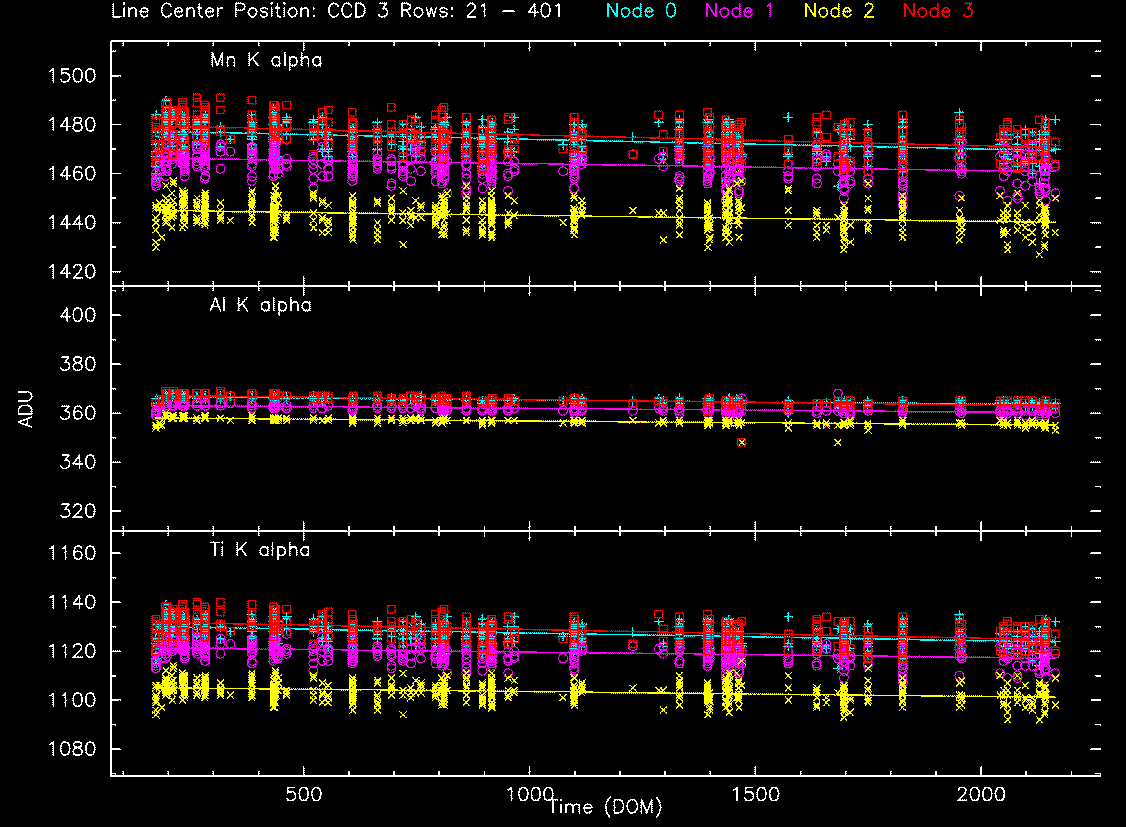
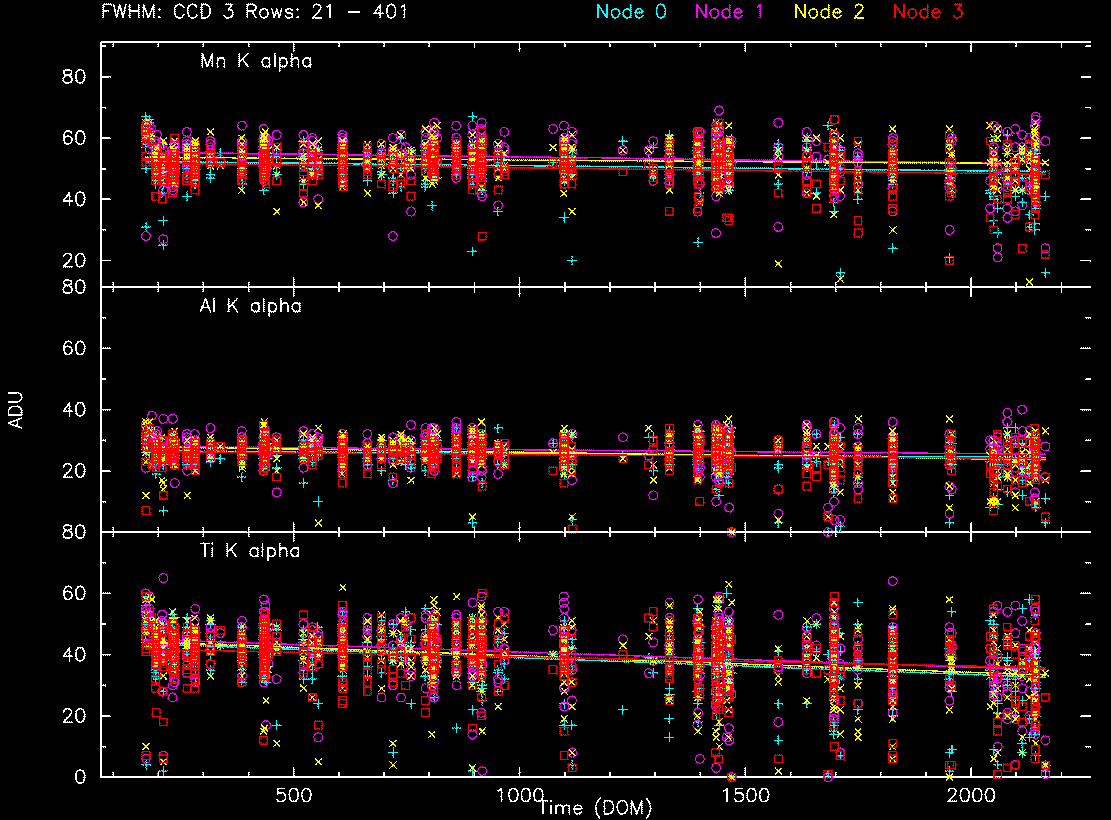
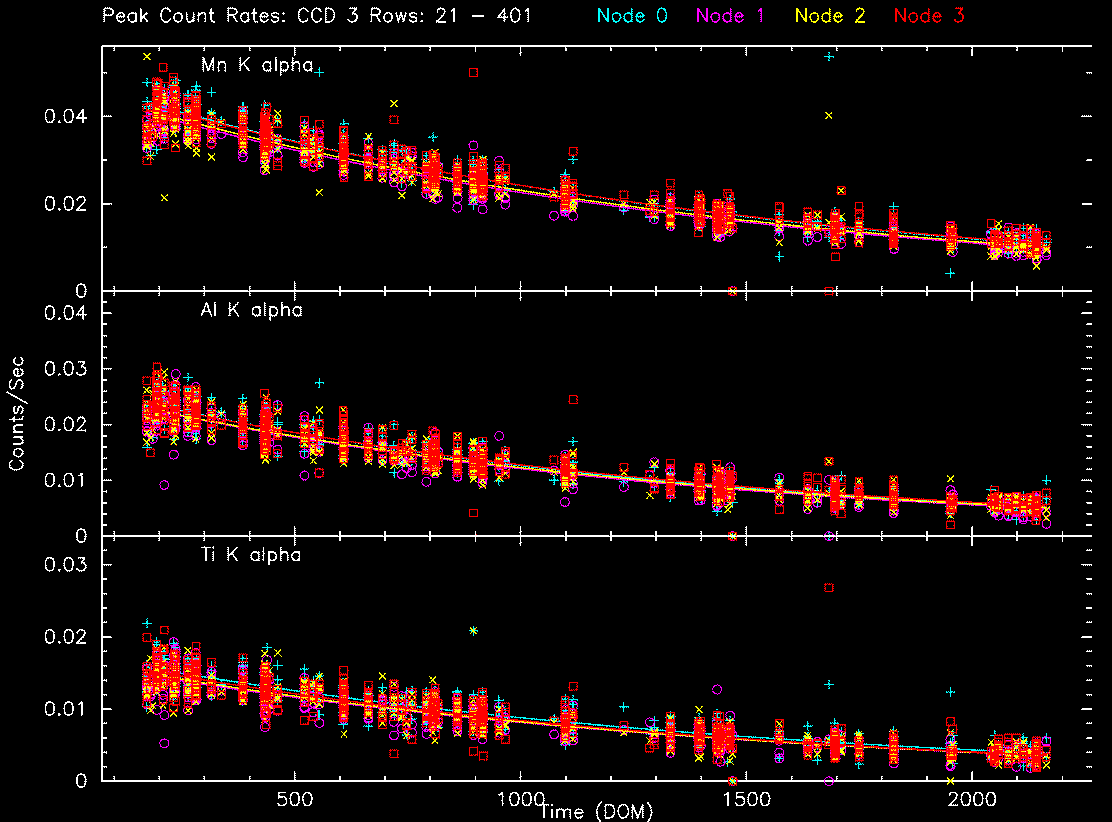
From this month, we trend 10th brightest data points instead of the maximum. This makes the maximum trend values to be about 20% lower than the previous months.
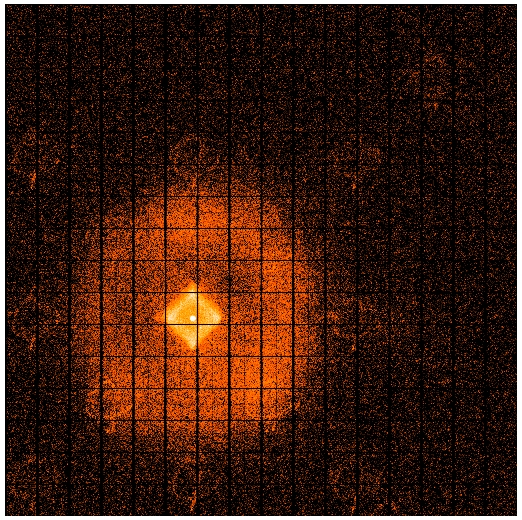
        IMAGE                NPIX      MEAN    STDDEV      MIN       MAX
HRCI_10_2005.fits          NO DATA
        IMAGE                NPIX      MEAN    STDDEV      MIN       MAX
HRCI_08_1999_11_2005.fits  16777216  1.8991    3.0526      0.0       285.0
        IMAGE                NPIX      MEAN    STDDEV      MIN       MAX
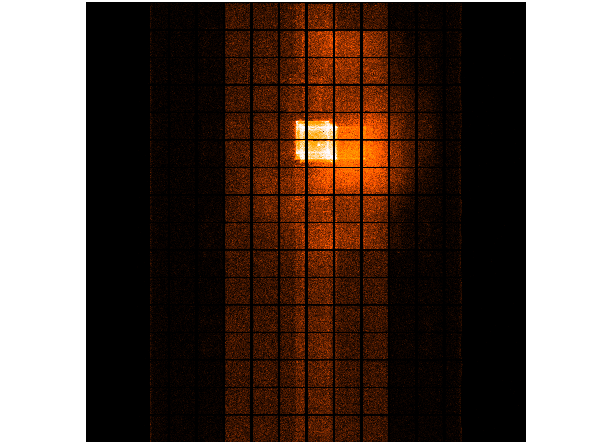
HRCS_11_2005.fits          16777216  0.0012    0.0349      0.0       3.0
        IMAGE                NPIX     MEAN      STDDEV      MIN      MAX
HRCS_08_1999_10_2005.fits  16777216  6.3688    14.1762      0.0      1503.0
We display a max dose trend plot corrected for events that "pile-up" in the center of the taps due to bad position information.

|
|
|
|
| Aug 2005 | May 2005 | Feb 2005 | Nov 2004 |
|---|
|
|
|
|
| Aug 2005 | May 2005 | Feb 2005 | Nov 2004 |
|---|

| MSID | MEAN | RMS | DELTA/YR | DELTA/YR/YR | UNITS | DESCRIPTION |
| 1DE28AVO | 2.889e+01 | 2.566e-01 | -2.458e+00 | -1.666e+01 | V | DEA +28V INPUT A |
| 1DP28AVO | 2.892e+01 | 2.521e-01 | -2.434e+00 | -1.582e+01 | V | DPA +28V INPUT A |
| MSID | MEAN | RMS | DELTA/YR | DELTA/YR/YR | UNITS | DESCRIPTION |
| 1DE28BVO | 2.918e+01 | 2.200e-01 | -2.362e+00 | -9.941e+00 | V | DEA +28V INPUT B |
| 1DP28BVO | 2.921e+01 | 2.168e-01 | -2.340e+00 | -9.235e+00 | V | DPA +28V INPUT B |
| MSID | MEAN | RMS | DELTA/YR | DELTA/YR/YR | UNITS | DESCRIPTION |
| SCE1300 | 1.826e+02 | 7.774e+02 | -9.148e+02 | -8.787e+03 | E1300 | sci coincidence counter |
| SCE150 | 3.144e+04 | 1.081e+05 | -7.842e+04 | -2.088e+03 | E150 | sci coincidence counter |
| SCE3000 | 1.511e+01 | 4.828e+01 | -5.822e+01 | -3.295e+02 | E3000 | sci coincidence counter |
| SCE300 | 1.272e+04 | 5.775e+04 | -3.226e+04 | -3.736e+05 | E300 | sci coincidence counter |
| MSID | MEAN | RMS | DELTA/YR | DELTA/YR/YR | UNITS | DESCRIPTION |
| HFAPGRD1 | -1.721e-02 | 4.506e-03 | 2.744e-02 | 5.765e-01 | K | RT1-RT2: HRMA Forward Aperture Plate |
| HFAPGRD2 | 3.644e-02 | 4.811e-03 | -1.882e-02 | 4.936e-01 | K | RT1-RT4: HRMA Forward Aperture Plate |
| MSID | MEAN | RMS | DELTA/YR | DELTA/YR/YR | UNITS | DESCRIPTION |
| HCONEGRD22 | -6.909e-01 | 9.549e-02 | 6.082e-01 | -9.143e+00 | K | RT41-RT48: OBA Cone Panel |
| HCONEGRD28 | -2.172e+00 | 6.371e-02 | 5.084e-01 | 2.206e-01 | K | RT44-RT50: OBA Cone Panel |
| HCONEGRD39 | 2.253e+00 | 2.254e-02 | -2.869e-01 | 4.929e-02 | K | RT50-RT51: OBA Cone Panel |
| MSID | MEAN | RMS | DELTA/YR | DELTA/YR/YR | UNITS | DESCRIPTION | 3.454e+00 | 7.580e-01 | 9.846e-01 | 1.048e+02 | K | RT78-RT79: Spacecraft Struts |
| MSID | MEAN | RMS | DELTA/YR | DELTA/YR/YR | UNITS | DESCRIPTION |
| 2CEAHVPT | 2.981e+02 | 1.687e+00 | 1.090e+01 | -1.210e+02 | K | CEA RADIATOR TEMPERATURE AT CENTER |
| 2CHTRPZT | 2.944e+02 | 1.673e+00 | 1.136e+01 | -1.596e+02 | K | CENTRAL ELECTRONICS BOX TEMP |
| 2CONDMXT | 2.902e+02 | 1.633e+00 | 1.096e+01 | -1.445e+02 | K | CONDUIT -X FACE TEMPERATURE |
| MSID | MEAN | RMS | DELTA/YR | DELTA/YR/YR | UNITS | DESCRIPTION |
| AOGBIAS1 | -4.561e-06 | 4.547e-08 | -6.338e-07 | 6.927e-07 | RADPS | GYRO DRIFT RATE ESTIMATE (ROLL) |
| AOGBIAS2 | -9.990e-06 | 2.228e-08 | -3.028e-07 | -3.457e-07 | RADPS | GYRO DRIFT RATE ESTIMATE (PITCH) |
| AOGBIAS3 | -5.763e-06 | 2.631e-08 | -3.652e-07 | 4.087e-07 | RADPS | GYRO DRIFT RATE ESTIMATE (YAW) |
| MSID | MEAN | RMS | DELTA/YR | DELTA/YR/YR | UNITS | DESCRIPTION |
| EB1CI | 3.424e-01 | 9.478e-03 | 8.509e-02 | 2.786e-01 | AMP | BATT 1 CHARGE CURRENT |
| EB2CI | 3.521e-01 | 9.522e-03 | 7.713e-02 | -4.668e-02 | AMP | BATT 2 CHARGE CURRENT |
| EB3CI | 3.409e-01 | 1.058e-02 | 8.941e-02 | 7.686e-02 | AMP | BATT 3 CHARGE CURRENT |
| MSID | MEAN | RMS | DELTA/YR | DELTA/YR/YR | UNITS | DESCRIPTION |
| ELBV | 2.979e+01 | 2.114e-01 | -2.329e+00 | -2.315e-01 | V | LOAD BUS VOLTAGE |
| 
|

| Year | Month | |||||||||||
|---|---|---|---|---|---|---|---|---|---|---|---|---|
| 1999 | Jul | Aug | Sep | Oct | Nov | Dec | ||||||
| 2000 | Jan | Feb | Mar | Apr | May | Jun | Jul | Aug | Sep | Oct | Nov | Dec |
| 2001 | Jan | Feb | Mar | Apr | May | Jun | Jul | Aug | Sep | Oct | Nov | Dec |
| 2002 | Jan | Feb | Mar | Apr | May | Jun | Jul | Aug | Sep | Oct | Nov | Dec |
| 2003 | Jan | Feb | Mar | Apr | May | Jun | Jul | Aug | Sep | Oct | Nov | Dec |
| 2004 | Jan | Feb | Mar | Apr | May | Jun | Jul | Aug | Sep | Oct | Nov | Dec |
| 2005 | Jan | Feb | Mar | Apr | May | Jun | Jul | Aug | Sep | Oct | Nov | Dec |