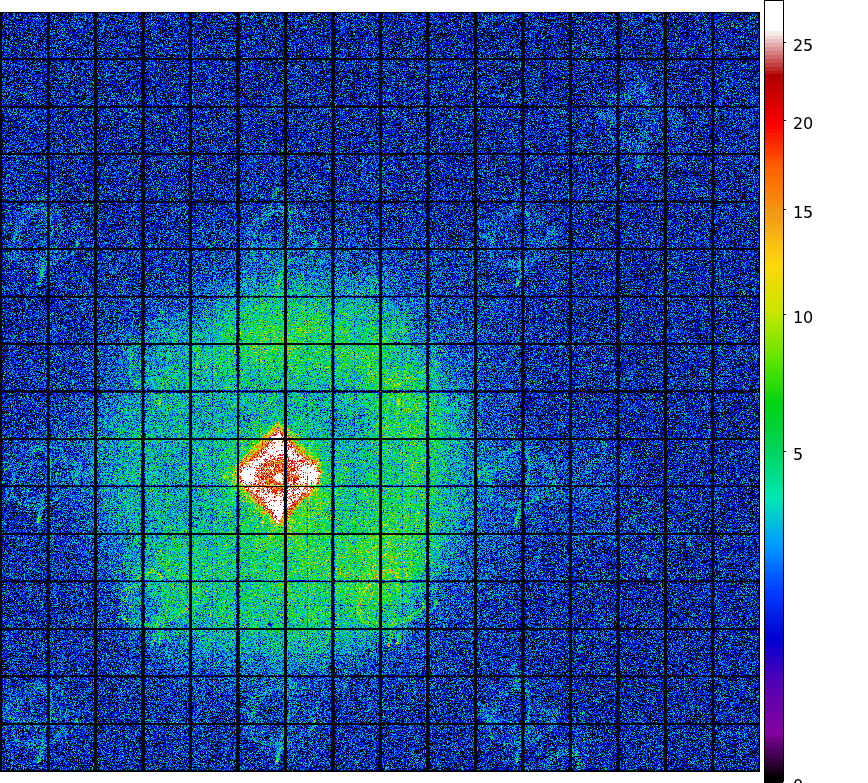
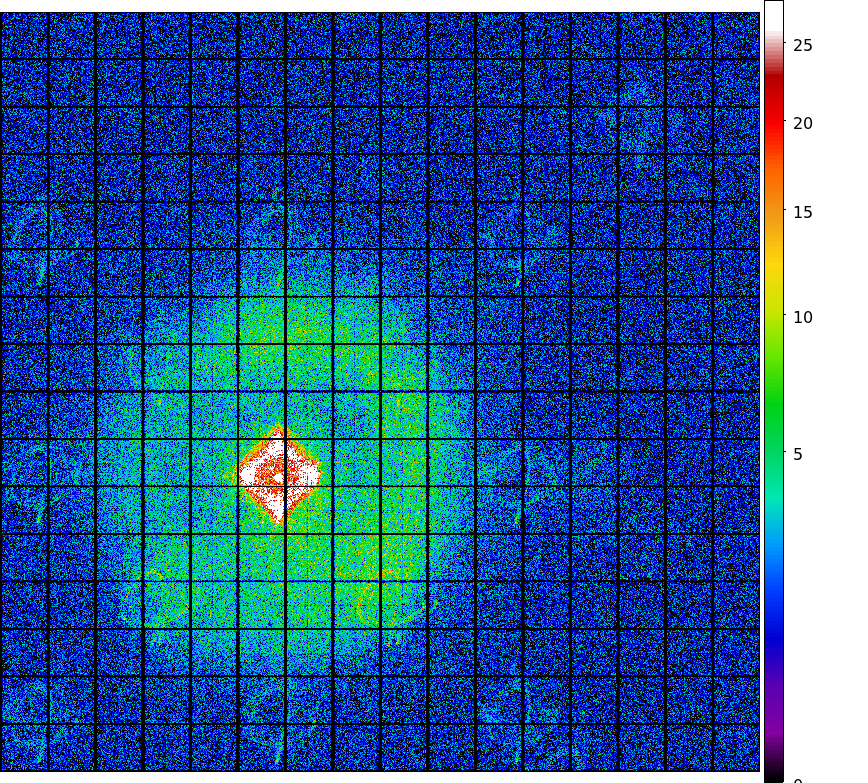
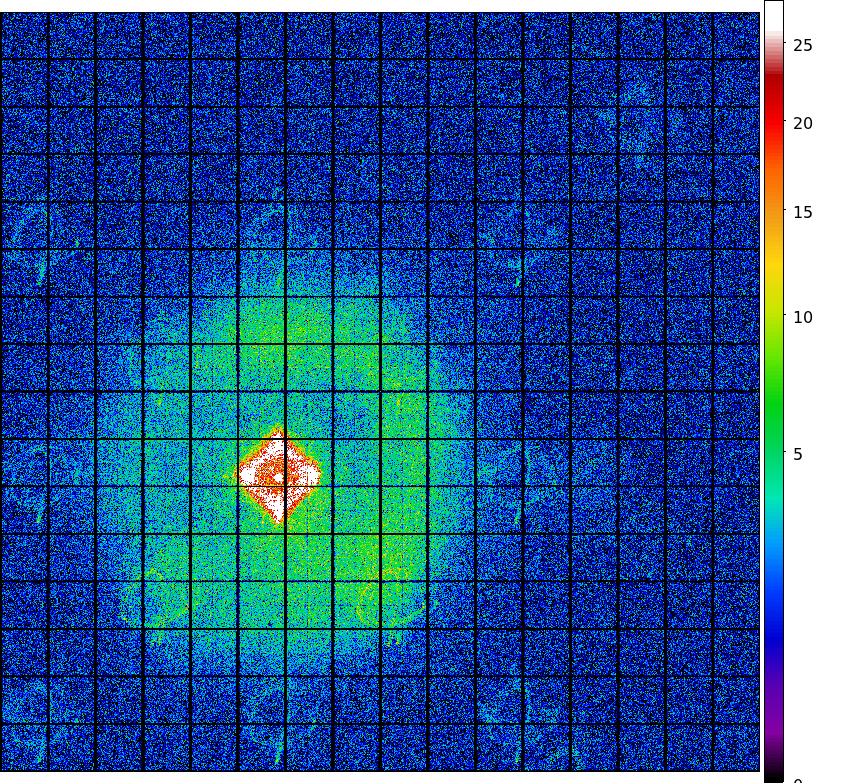
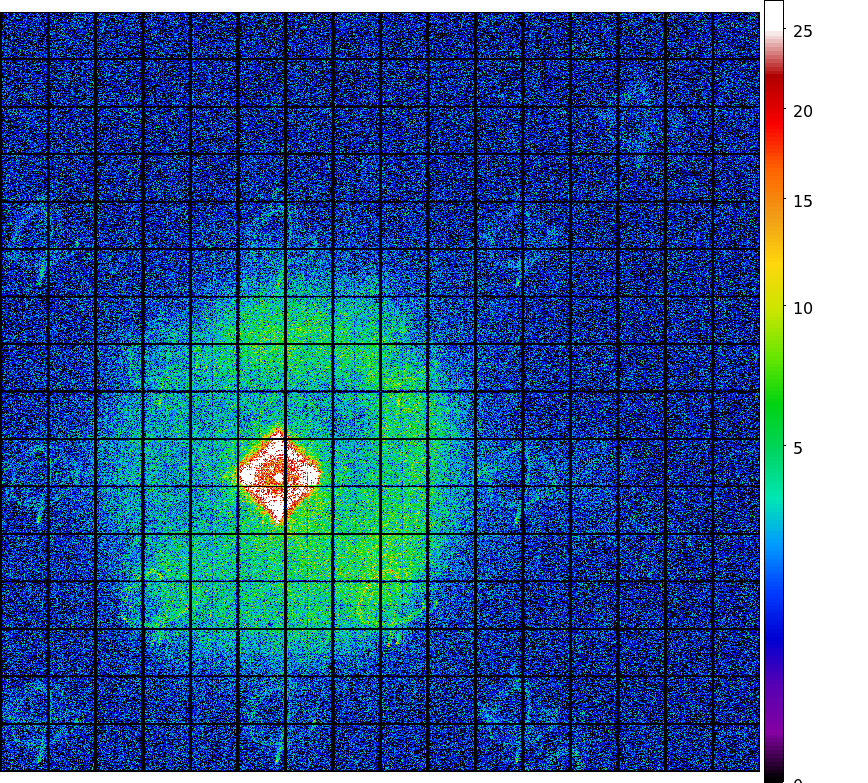
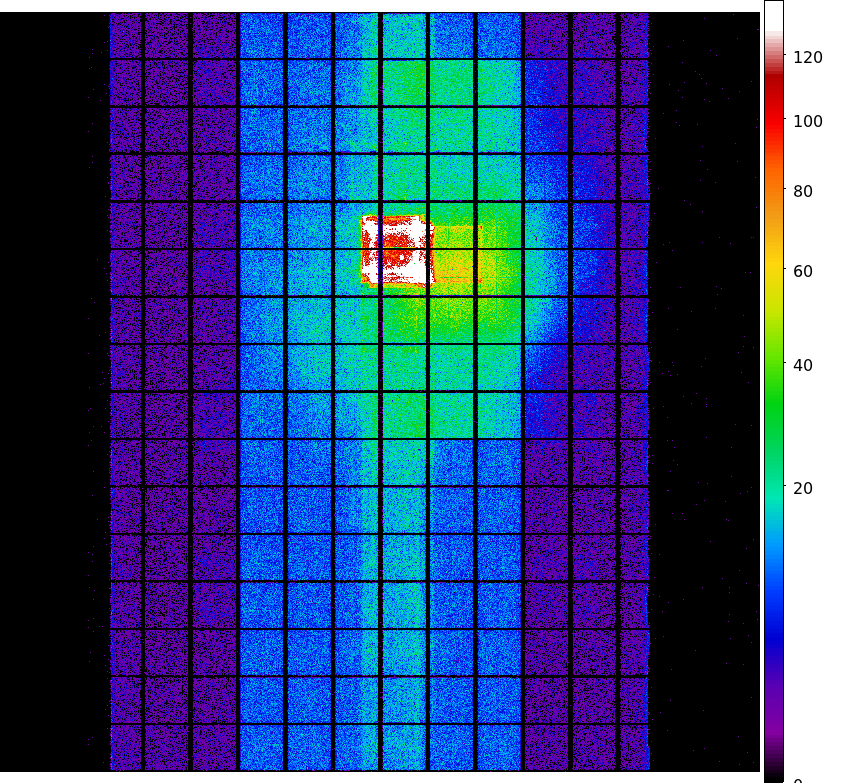
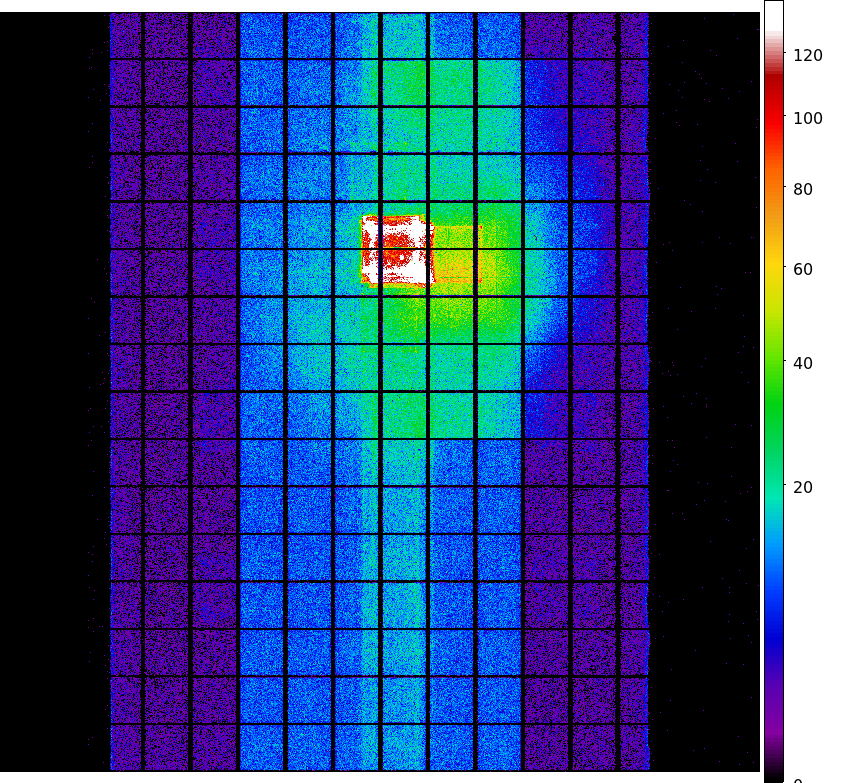
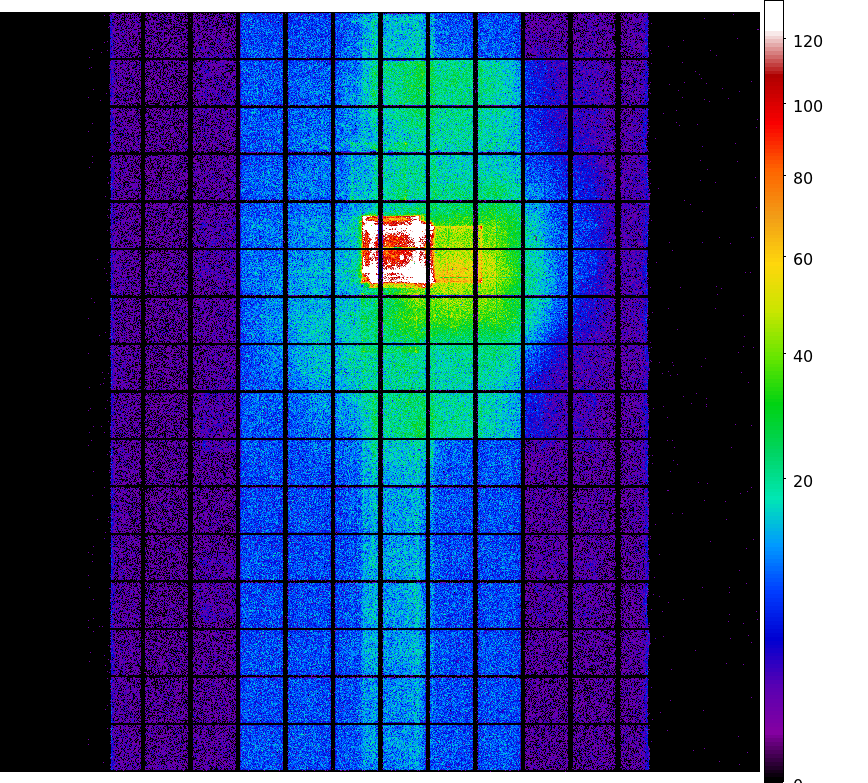
- ACIS DOSE registered-photon-map
We updated ACIS cumulative dose map from this month. The steps we took to compute a new dose map are;
- Level 1 Event files for a specified month are obtained from archive.
- Image data including I2, I3, S2, S3 CCDs are extracted from all event files.
- All the extracted image data were merged to create a month long exposure map for the month.
- The exposure map is opened with ds9, and check a distribution of count rates against energy.
From this, estimate the upper threshold value. Any events beyond this upper threshold are
assumed erroneous events such as bad pixels.
- Using this upper threshold, the data is filtered, and create a cleaned exposure map for the month.
- The exposure map from each month from the Aug 1999 is added up to create a cumulative exposure
map for each month.
- Using fimgstatistic, we compute count rate statistics for each CCDs.
- For observations with high data drop rates (e.g., Crab nebula, Cas A), we corrected the observations
by adding events.
Note: Counts and RMS's of Cumulative maps are lower than the previous months. This is because we excluded
extreme outliers.
Please check more detail plots at Telemetered Photon Dose Trend page.
- JANUARY registered-photon-map in fits
Statistics:
# IMAGE     NPIX        MEAN           RMS               MIN   MAX
ACIS_jan06 6004901      10.620         16.068            0.0   589.0

 I2 node 0  262654      7.653889        3.142888        0.0      31.0
 I2 node 1  262654      8.032936        3.391172        0.0     289.0
 I2 node 2  262654      8.026806        3.214119        0.0      59.0
 I2 node 3  262654      7.909881        3.348748        0.0      61.0

 I3 node 0  262654      7.810977        3.430094        0.0      70.0
 I3 node 1  262654      8.119232        6.956800        0.0     202.0
 I3 node 2  262654      7.576323        3.150300        0.0      44.0
 I3 node 3  262654      7.604202        3.234701        0.0     145.0

 I2 node 0  262654      13.371289       4.272672        0.0      67.0
 I2 node 1  262654      14.276369       5.505673        0.0      78.0
 I2 node 2  262654      18.488645       10.395841       0.0     118.0
 I2 node 3  262654      21.574869       16.550536       0.0     317.0

 I3 node 0  262654      29.729389       32.032235       1.0     257.0
 I3 node 1  262654      22.810321       18.419416       0.0     221.0
 I3 node 2  262654      23.457855       15.798850       0.0     183.0
 I3 node 3  262654      18.520526       9.979704        1.0     121.0
- Aug 1999 - Jan 2006 registered-photon-map in fits
Statistics:
 IMAGE        NPIX      MEAN          RMS              MIN    MAX
ACIS_total  6004901   840.199       1196.223           0.0  49520.0

 I2 node 0  262654      585.225361      101.208356      0.0     2231.0
 I2 node 1  262654      616.280432      139.393210      0.0     3395.0
 I2 node 2  262654      620.371731      109.878517      0.0     2008.0
 I2 node 3  262654      620.347873      140.071919      0.0     2879.0

 I3 node 0  262654      670.913307      165.446236      0.0     3284.0
 I3 node 1  262654      690.987198      453.479741      0.0     12401.0
 I3 node 2  262654      618.431396      100.727226      0.0     2324.0
 I3 node 3  262654      612.305981      109.854083      0.0     11299.0

 I2 node 0  262654      946.882747      117.430399      427.0   3207.0
 I2 node 1  262654      993.772775      196.752366      431.0   4838.0
 I2 node 2  262654      1134.881989     226.185980      586.0   8170.0
 I2 node 3  262654      1122.654789     192.624955      604.0   6647.0

 I3 node 0  262654      1916.802298     1149.485702     671.0   10246.0
 I3 node 1  262654      3036.927731     1686.197969     0.0     11236.0
 I3 node 2  262654      2091.368221     709.717035      567.0   4690.0
 I3 node 3  262654      1514.934069     271.511859      707.0   3637.0
- JAN 2006 dose PNG image
- JAN I3 dose PNG image
- JAN S3 dose PNG image
- TOTAL AUG 1999 - JAN 2006 dose PNG image
- TOTAL I3 dose PNG image
- TOTAL S3 dose PNG image
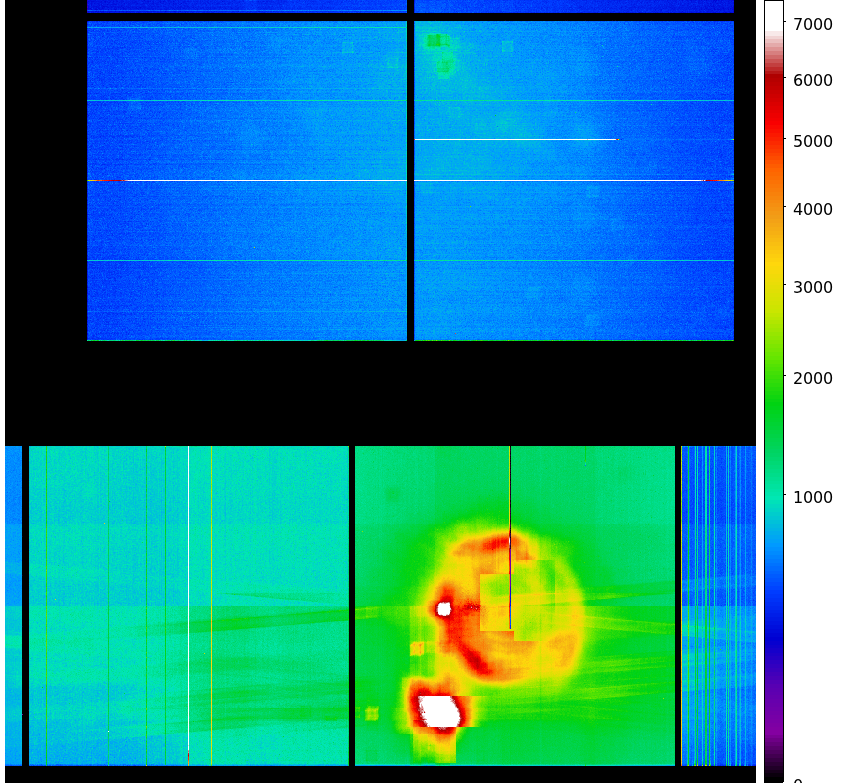
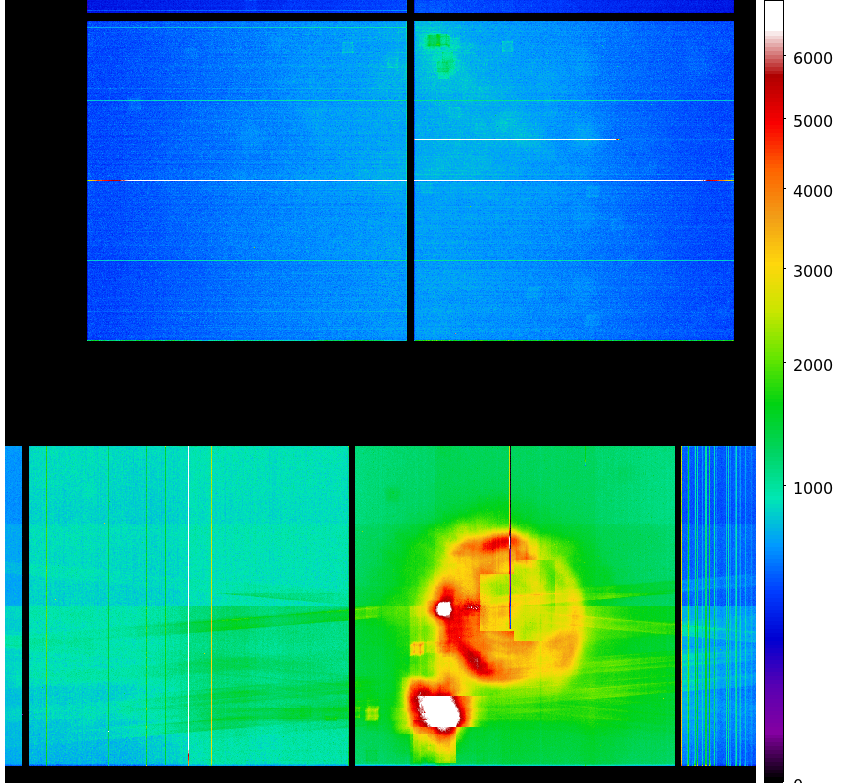
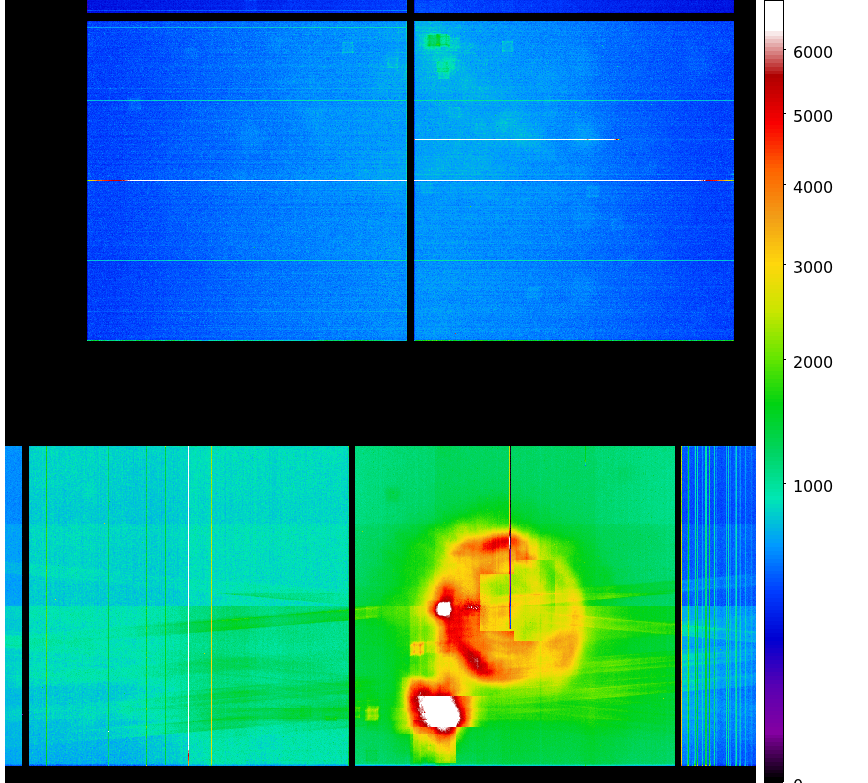
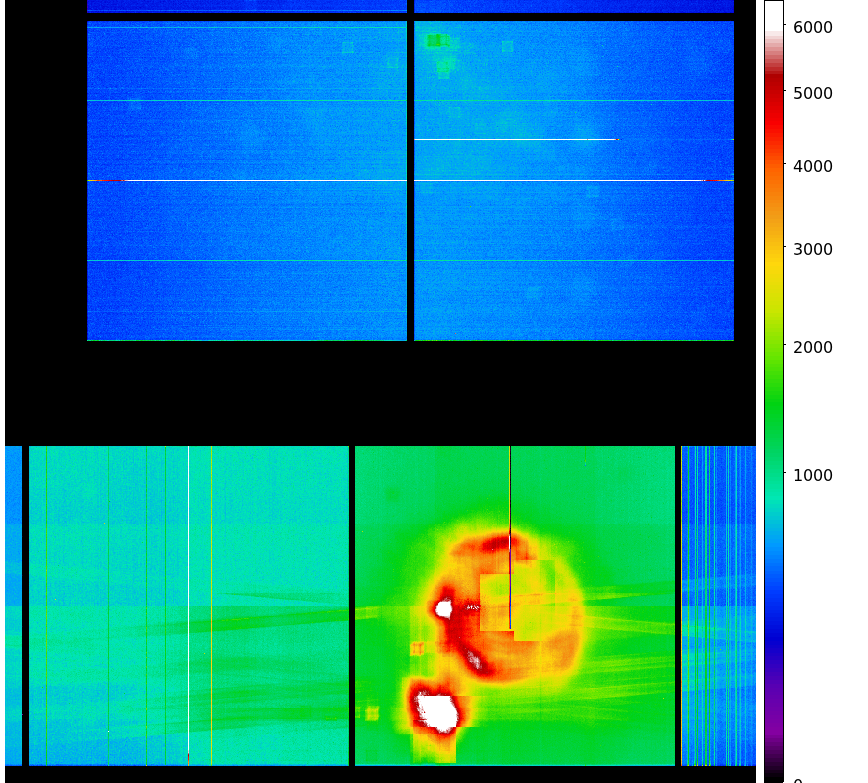
- Integrated Exposure Maps of Last 12 Months
|
|
|
|
| Oct 2005 |
Jul 2005 |
Apr 2005 |
Feb 2005 |
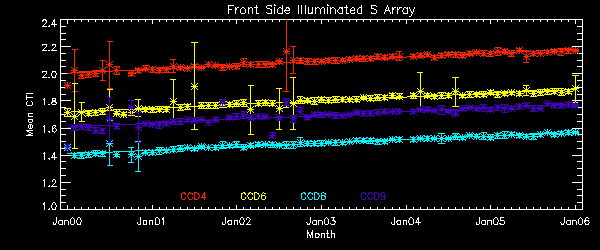
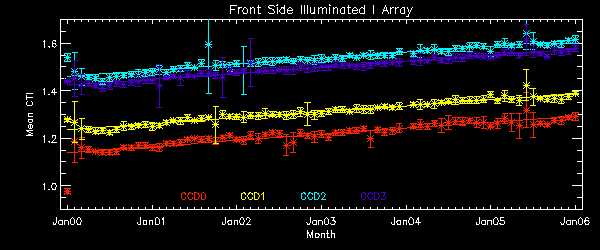
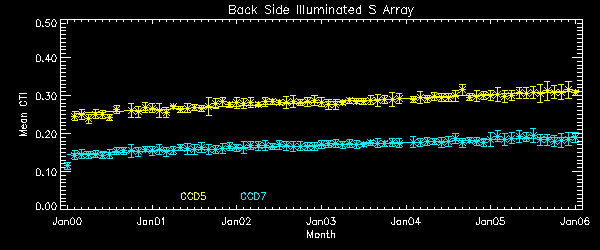
- The Mean Detrended CTI
We report CTIs with a refined data definition. CTIs were computed for the temperature
dependency corrected data.
Please see
CTI page
for detailed explanation.
CTI's are computed for Mn K alpha, and defined as slope/intercept x10^4 of row # vs ADU.
Data file here
Focal plane temperature between Sept and Oct was re-calibrated, and the data points are
corrected accordingly.
- Focal Plane Temperature
       The Mean (max) FPT: -117.19      std dev: 2.56
               mean width:    0.61 days std dev: 0.43
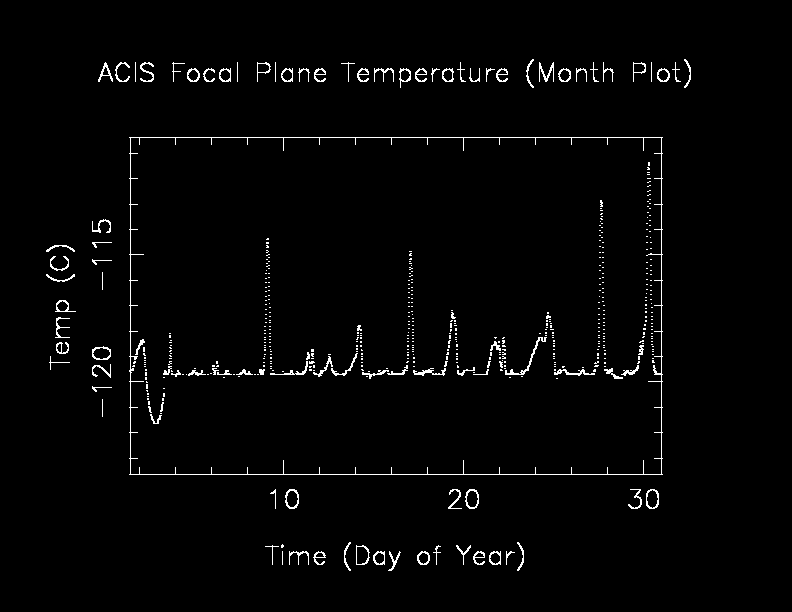
We are using 10 period moving averages to show
trends of peak temperatures and peak widths.
Note, the gaps in the width plot are due to missing/corrupted data.

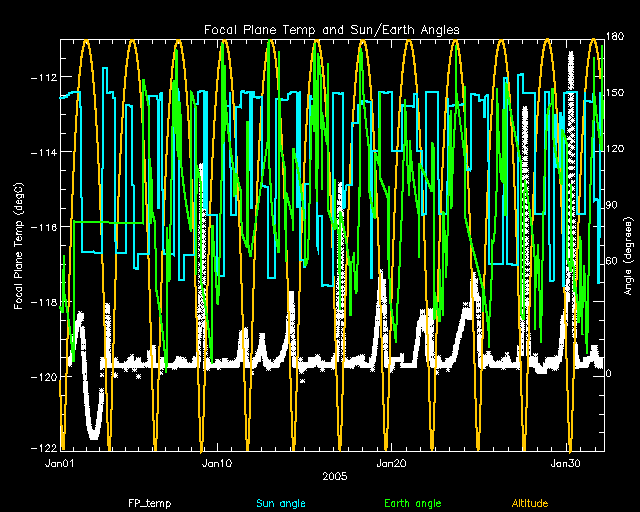
The following is a plot of focal plane temperature and sun angle, earth angle, and altitude.
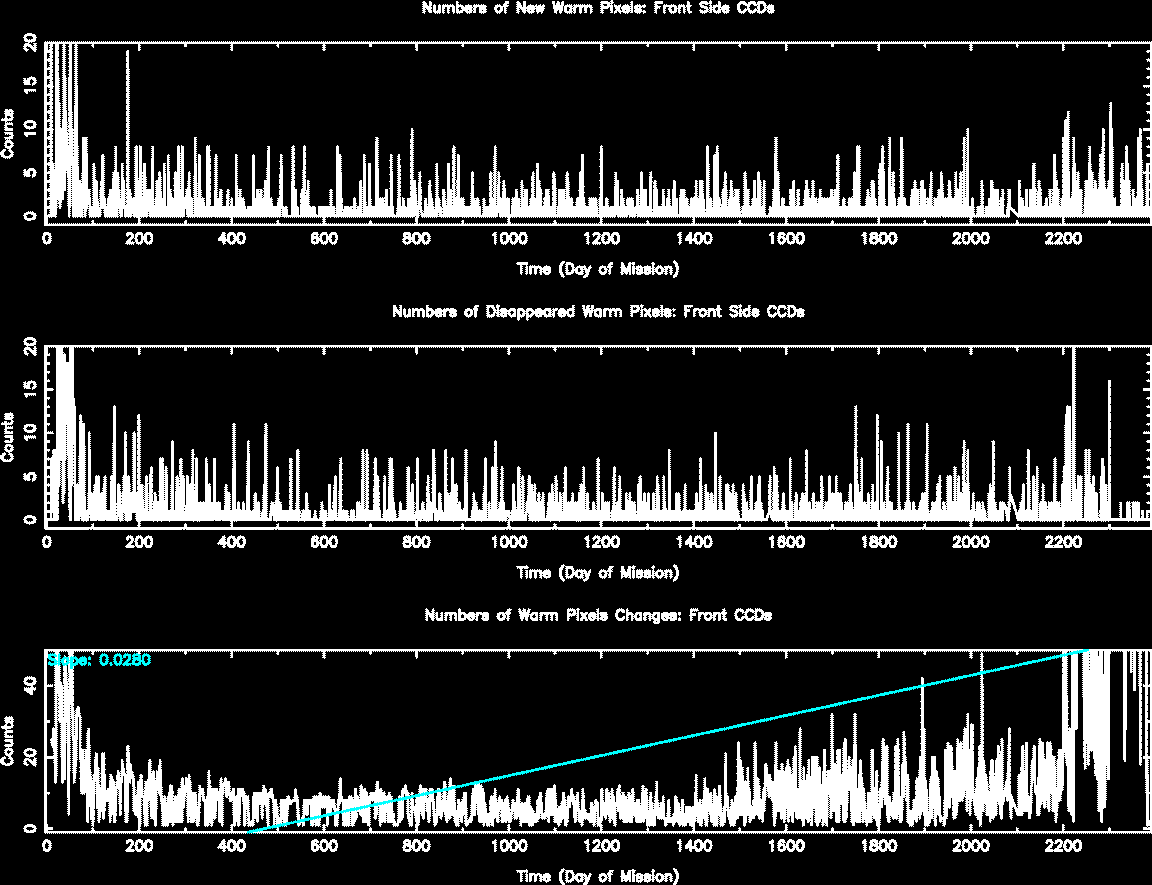
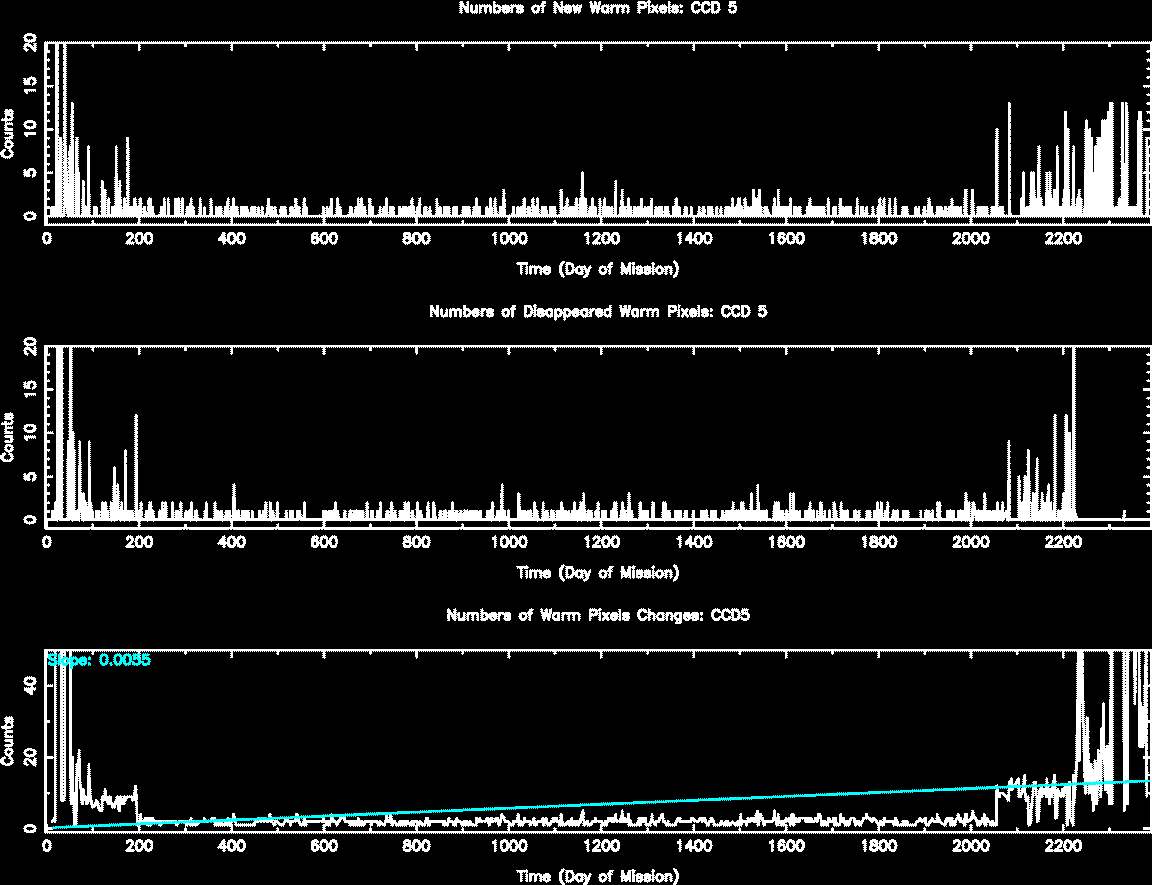
- Bad Pixels
The plots below were generated with a new warm pixel finding script. Please see
Acis Bad Pixel Page
for details.
Front Side CCDs
Back Side CCD (CCD5)
-
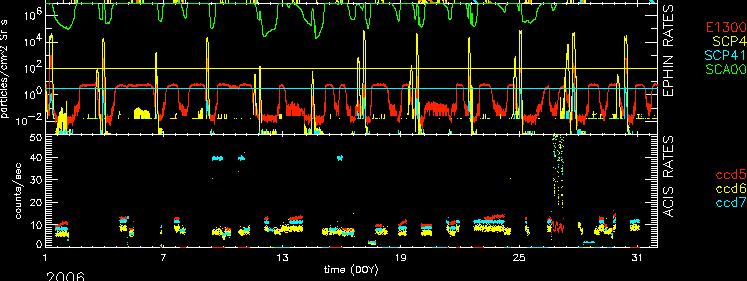
Acis Count Rate Plot
This monitors the ACIS count Rate vs. EPHIN count Rate.
No sources or CTI observations are removed. For daily updates see:
Ephin/Acis Info
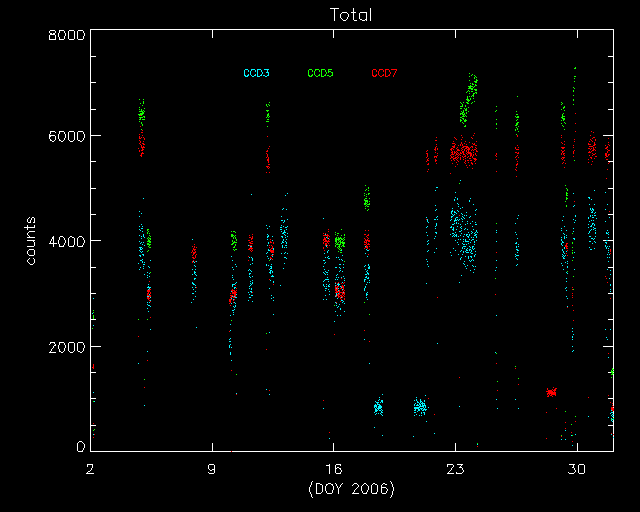
- Science instrument background rates
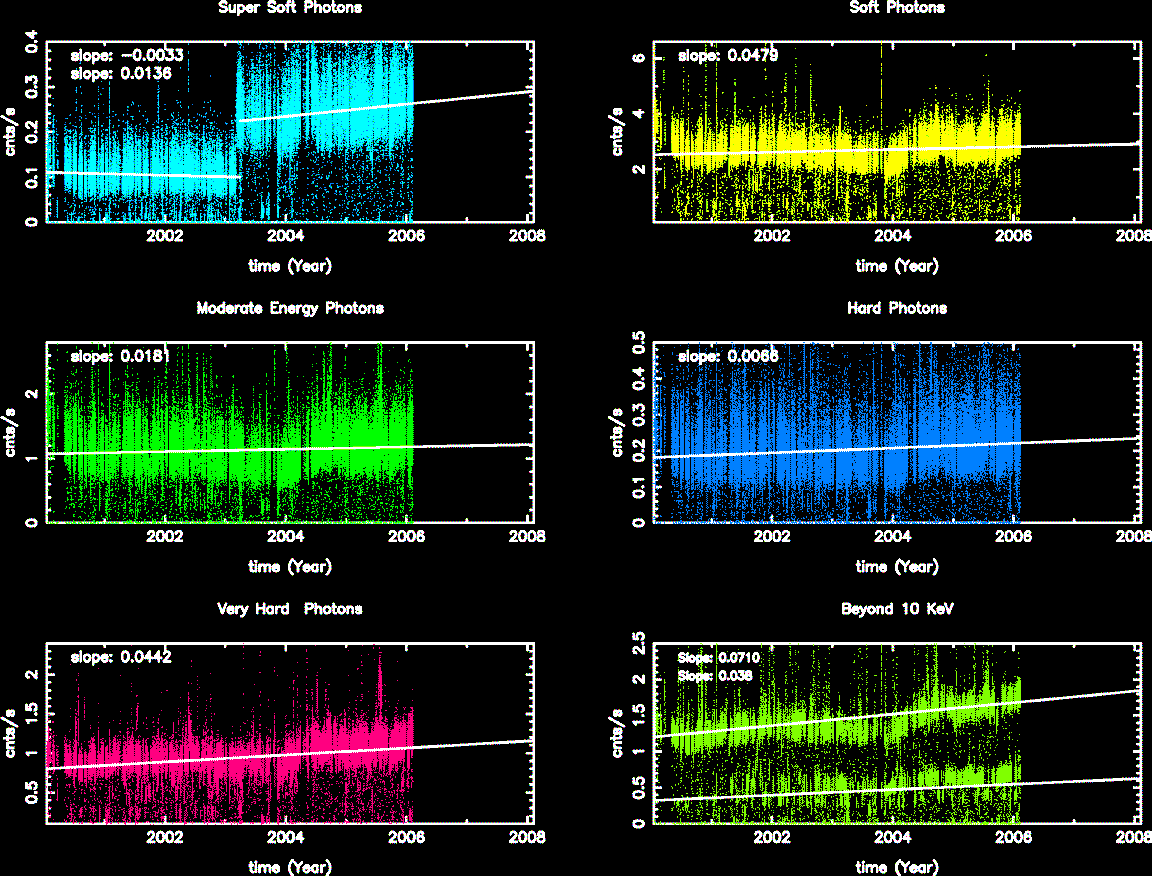
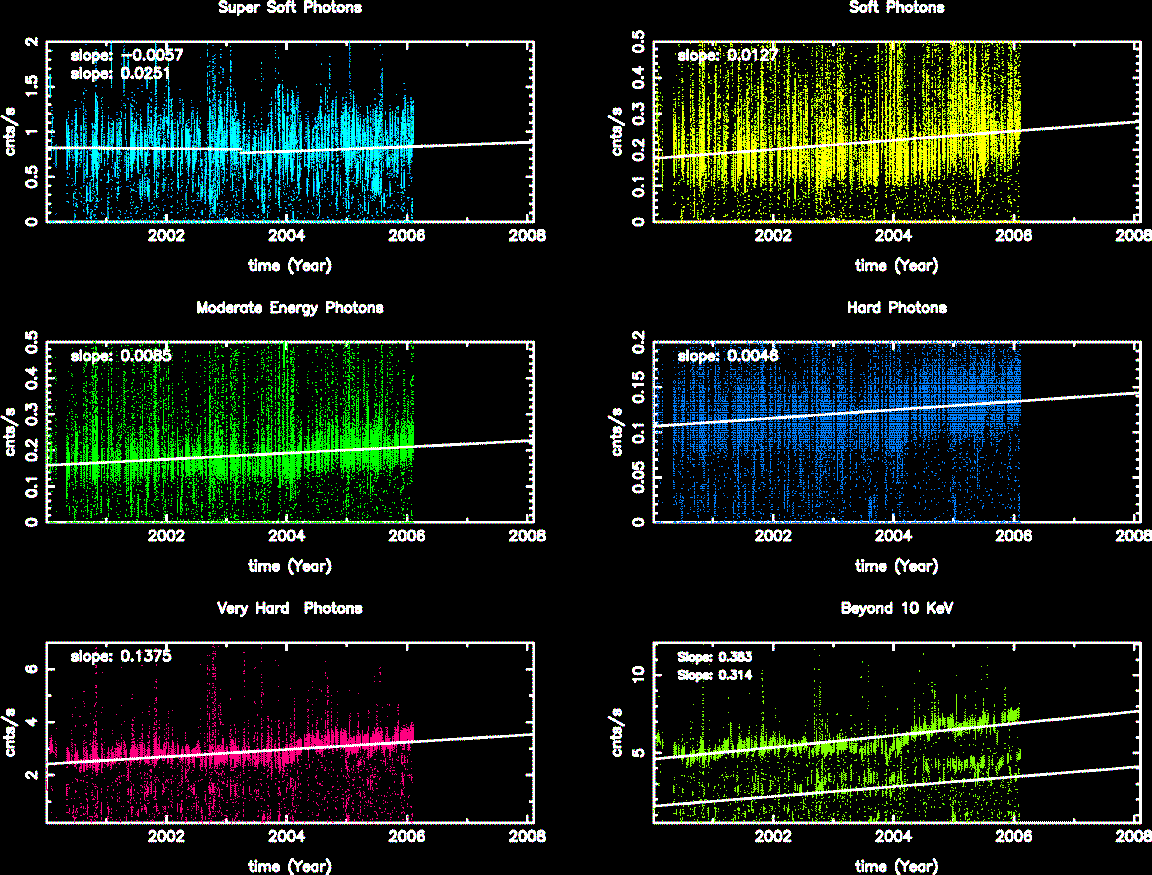
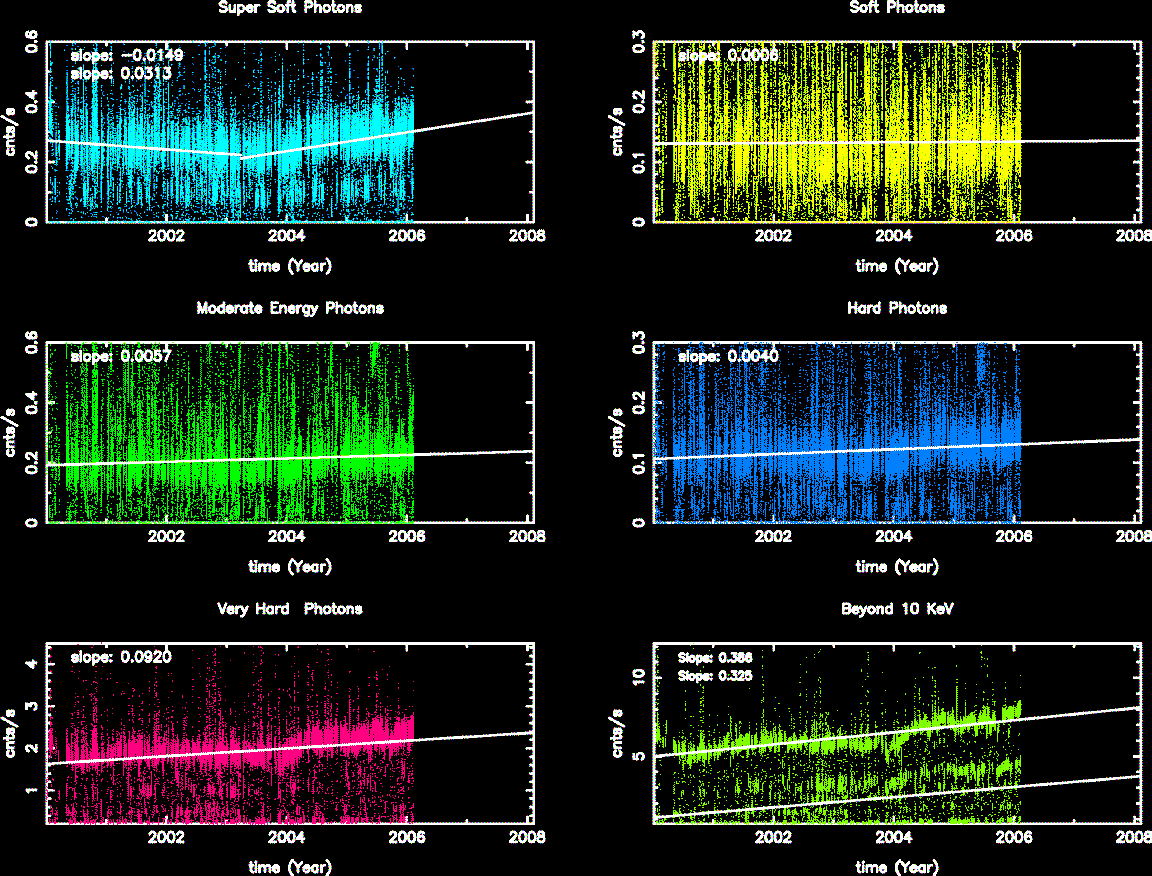
This page shows scientific instrument background data based on Acis
observations. A source region file is generated using get_srcregions
and then the input event file is filtered using the regions in that file
to remove the sources.
| Name | Low (keV) | High(KeV) | Description |
|---|
| SSoft | 0.00 | 0.50 | Super soft photons |
|---|
| Soft | 0.50 | 1.00 | Soft photons |
|---|
| Med | 1.00 | 3.00 | Moderate energy photons |
|---|
| Hard | 3.00 | 5.00 | Hard Photons |
|---|
| Harder | 5.00 | 10.00 | Very Hard photons |
|---|
| Hardest | 10.00 | | Beyond 10 keV |
|---|
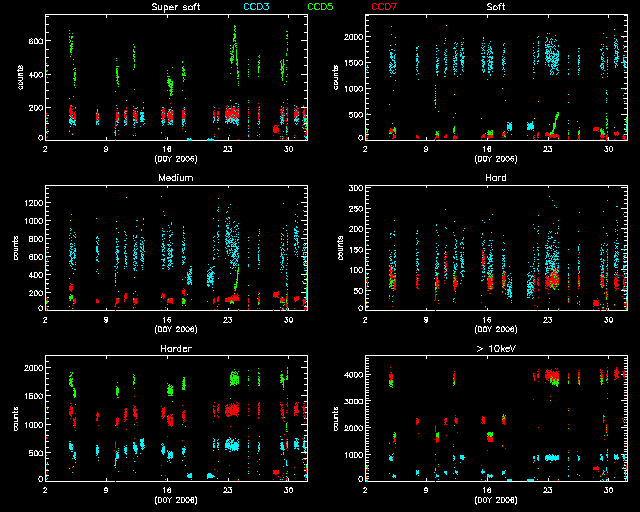
The following three plots show trends of SIB from year 2000.
CCDs shown here are CCD3, CCD5, and CCD7. Fitted lines are linear fit after eliminating extreme
outliers. For >10 keV plots, 2 lines are fit. One is with a 13 keV filter, and
another without.
CCD 3
CCD 5
CCD 7
- ACIS Corner Pixels
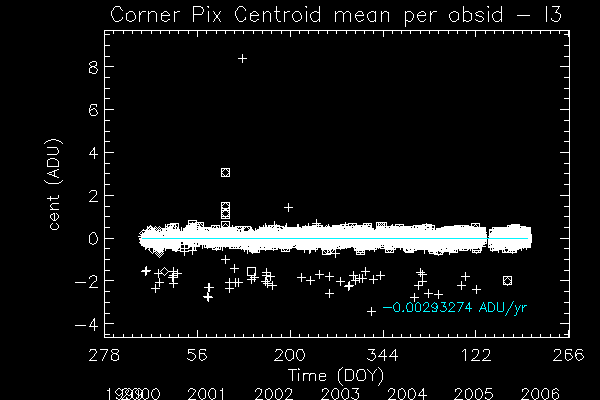
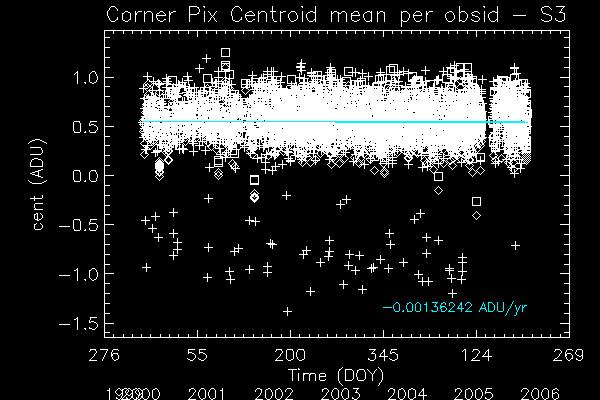
We plot the average corner pixel centroid slope and mean for ACIS observations. Separate
plots are shown for FAINT MODE (3X3) and VFAINT MODE (5X5) observations.
Metric is the centroid of a gaussian fit to the histogram of corner pixel PHA values
of detected events.
Plus signs are FAINT observations, diamonds are VFAINT observations,
and boxes are VFAINT observations with centroids computed using
only the corner pixels of a 3X3 event island (referred to as AFAINT).
We see a very small upward trend.
I3
S3
- ACIS Bias Trends
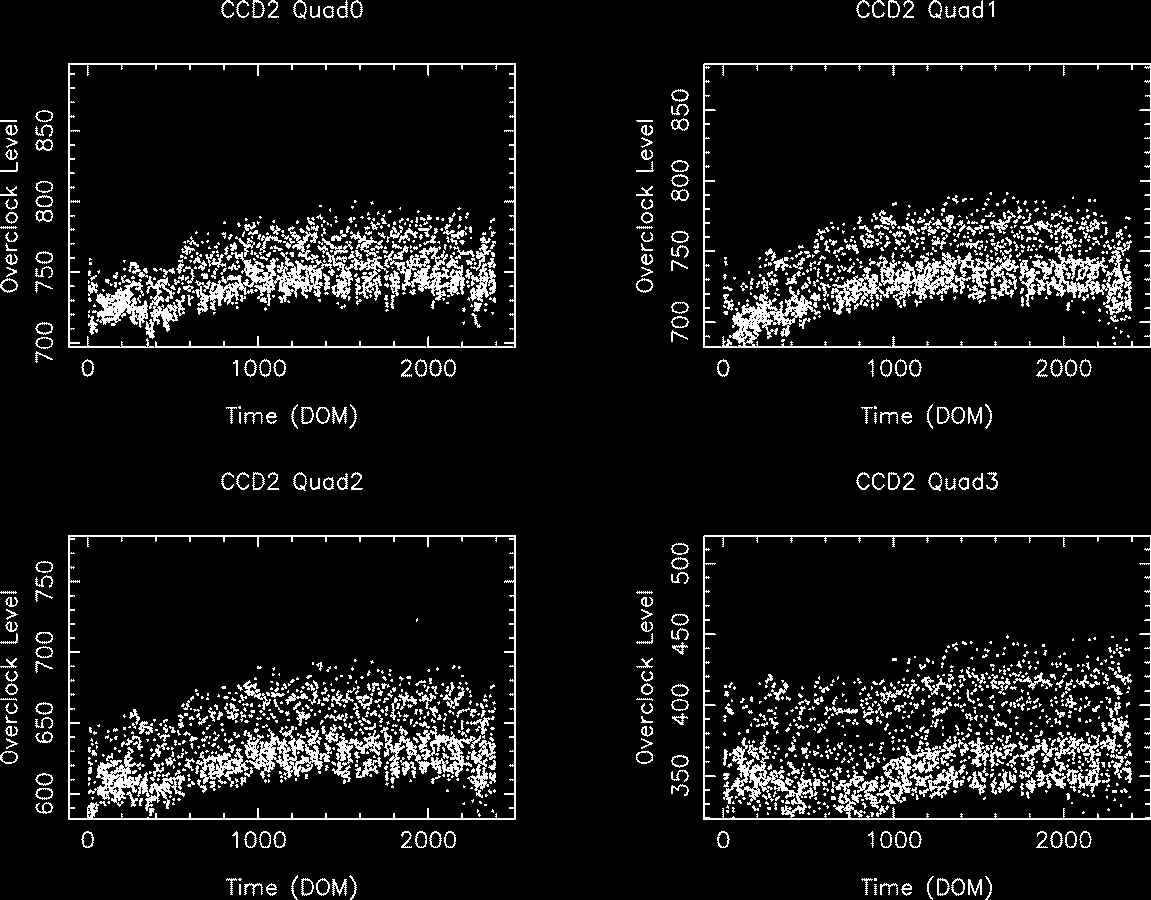
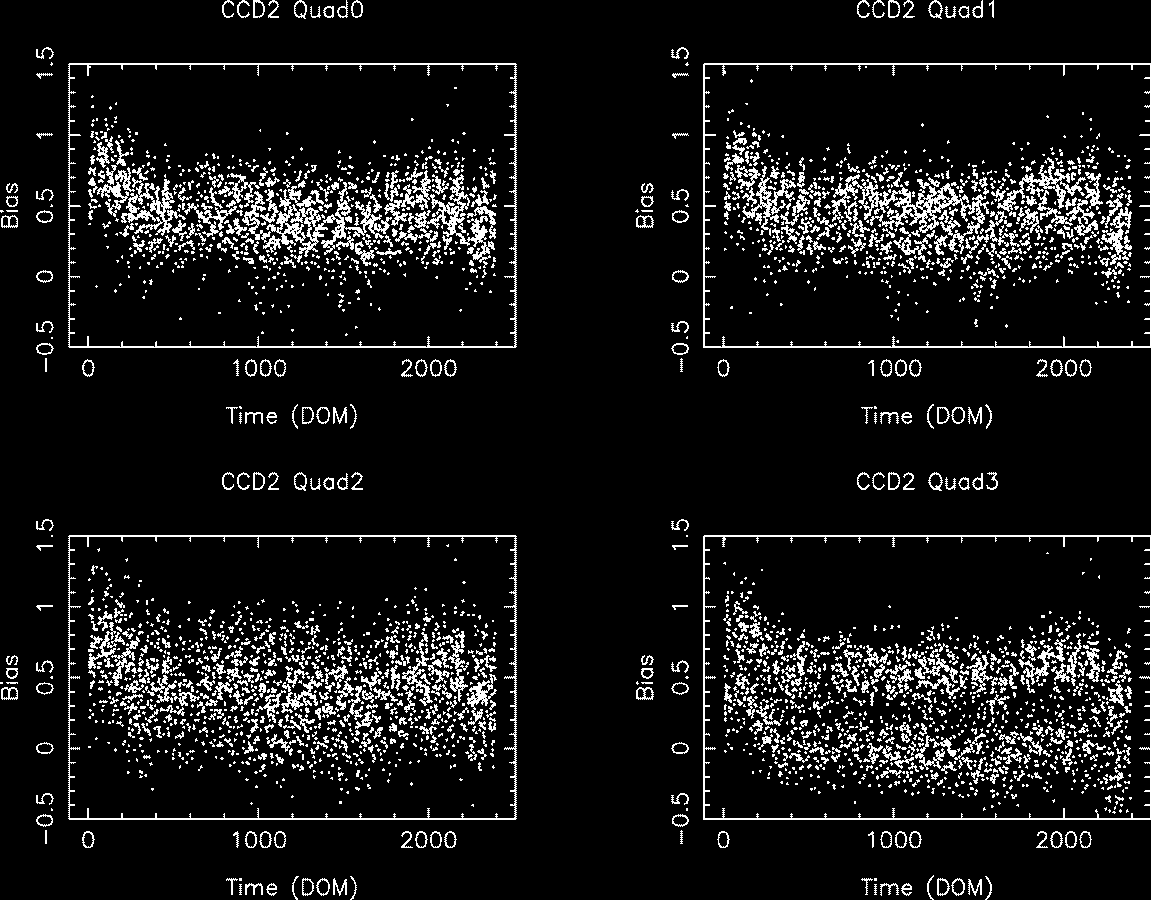
The bias plus overclock level was calculated as follows:
- Get acisf*bias0.fits is obtained from a database or /dsops/ap/sdp/cache/*/acis/
- Data with timed mode exposure is selected.
- Fits files were divided into 4 quads, then an average of bias level for each quad is computed.
No corrections for dead spots, columns etc were included.
CCDS 0,
2 and
8 are the most
extreme.
An example of Overclock values as reported in FITS file header:
An example of mean bias minus overclock value:
 TOP
TOP
