We updated ACIS cumulative dose map from this month. The steps we took to compute a new dose map are;
- Level 1 Event files for a specified month are obtained from archive.
- Image data including I2, I3, S2, S3 CCDs are extracted from all event files.
- All the extracted image data were merged to create a month long exposure map for the month.
- The exposure map is opened with ds9, and check a distribution of count rates against energy.
From this, estimate the upper threshold value. Any events beyond this upper threshold are
assumed erroneous events such as bad pixels.
- Using this upper threshold, the data is filtered, and create a cleaned exposure map for the month.
- The exposure map from each month from the Aug 1999 is added up to create a cumulative exposure
map for each month.
- Using fimgstatistic, we compute count rate statistics for each CCDs.
- For observations with high data drop rates (e.g., Crab nebula, Cas A), we corrected the
observations by adding events.
Note: Counts and RMS's of Cumulative maps are lower than the previous months. This is because we excluded
extreme outliers.
Please check more detail plots at Telemetered Photon Dose Trend page.
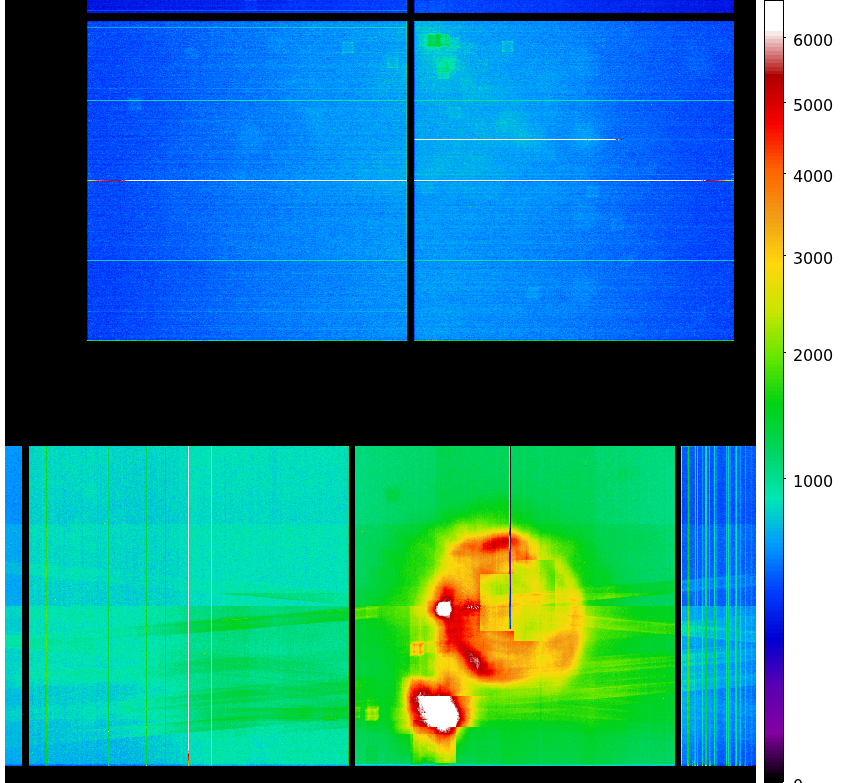
- MARRUARY registered-photon-map in fits
Statistics:
# IMAGE     NPIX        MEAN           RMS               MIN   MAX
ACIS_mar06 6004901      10.464         14.318            0.0   777.0

 I2 node 0  262654      8.309566        3.404941        0.0      40.0
 I2 node 1  262654      8.790035        3.736332        0.0     282.0
 I2 node 2  262654      8.772263        3.547854        0.0      60.0
 I2 node 3  262654      8.606453        3.680912        0.0      51.0

 I3 node 0  262654      9.870183        5.050647        0.0     130.0
 I3 node 1  262654      11.580257       9.433736        0.0     209.0
 I3 node 2  262654      9.971819        3.997668        0.0      61.0
 I3 node 3  262654      8.981659        3.642638        0.0     177.0

 I2 node 0  262654      17.185367       5.540697        1.0     139.0
 I2 node 1  262654      21.628264       9.834290        0.0     109.0
 I2 node 2  262654      22.703240       10.855095       2.0     116.0
 I2 node 3  262654      15.473240       4.529087        0.0     303.0

 I3 node 0  262654      15.982280       9.095335        0.0     220.0
 I3 node 1  262654      17.645082       7.355553        0.0     113.0
 I3 node 2  262654      15.423943       4.472154        1.0      45.0
 I3 node 3  262654      13.863527       4.052348        0.0      60.0
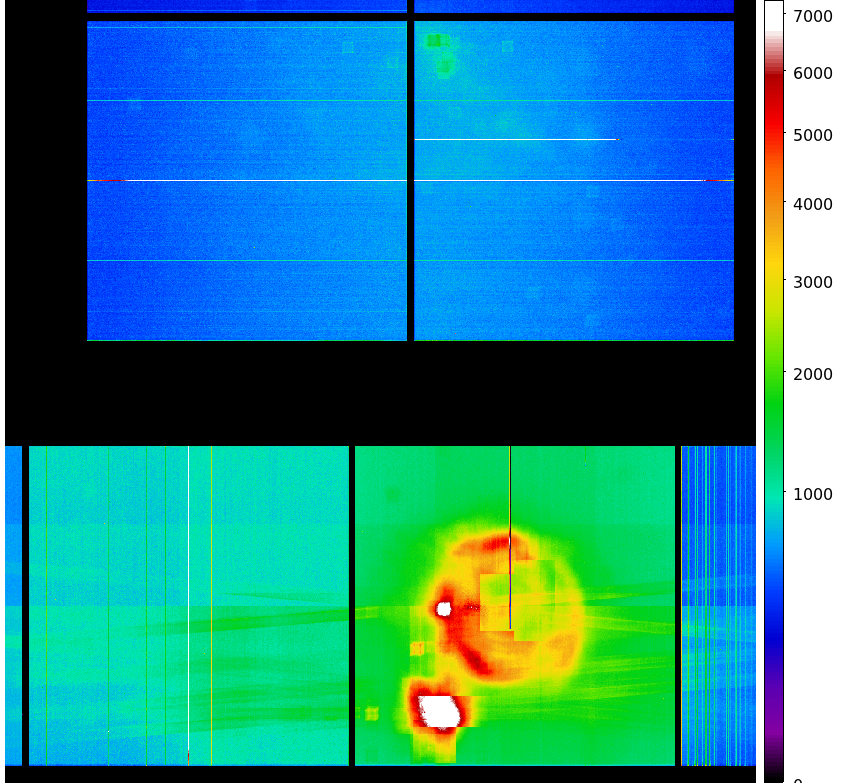
- Aug 1999 - Mar 2006 registered-photon-map in fits
Statistics:
 IMAGE        NPIX      MEAN          RMS              MIN    MAX
ACIS_total  6004901   861.911       1217.650           0.0   50800.0

 I2 node 0  262654      601.764622      104.278557      0.0     2305.0
 I2 node 1  262654      633.734398      143.242816      0.0     3925.0
 I2 node 2  262654      638.148857      113.448583      0.0     2057.0
 I2 node 3  262654      638.431249      144.375260      0.0     2967.0

 I3 node 0  262654      690.569723      170.081834      0.0     3335.0
 I3 node 1  262654      712.652981      468.617849      0.0     12749.0
 I3 node 2  262654      636.799402      104.183889      0.0     2432.0
 I3 node 3  262654      629.361332      113.184190      0.0     11602.0

 I2 node 0  262654      983.355499      120.762661      454.0   3320.0
 I2 node 1  262654      1041.732695     209.603159      478.0   5015.0
 I2 node 2  262654      1186.455342     244.240785      642.0   8411.0
 I2 node 3  262654      1156.112796     198.108874      636.0   7211.0

 I3 node 0  262654      1948.446523     1152.501277     690.0   10277.0
 I3 node 1  262654      3069.624043     1688.773794     0.0     11266.0
 I3 node 2  262654      2121.470213     710.876275      586.0   4723.0
 I3 node 3  262654      1542.502132     271.436134      724.0   3696.0
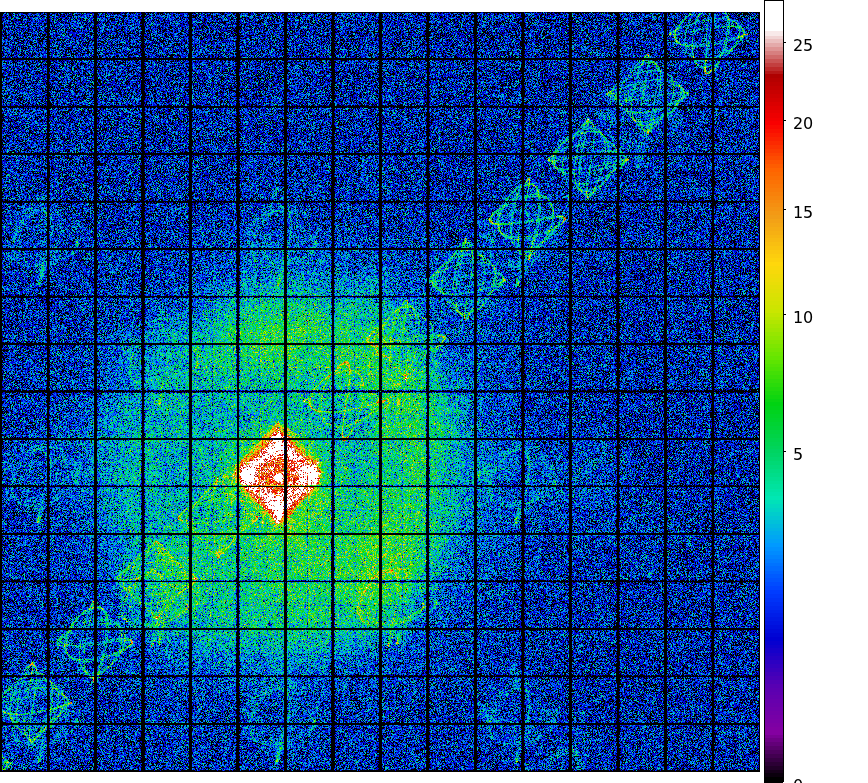
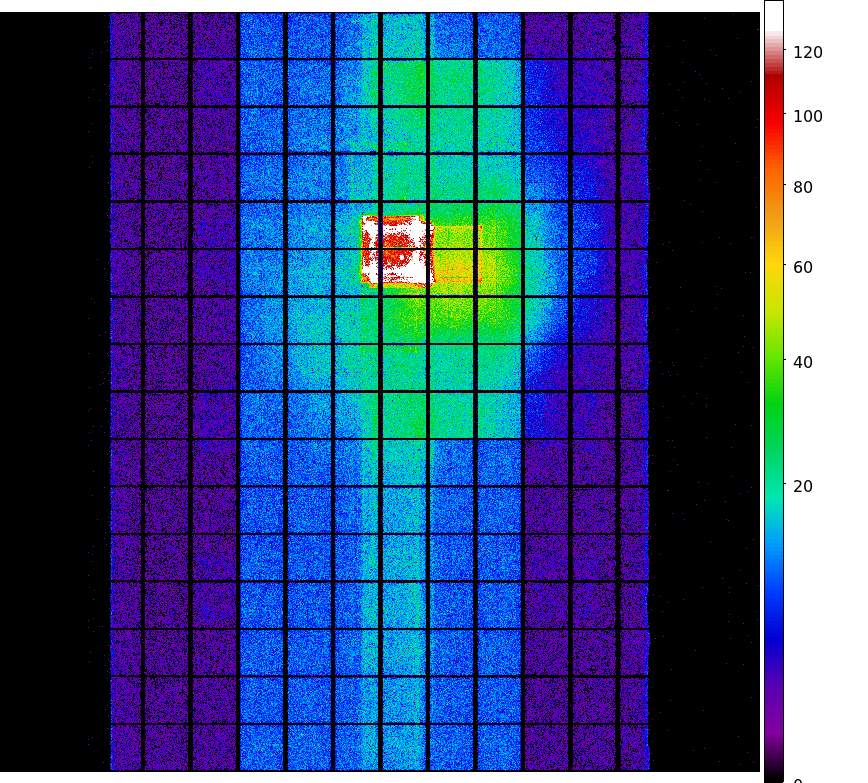
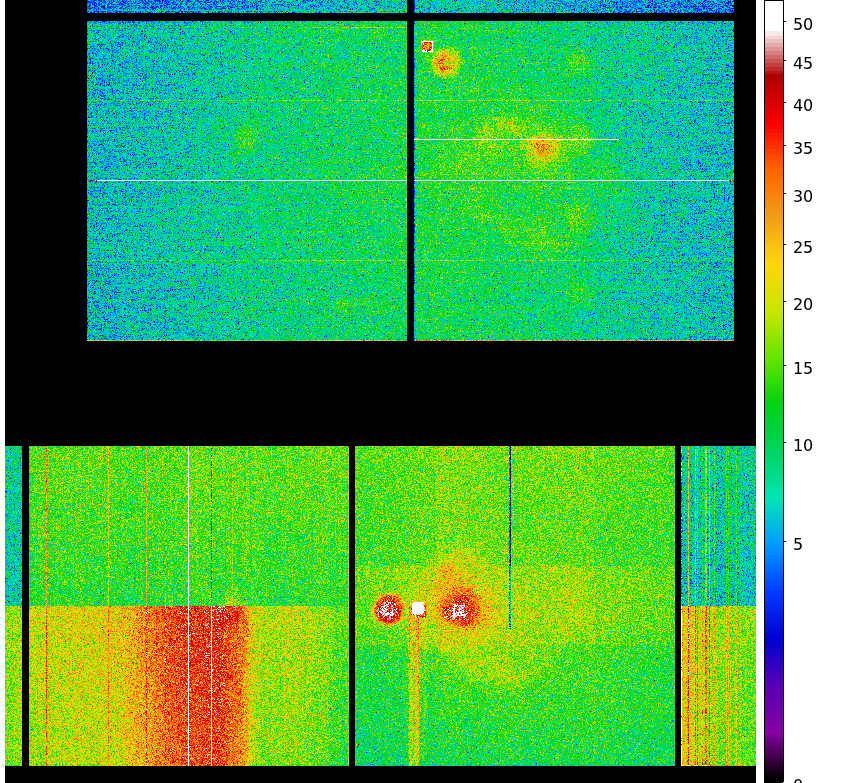
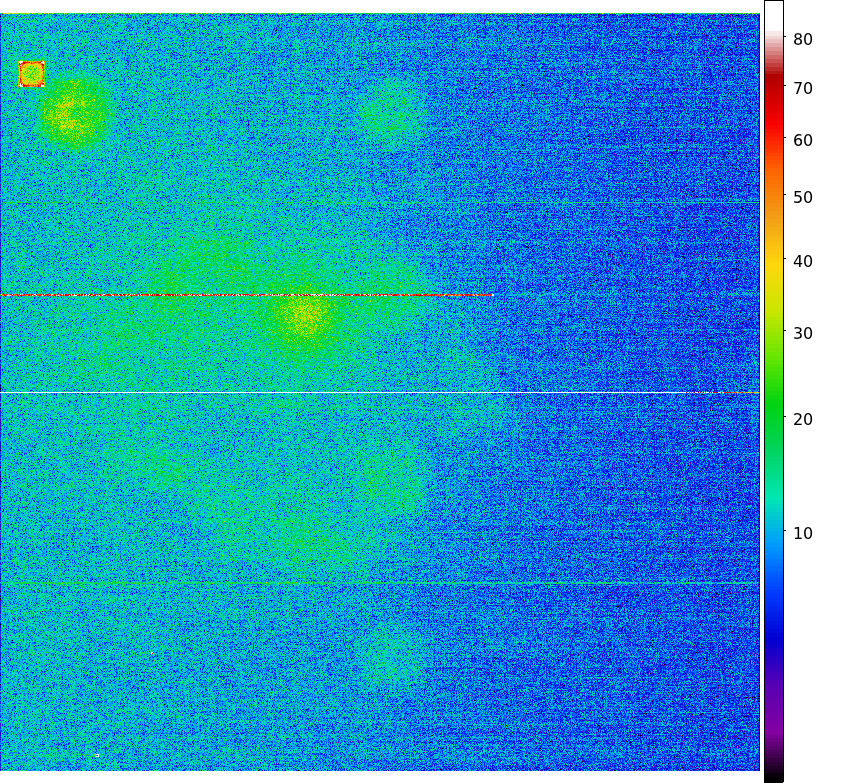
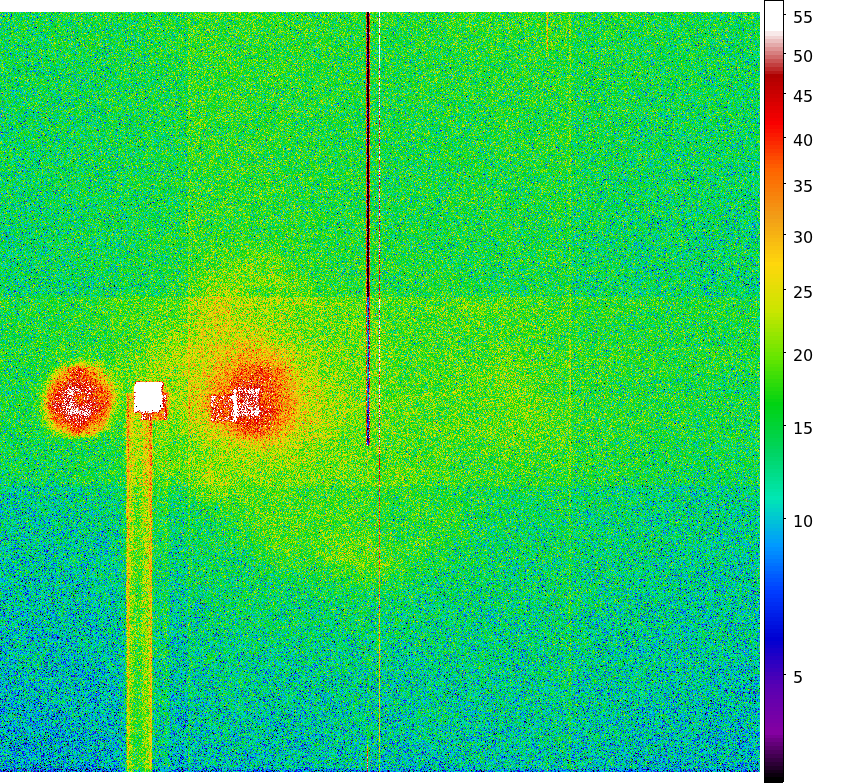
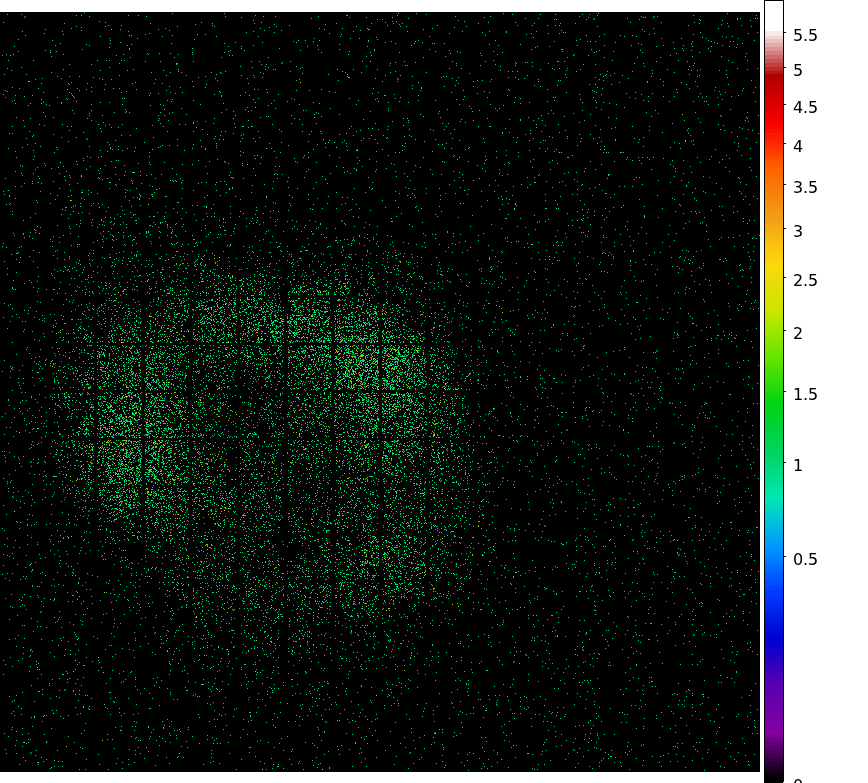
- MAR 2006 dose PNG image
- MAR I3 dose PNG image
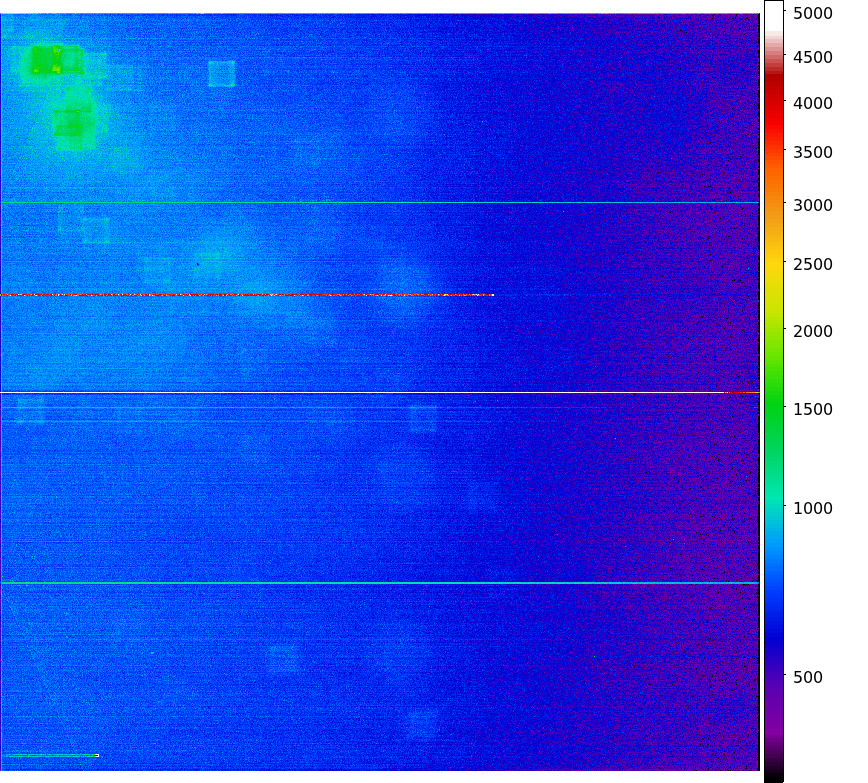
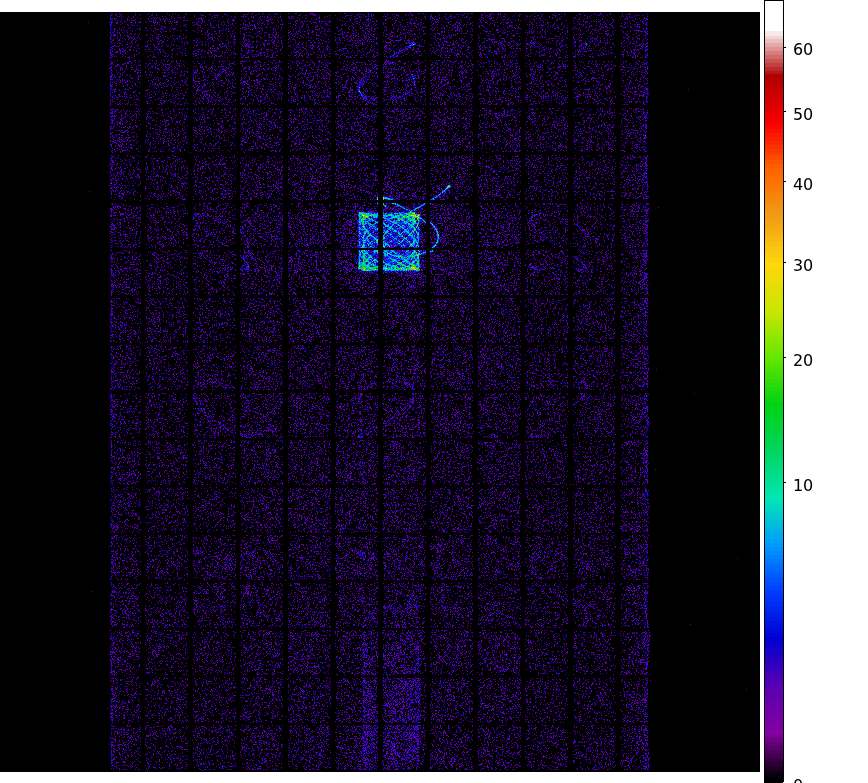
- MAR S3 dose PNG image
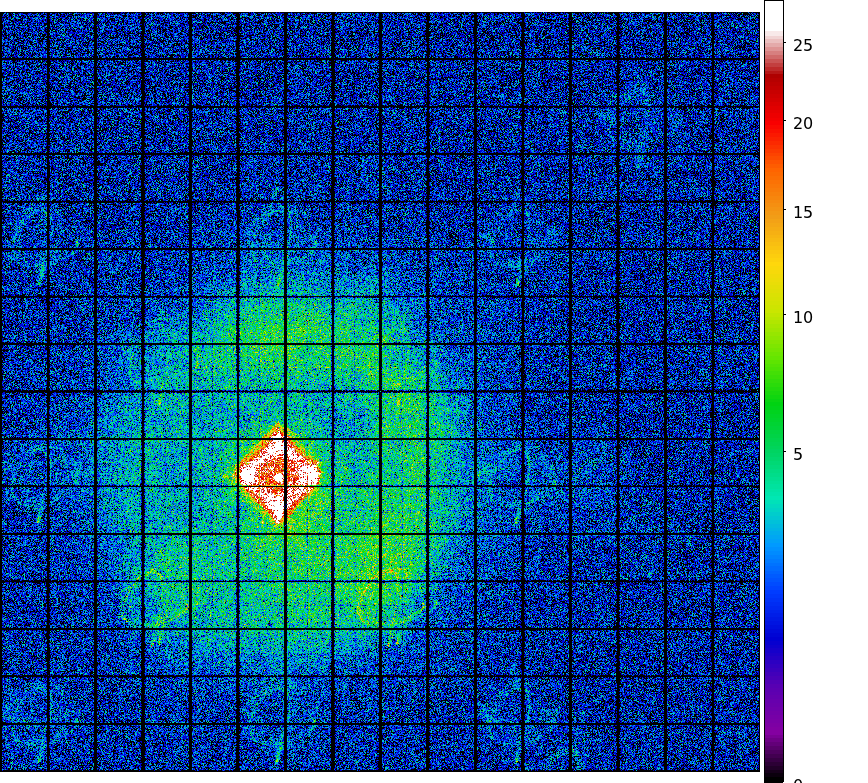
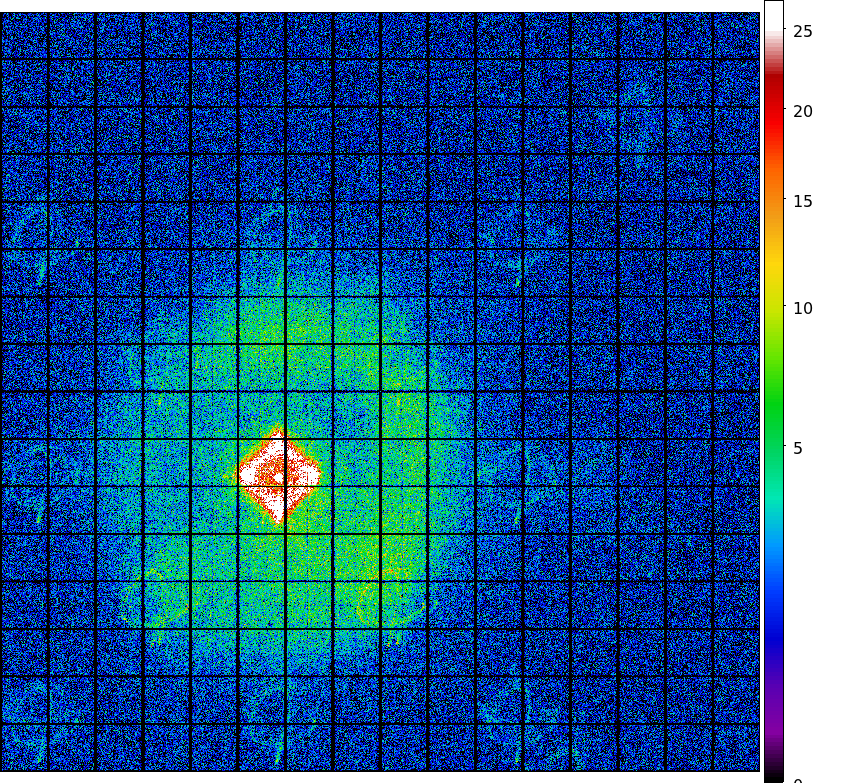
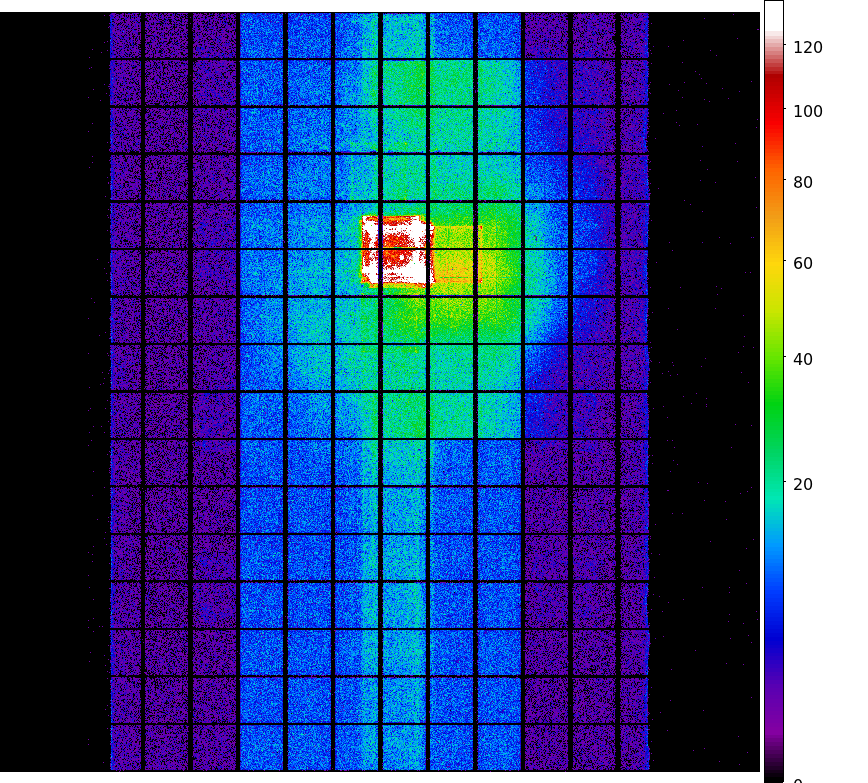
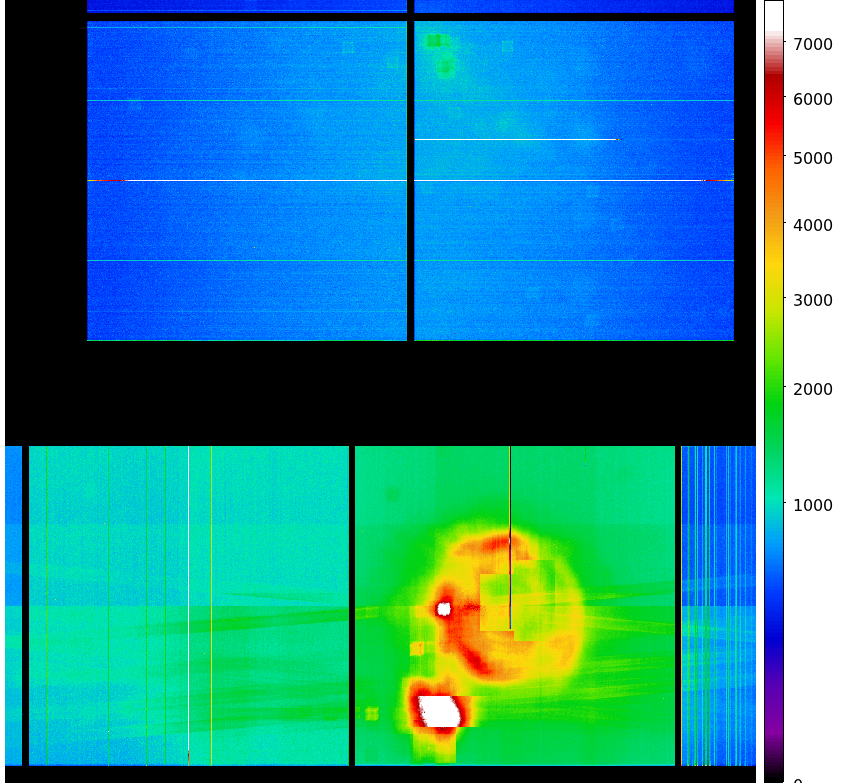
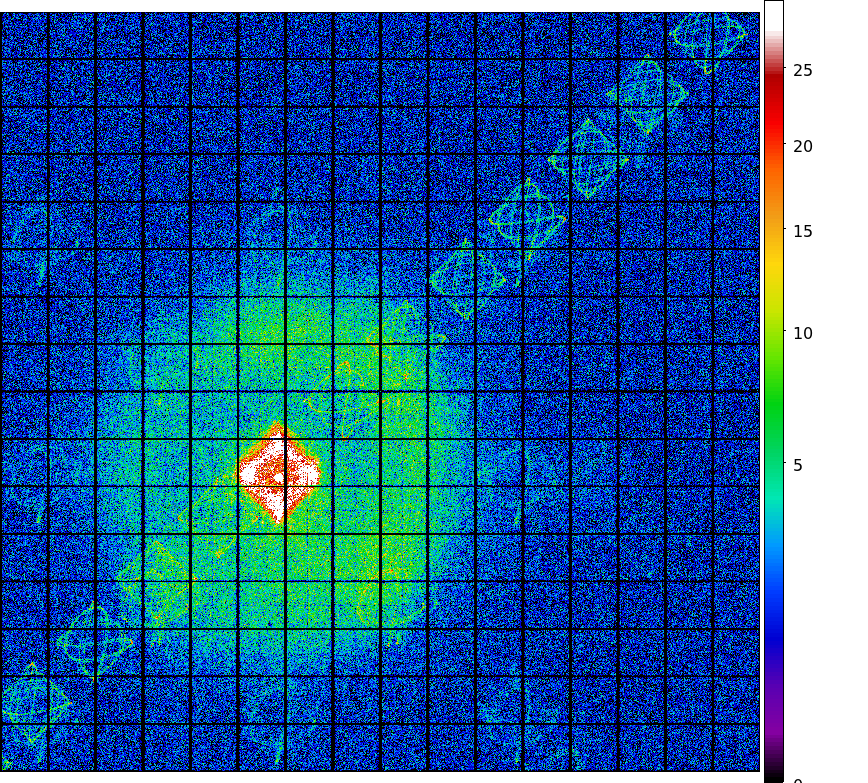
- TOTAL AUG 1999 - MAR 2006 dose PNG image
- TOTAL I3 dose PNG image
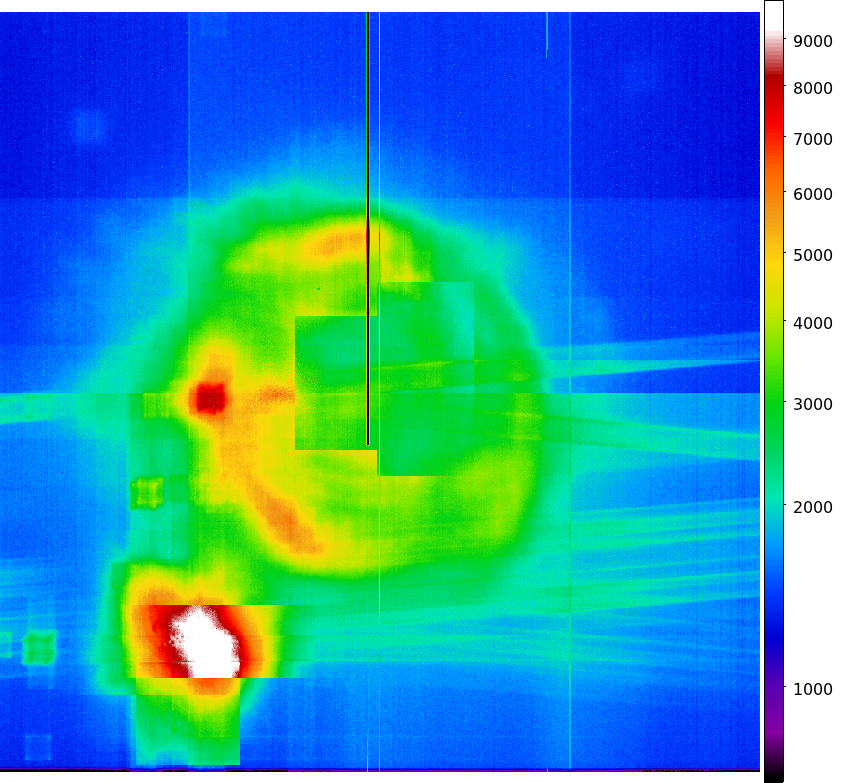
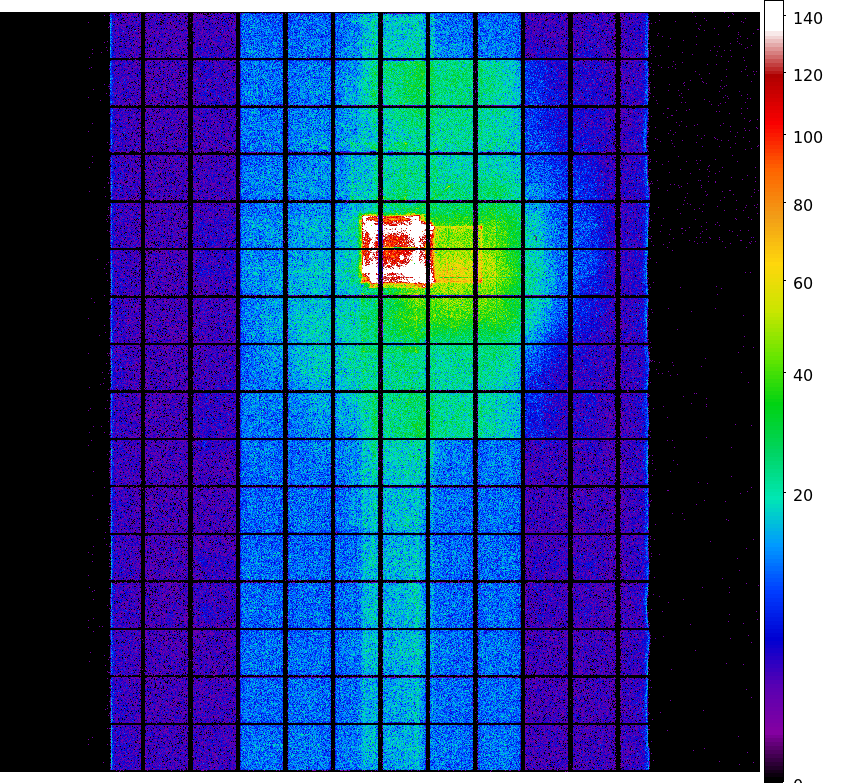
- TOTAL S3 dose PNG image


)
)
)
)
)
)
)
)
)
)
)
)