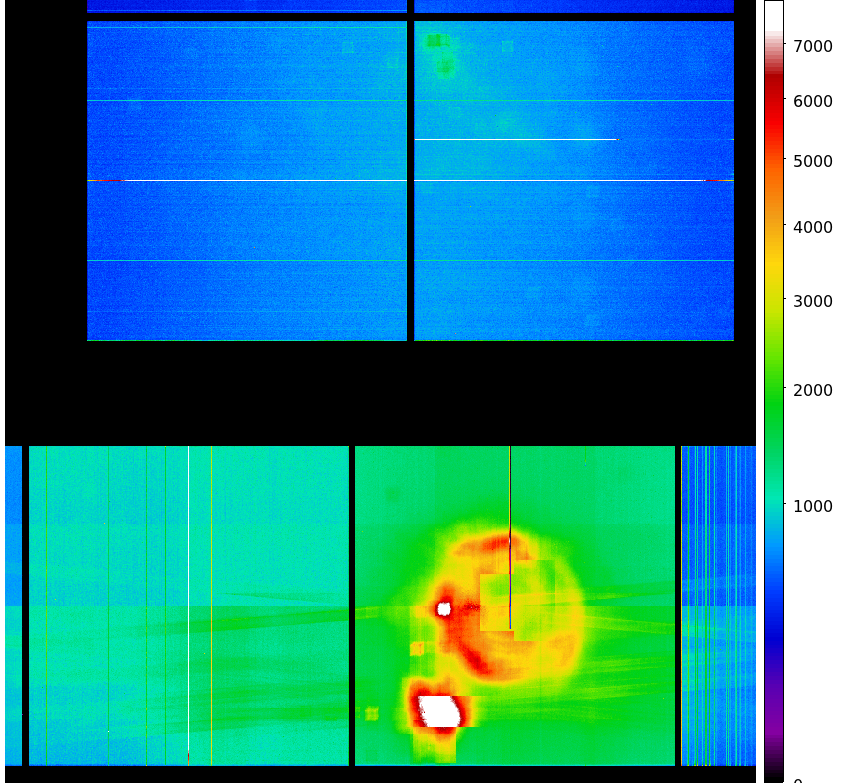
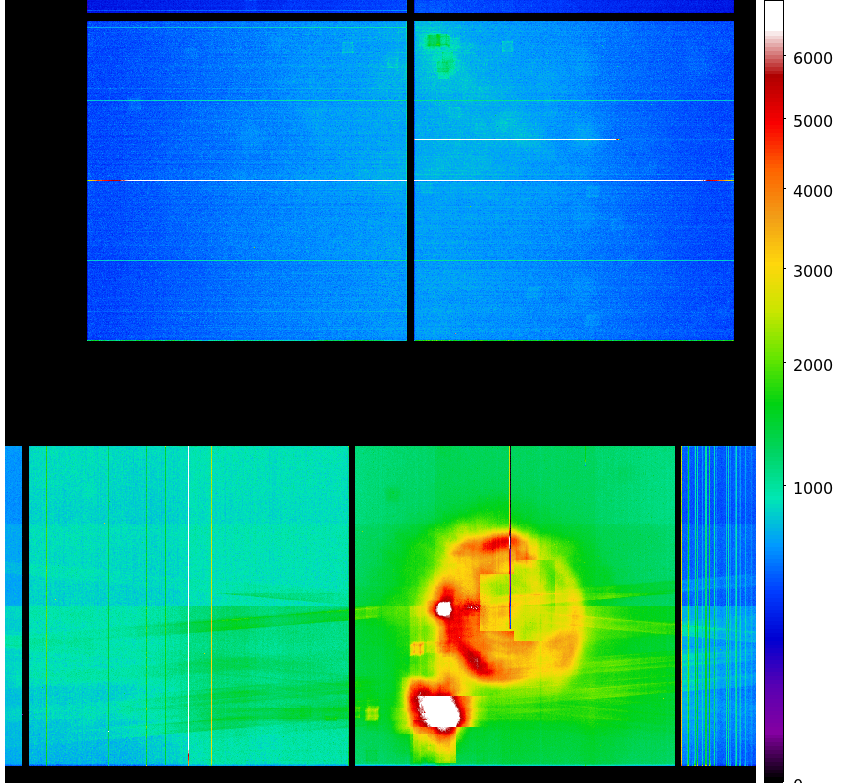
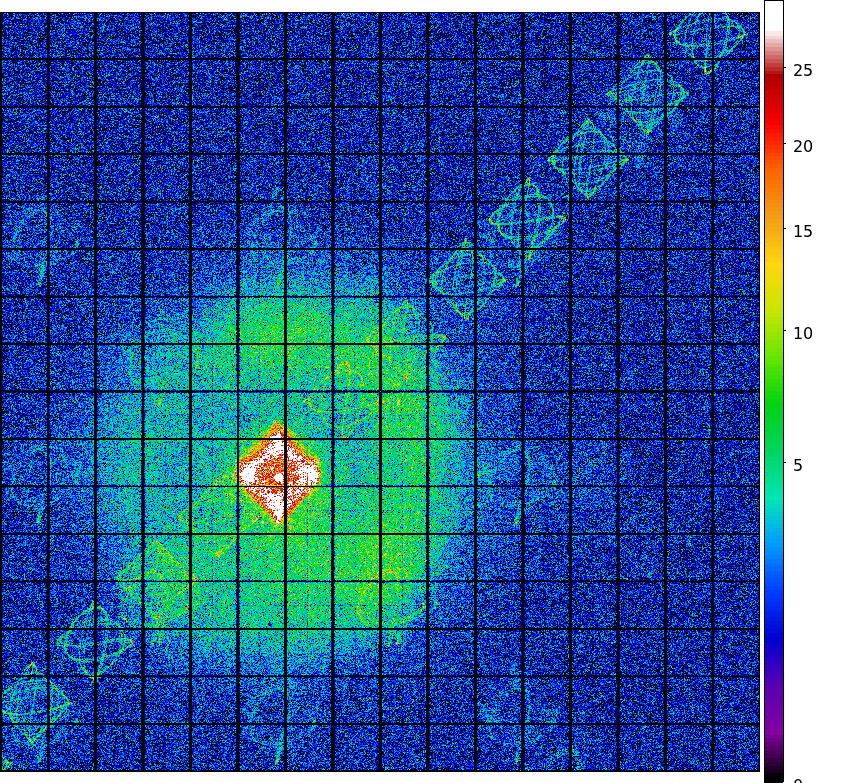
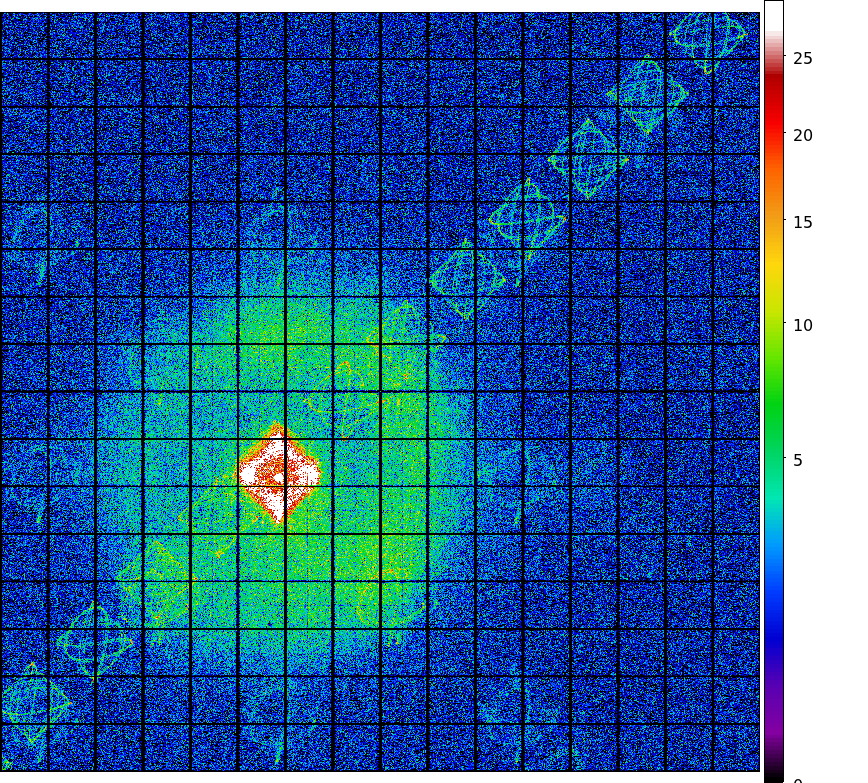
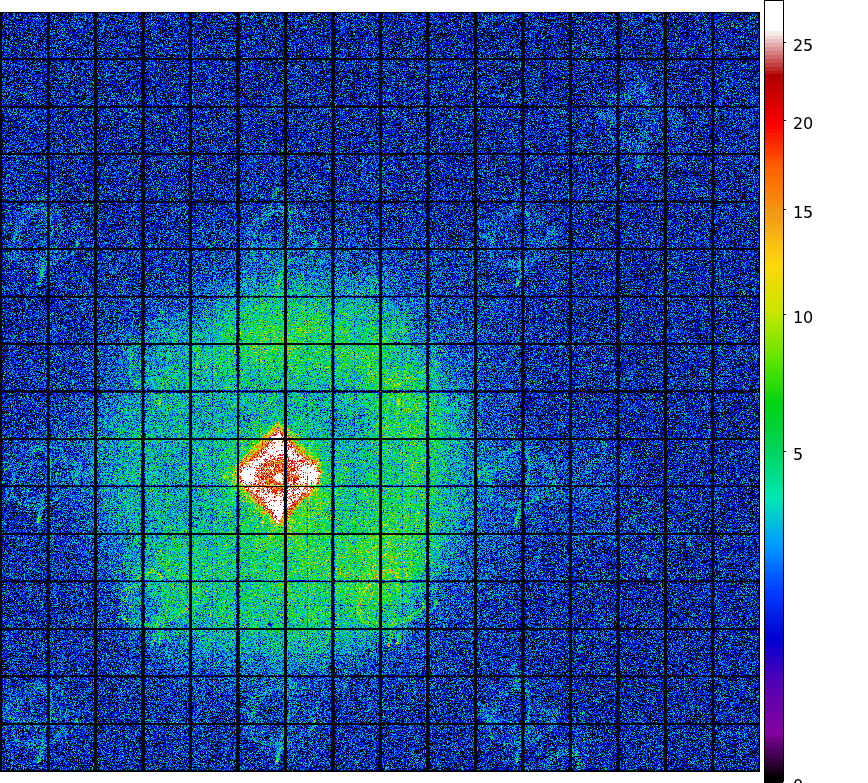
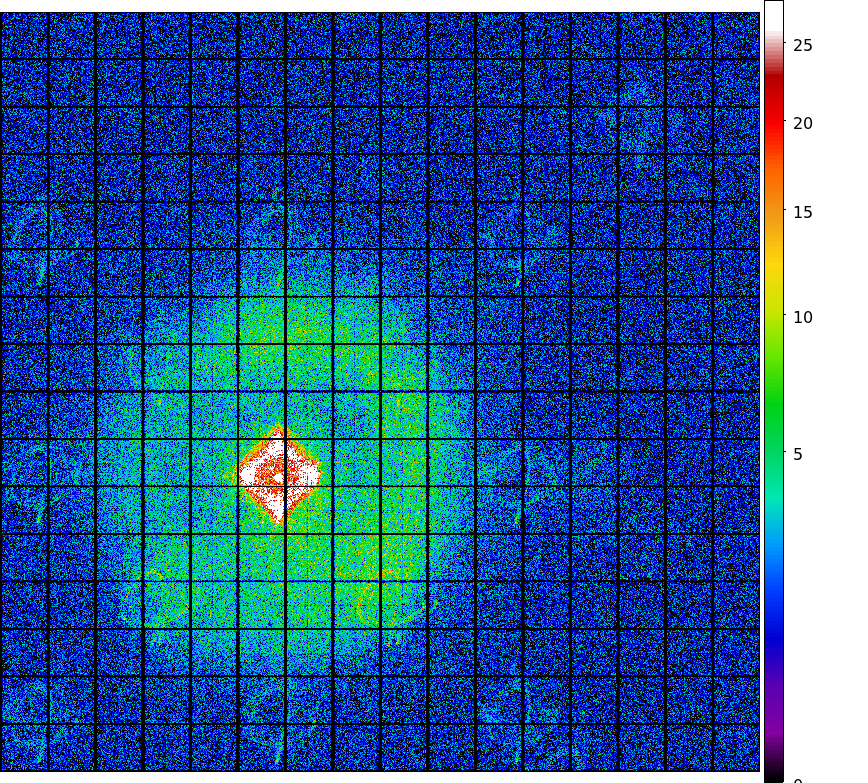
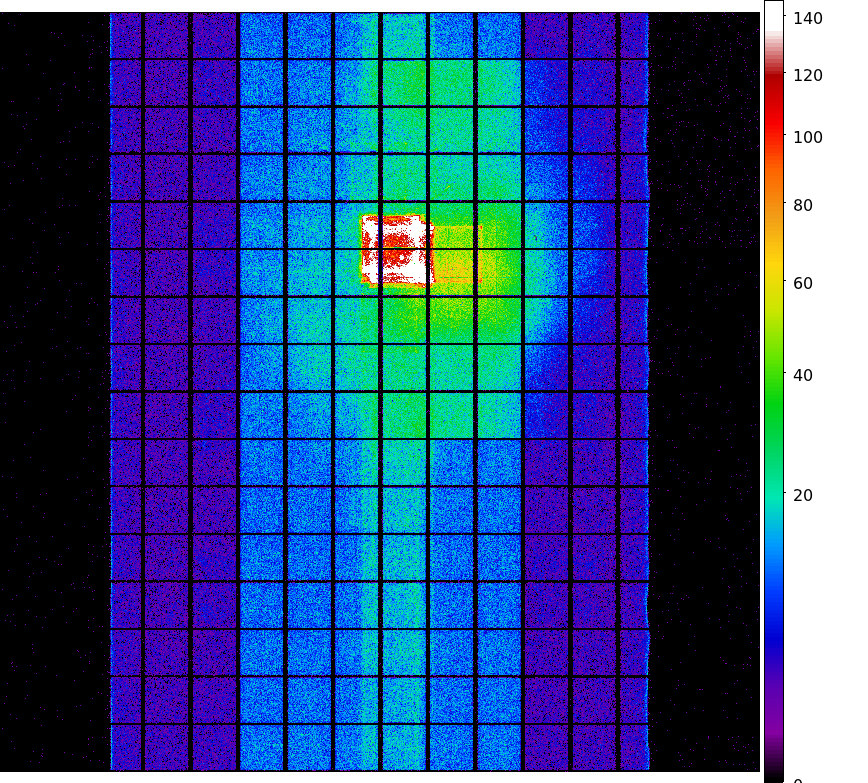
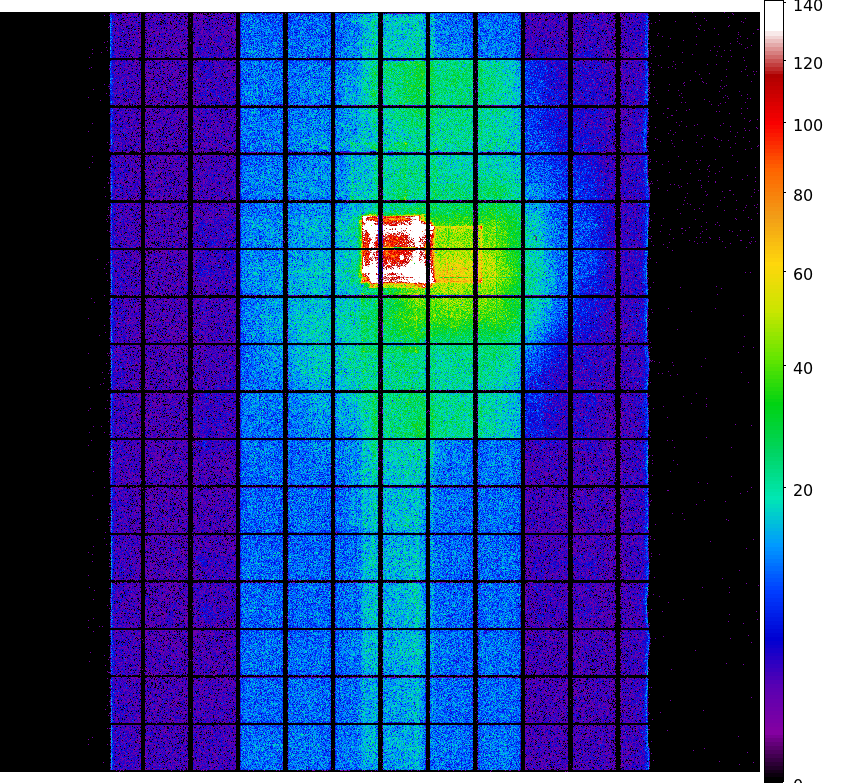
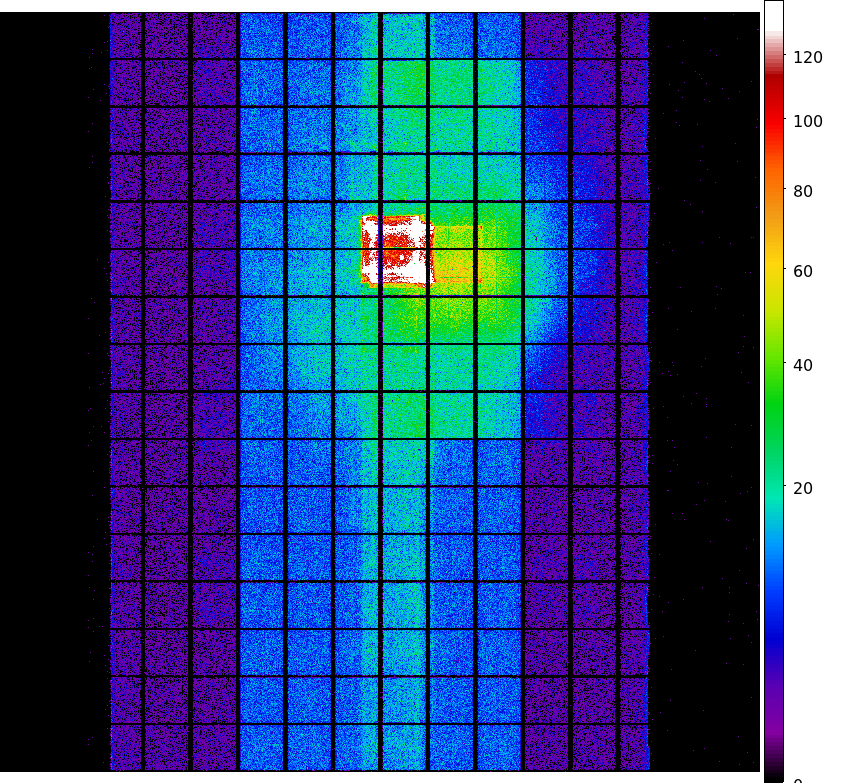
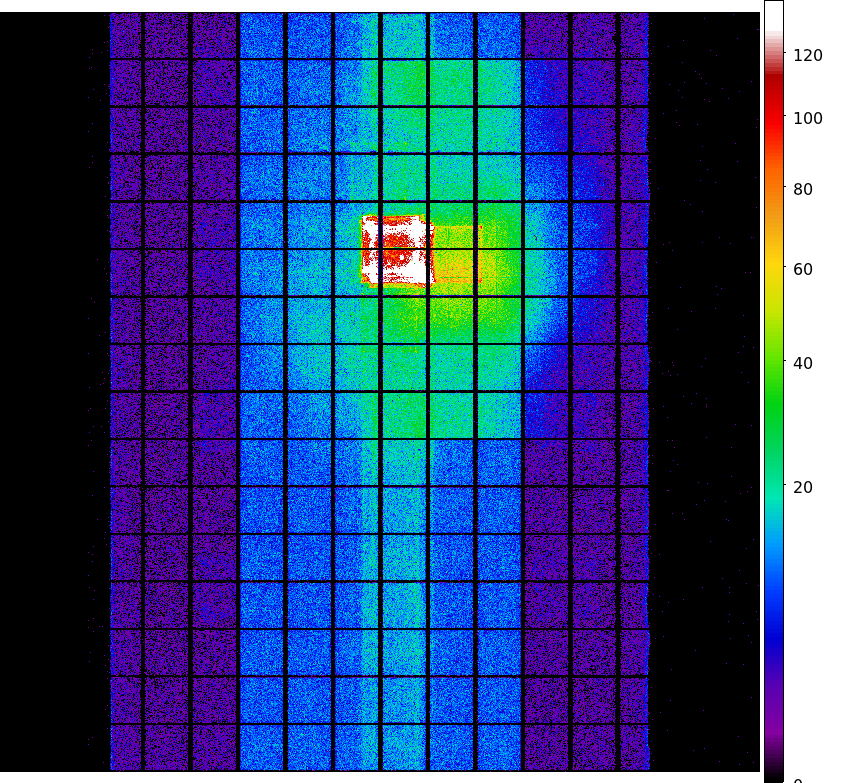
The steps we took to compute the dose map are;
- Level 1 Event files for a specified month are obtained from archive.
- Image data including I2, I3, S2, S3 CCDs are extracted from all event files.
- All the extracted image data were merged to create a month long exposure map for the month.
- The exposure map is opened with ds9, and check a distribution of count rates against energy.
From this, estimate the upper threshold value. Any events beyond this upper threshold are
assumed erroneous events such as bad pixels.
- Using this upper threshold, the data is filtered, and create a cleaned exposure map for the month.
- The exposure map from each month from the Aug 1999 is added up to create a cumulative exposure
map for each month.
- Using fimgstatistic, we compute count rate statistics for each CCDs.
- For observations with high data drop rates (e.g., Crab nebula, Cas A), we corrected the
observations by adding events.
Note: Counts and RMS's of Cumulative maps are lower than the previous months. This is because we excluded
extreme outliers.
Please check more detail plots at Telemetered Photon Dose Trend page.
- JUL registered-photon-map in fits
Statistics:
# IMAGE     NPIX        MEAN           RMS              MIN     MAX
ACIS_jul06 6004901      14.9613        34.331           0.0    990.0

 I2 node 0  262654      9.449642        3.620063        0.0      60.0
 I2 node 1  262654      10.114114       4.081870        0.0     356.0
 I2 node 2  262654      10.453339       4.533865        0.0     103.0
 I2 node 3  262654      9.882995        3.967465        0.0      57.0

 I3 node 0  262654      9.668411        3.728231        0.0      47.0
 I3 node 1  262654      10.382519       9.427812        0.0     211.0
 I3 node 2  262654      9.382061        3.519292        0.0      50.0
 I3 node 3  262654      9.423279        3.618857        0.0     201.0

 I2 node 0  262654      15.036305       4.521709        1.0      67.0
 I2 node 1  262654      16.571281       6.090833        2.0     103.0
 I2 node 2  262654      22.017816       9.635474        1.0     117.0
 I2 node 3  262654      22.621936       10.343121       1.0     358.0

 I3 node 0  262654      53.161198       116.585883      2.0     990.0
 I3 node 1  262654      52.952933       53.048399       0.0     448.0
 I3 node 2  262654      35.053332       41.873304       2.0     411.0
 I3 node 3  262654      24.040239       11.875091       2.0     210.0
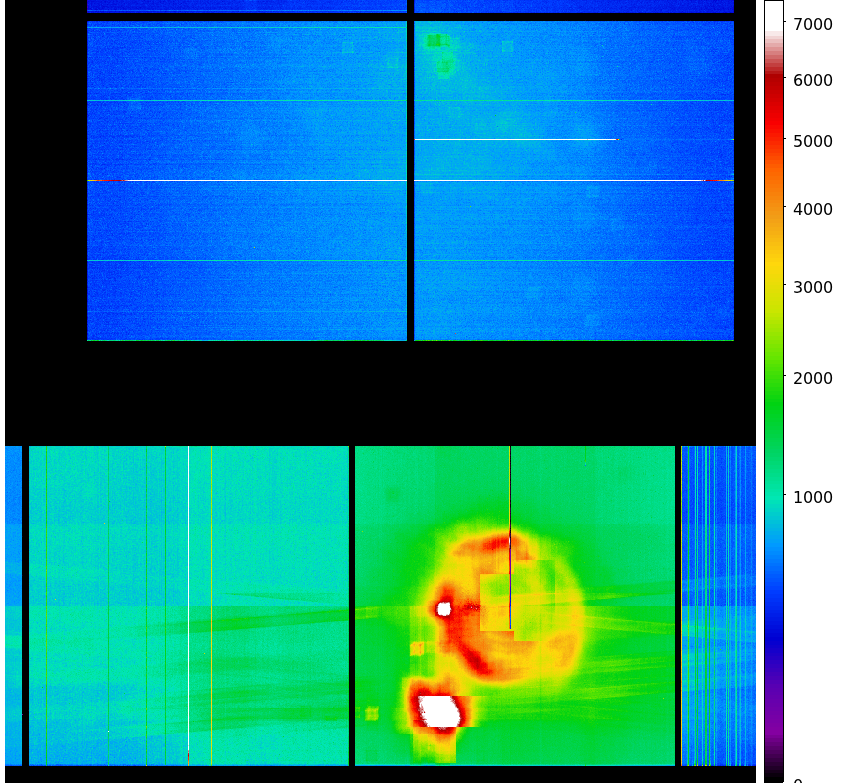
- Aug 1999 - Jul 2006 registered-photon-map in fits
Statistics:
 IMAGE        NPIX      MEAN          RMS              MIN    MAX
ACIS_total  6004901   910.404       1281.566           0.0   43766.0

 I2 node 0  262654      640.172932      111.565618      0.0     2518.0
 I2 node 1  262654      674.458395      152.565922      0.0     5280.0
 I2 node 2  262654      678.840759      120.789107      0.0     2290.0
 I2 node 3  262654      678.254956      153.459916      0.0     3175.0

 I3 node 0  262654      729.435473      177.678270      0.0     4684.0
 I3 node 1  262654      753.750183      503.095427      0.0     13607.0
 I3 node 2  262654      674.229128      110.703467      0.0     2633.0
 I3 node 3  262654      666.829456      120.552323      0.0     12330.0

 I2 node 0  262654      1041.240173     130.008904      483.0   12348.0
 I2 node 1  262654      1103.296195     222.304491      515.0   5372.0
 I2 node 2  262654      1257.537860     256.550926      696.0   8765.0
 I2 node 3  262654      1227.142579     209.152738      695.0   9323.0

 I3 node 0  262654      2057.896078     1212.580242     748.0   10350.0
 I3 node 1  262654      3218.344577     1732.002267     0.0     11358.0
 I3 node 2  262654      2234.184367     749.178290      633.0   4806.0
 I3 node 3  262654      1623.046728     285.579744      780.0   6974.0
- JUL 2006 dose PNG image
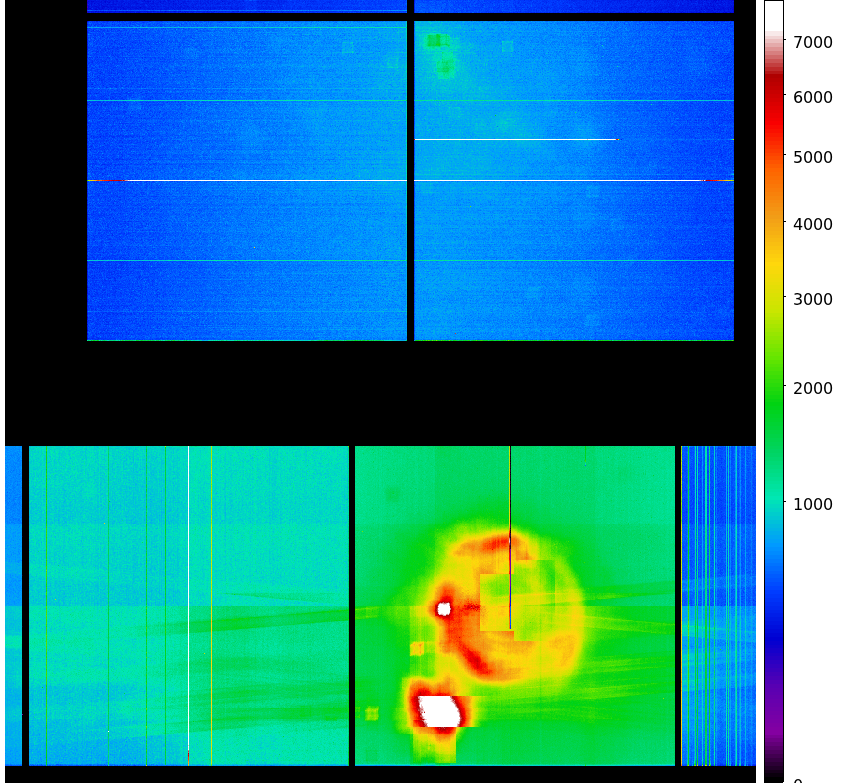
- JUL I3 dose PNG image
- JUL S3 dose PNG image
- TOTAL AUG 1999 - JUL 2006 dose PNG image
- TOTAL I3 dose PNG image
- TOTAL S3 dose PNG image
