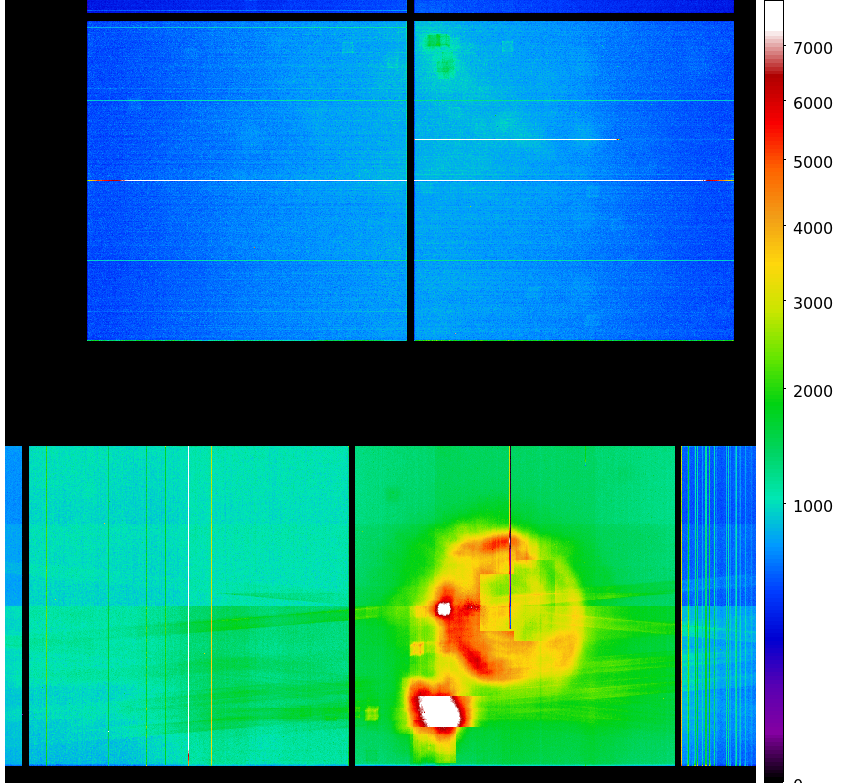
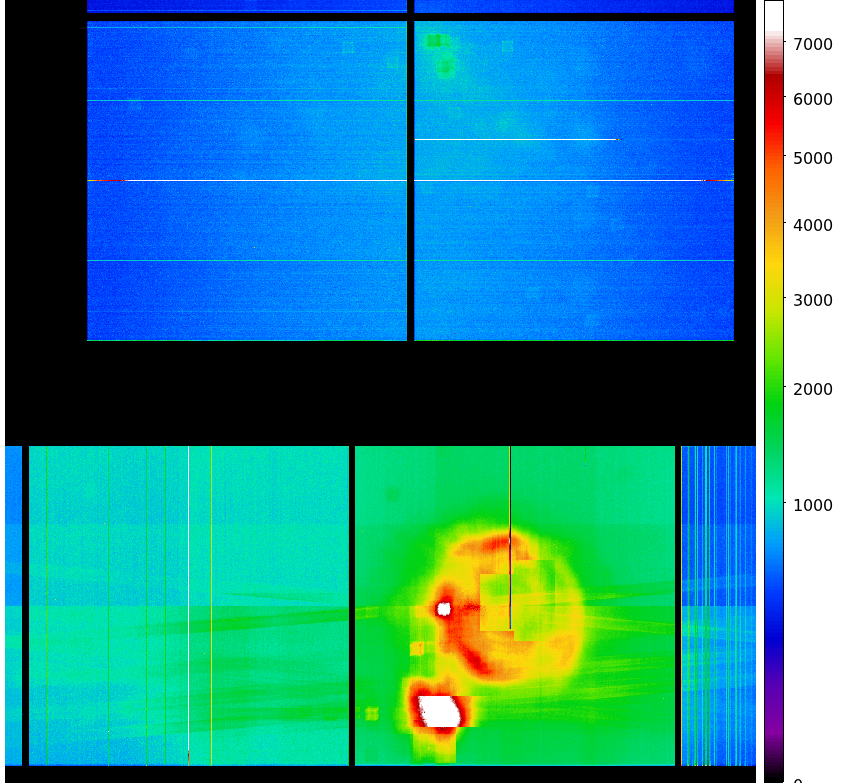
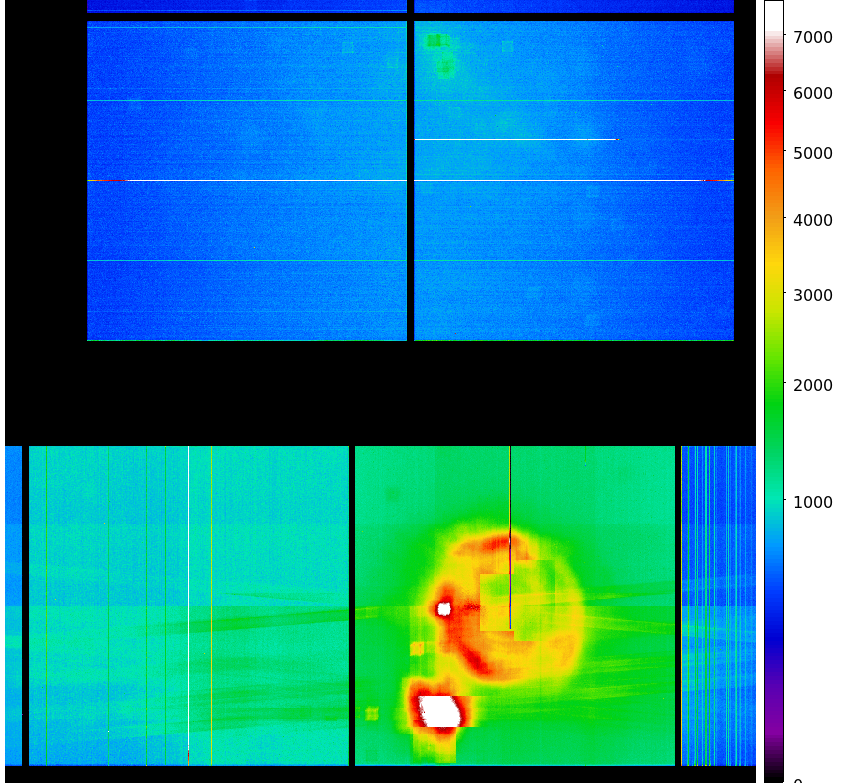
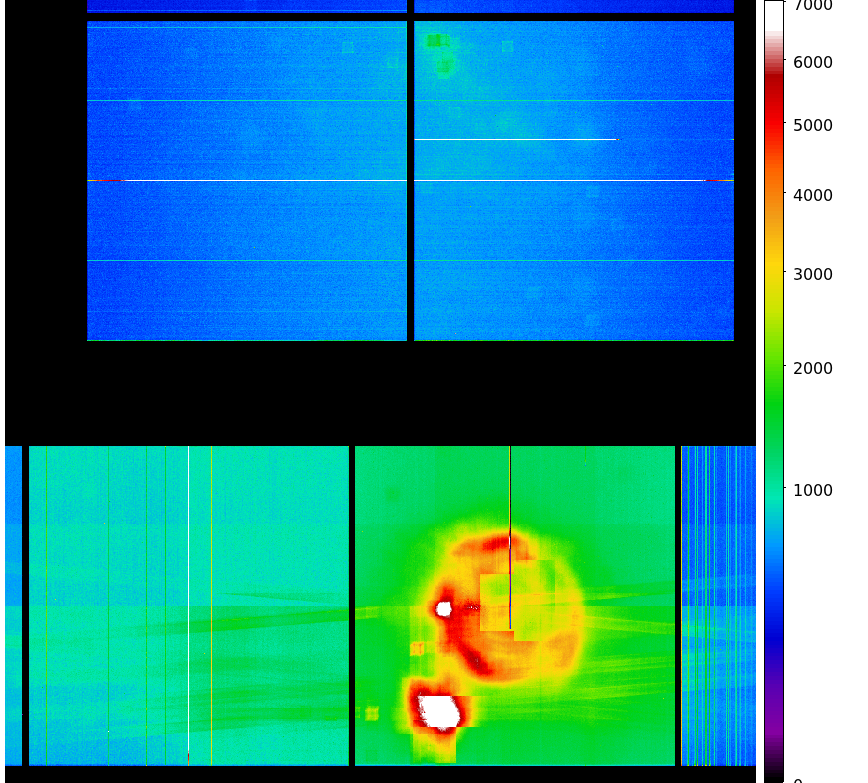
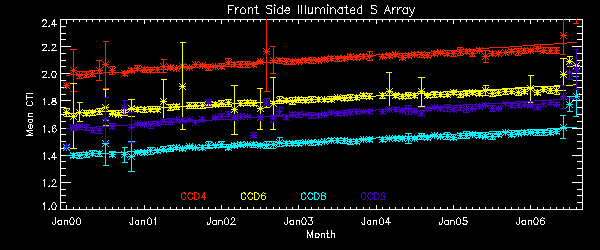
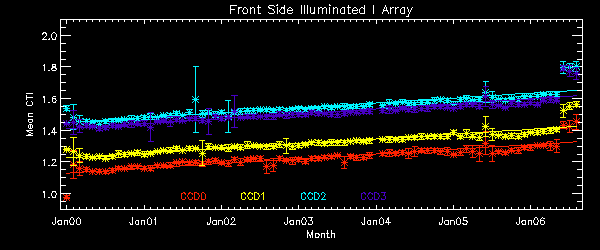
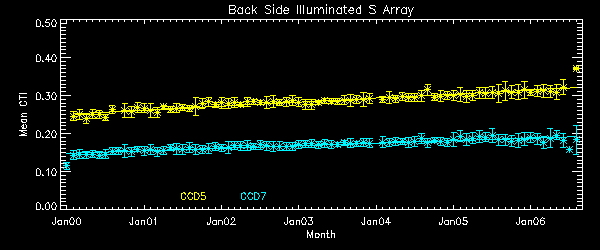
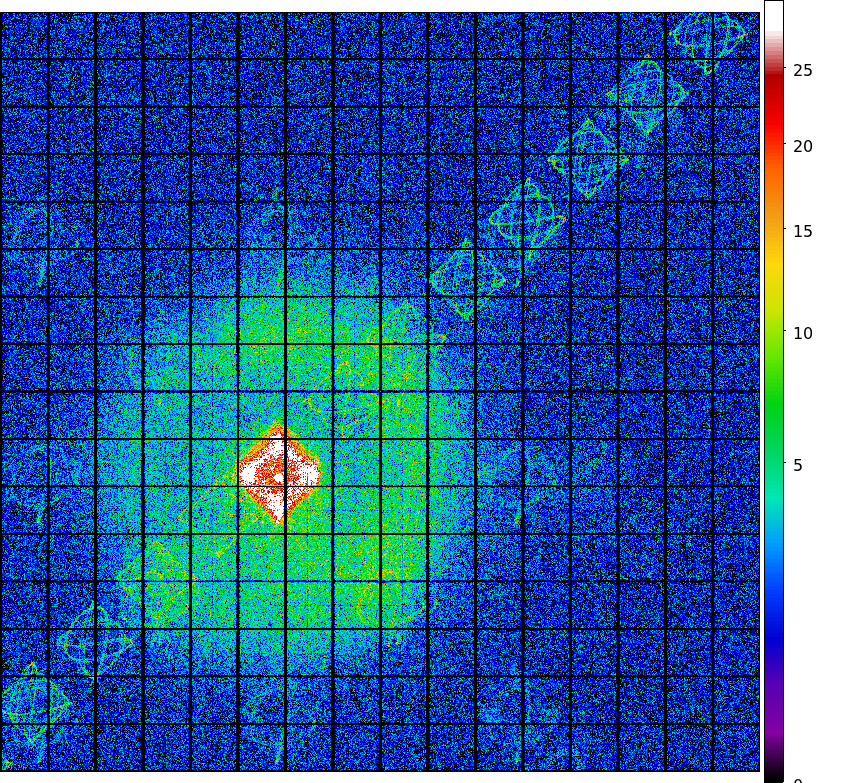
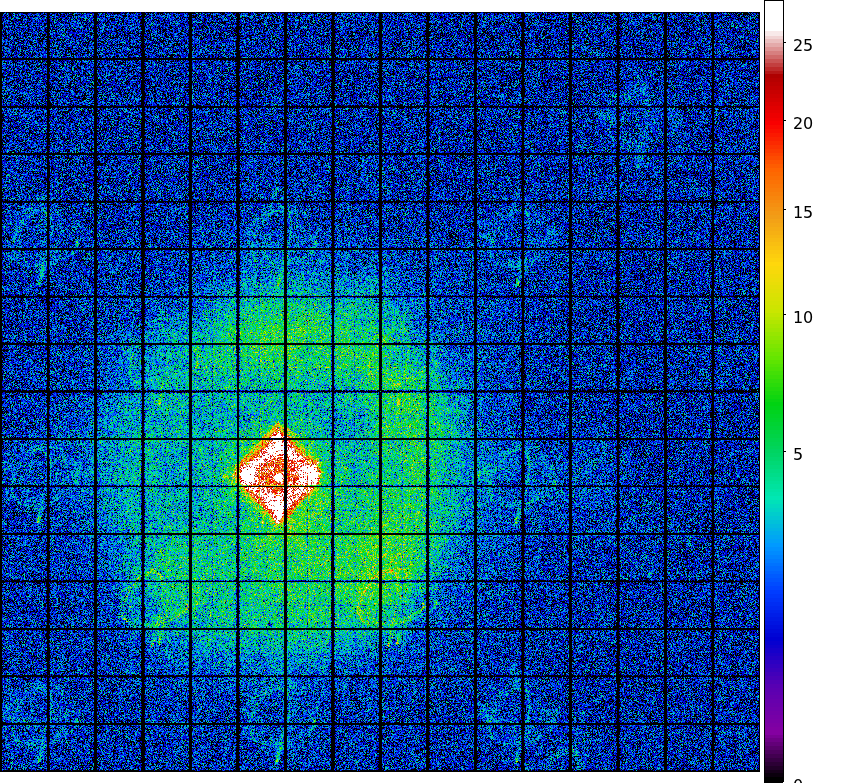
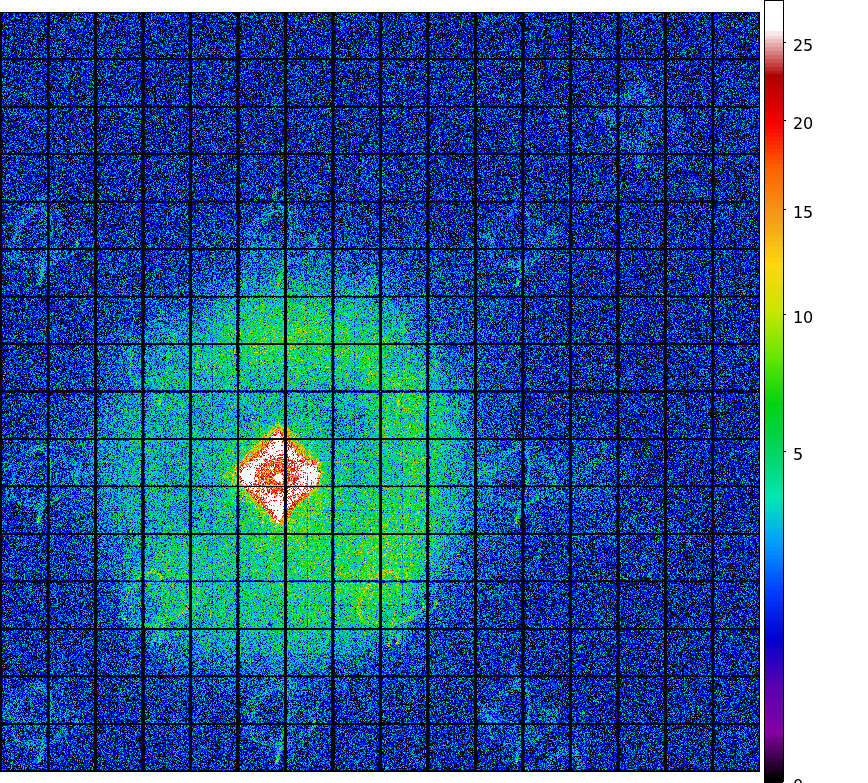
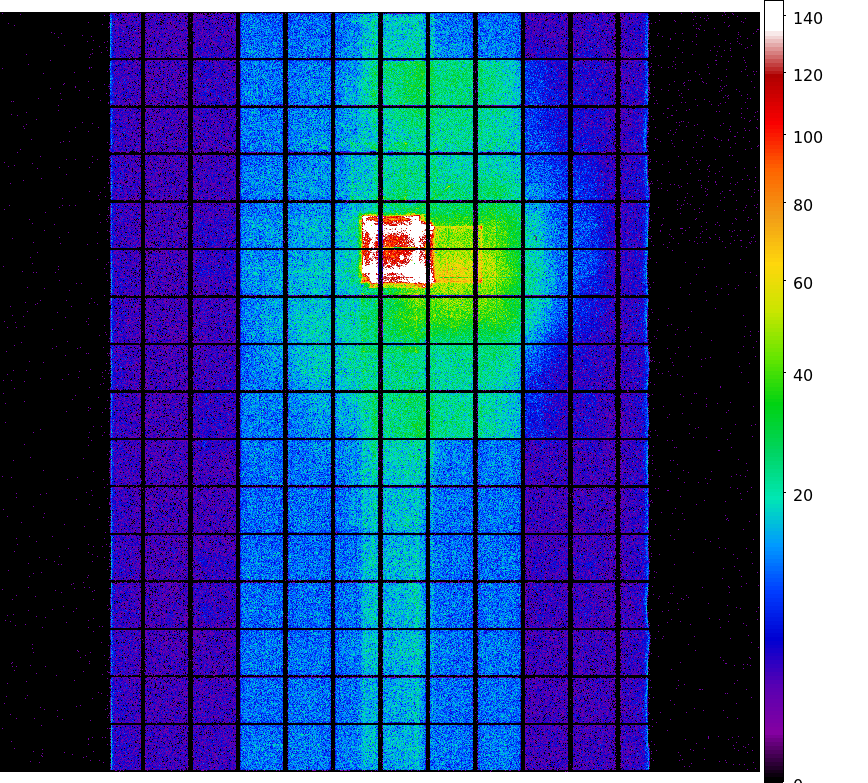
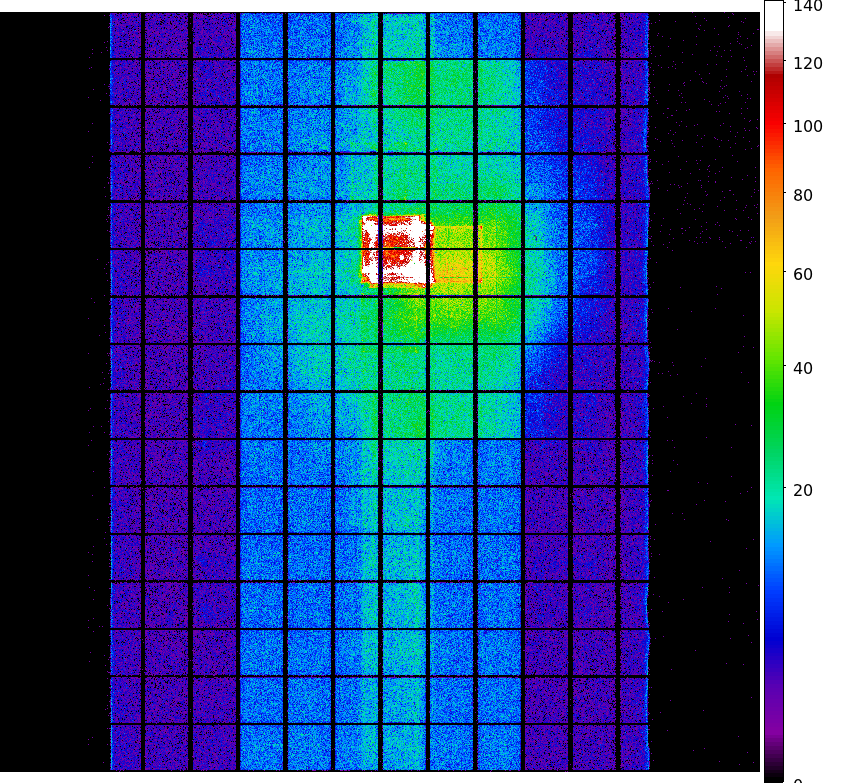
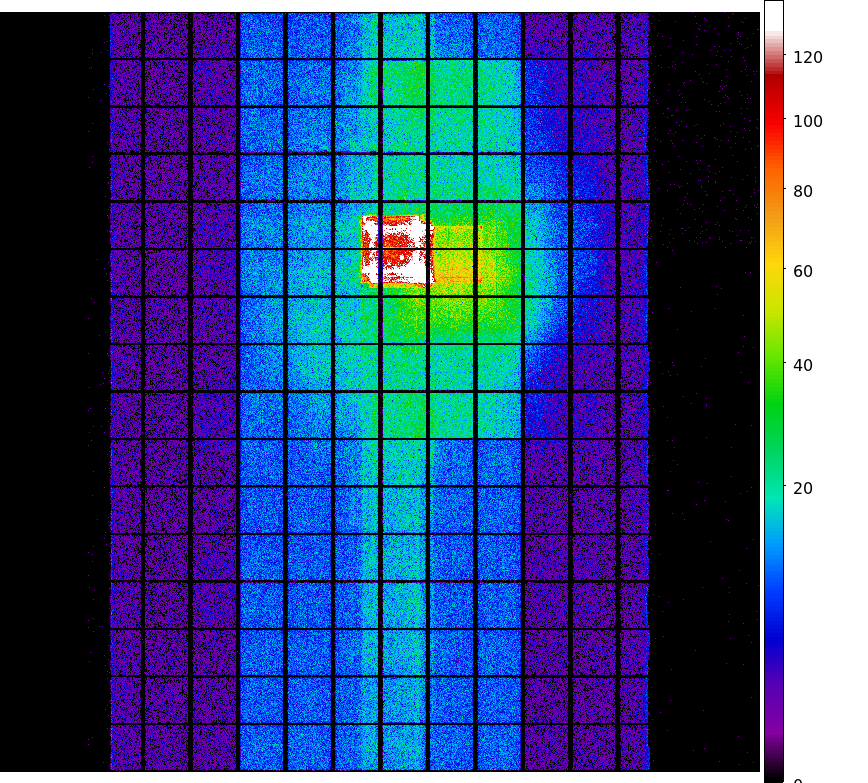
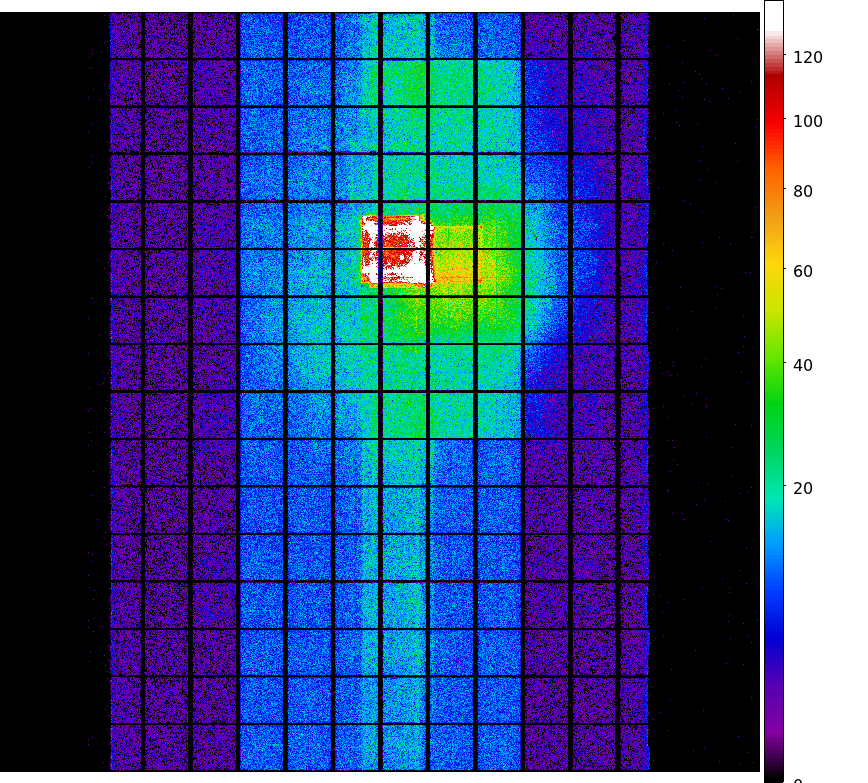
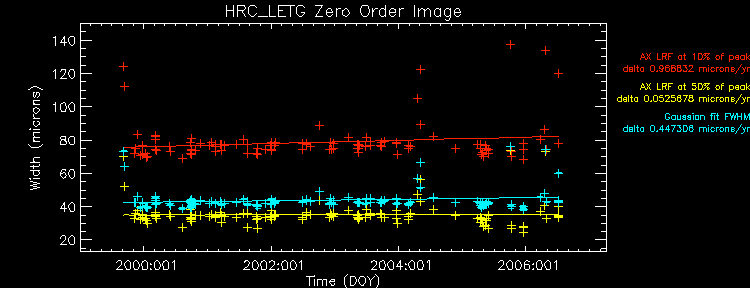
The steps we took to compute the dose map are;
- Level 1 Event files for a specified month are obtained from archive.
- Image data including I2, I3, S2, S3 CCDs are extracted from all event files.
- All the extracted image data were merged to create a month long exposure map for the month.
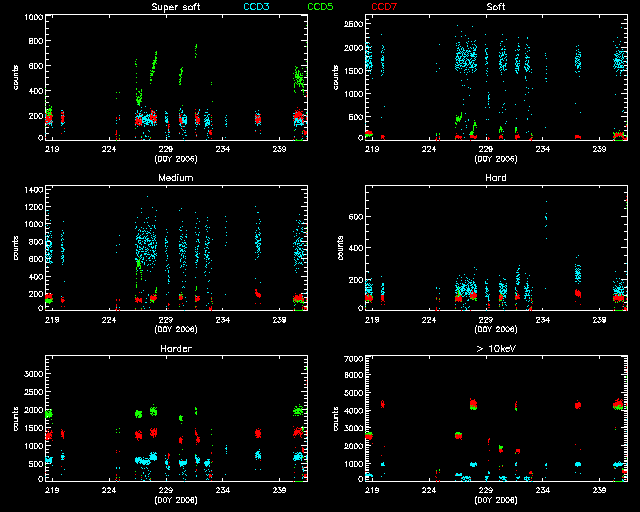
- The exposure map is opened with ds9, and check a distribution of count rates against energy.
From this, estimate the upper threshold value. Any events beyond this upper threshold are
assumed erroneous events such as bad pixels.
- Using this upper threshold, the data is filtered, and create a cleaned exposure map for the month.
- The exposure map from each month from the Aug 1999 is added up to create a cumulative exposure
map for each month.
- Using fimgstatistic, we compute count rate statistics for each CCDs.
- For observations with high data drop rates (e.g., Crab nebula, Cas A), we corrected the
observations by adding events.
Note: Counts and RMS's of Cumulative maps are lower than the previous months. This is because we excluded
extreme outliers.
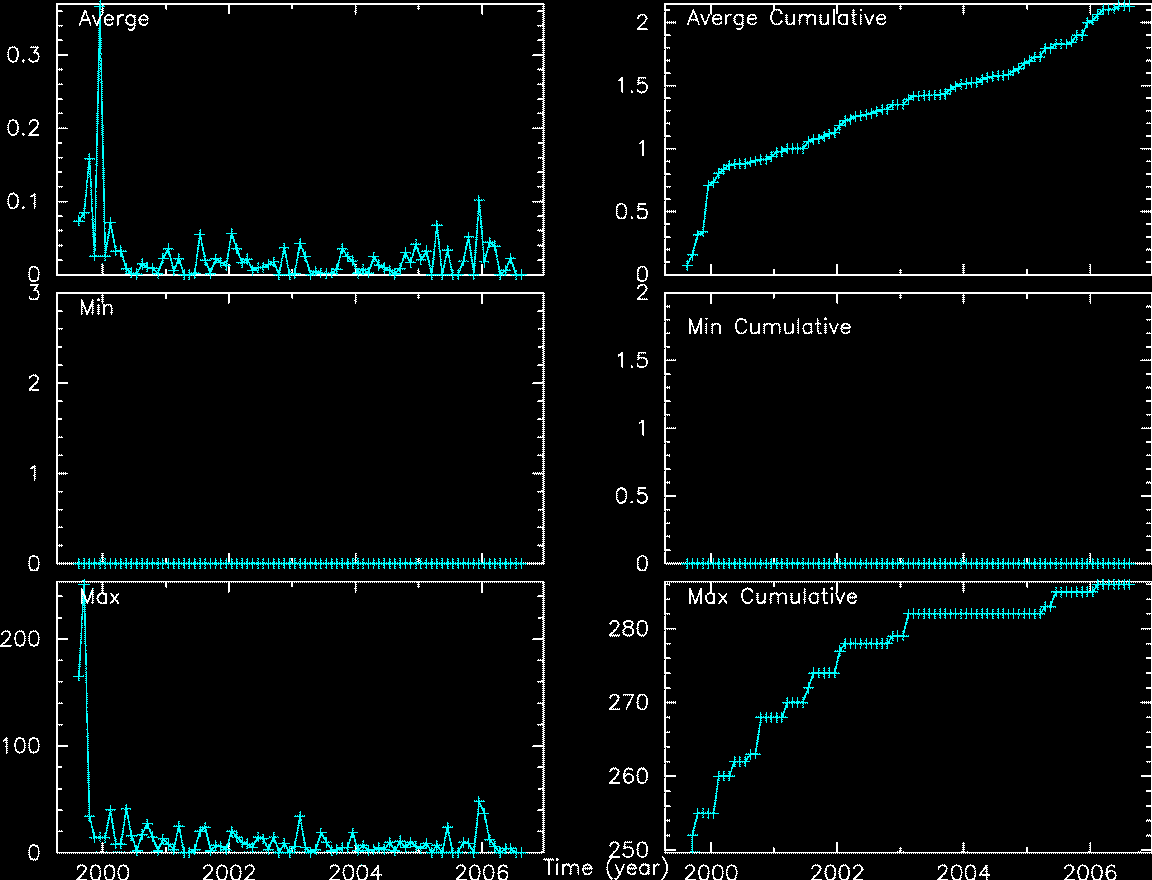
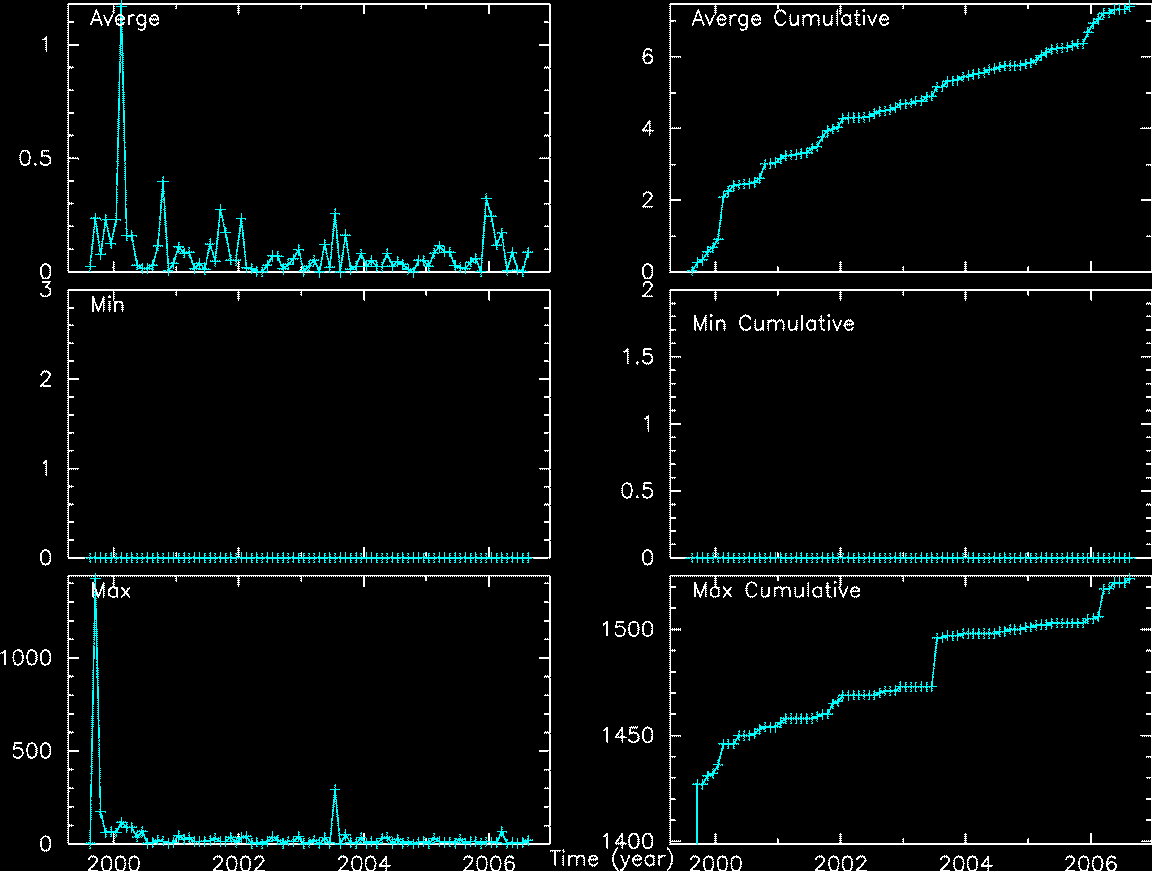
Please check more detail plots at Telemetered Photon Dose Trend page.
- AUG registered-photon-map in fits
Statistics:
# IMAGE     NPIX        MEAN           RMS              MIN     MAX
ACIS_aug06 6004901      13.9390        20.475           0.0    854.0

 I2 node 0  262654      11.013302       4.020786        0.0      67.0
 I2 node 1  262654      11.680284       4.485282        0.0     378.0
 I2 node 2  262654      11.588902       4.171487        0.0     110.0
 I2 node 3  262654      11.439790       4.433214        0.0      65.0

 I3 node 0  262654      11.806982       5.334141        0.0     124.0
 I3 node 1  262654      12.643921       11.053031       0.0     240.0
 I3 node 2  262654      11.066654       3.957487        0.0      57.0
 I3 node 3  262654      11.062794       4.050853        0.0     206.0

 I2 node 0  262654      17.589920       4.986556        0.0      95.0
 I2 node 1  262654      19.727077       7.014971        1.0     125.0
 I2 node 2  262654      22.712140       8.199074        2.0     124.0
 I2 node 3  262654      21.620385       7.374058        3.0     398.0

 I3 node 0  262654      26.363423       23.302626       2.0     240.0
 I3 node 1  262654      39.532633       32.813651       0.0     274.0
 I3 node 2  262654      30.273307       25.450552       3.0     263.0
 I3 node 3  262654      23.713850       9.884598        0.0      65.0
- Jul 1999 - Aug 2006 registered-photon-map in fits
Statistics:
 IMAGE        NPIX      MEAN          RMS              MIN    MAX
ACIS_total  6004901   924.243       1298.531           0.0   44493.0

 I2 node 0  262654      651.186234      113.658627      0.0     2585.0
 I2 node 1  262654      686.138680      155.223861      0.0     5658.0
 I2 node 2  262654      690.429661      122.951509      0.0     2314.0
 I2 node 3  262654      689.694747      156.136860      0.0     3236.0

 I3 node 0  262654      741.242455      180.605215      0.0     4713.0
 I3 node 1  262654      766.394104      513.279901      0.0     13825.0
 I3 node 2  262654      685.295782      112.659232      0.0     2690.0
 I3 node 3  262654      677.892250      122.664017      0.0     12536.0

 I2 node 0  262654      1058.830093     131.995403      493.0   12372.0
 I2 node 1  262654      1123.023273     227.045285      522.0   5489.0
 I2 node 2  262654      1280.250000     262.245732      710.0   8857.0
 I2 node 3  262654      1248.762964     213.736189      717.0   9721.0

 I3 node 0  262654      2084.259501     1213.713548     767.0   10368.0
 I3 node 1  262654      3257.877210     1742.457388     0.0     11381.0
 I3 node 2  262654      2264.457675     759.015992      639.0   4821.0
 I3 node 3  262654      1646.760578     292.550992      801.0   7025.0
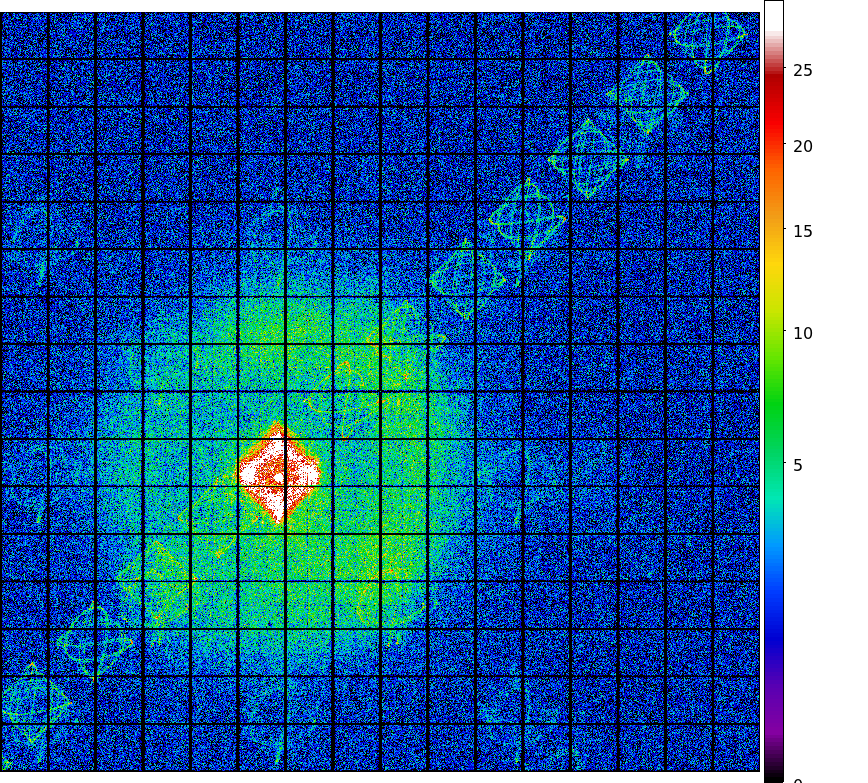
- AUG 2006 dose PNG image
- AUG I3 dose PNG image
- AUG S3 dose PNG image
- TOTAL JUL 1999 - AUG 2006 dose PNG image
- TOTAL I3 dose PNG image
- TOTAL S3 dose PNG image
