The steps we took to compute the dose map are;
- Level 1 Event files for a specified month are obtained from archive.
- Image data including I2, I3, S2, S3 CCDs are extracted from all event files.
- All the extracted image data were merged to create a month long exposure map for the month.
- The exposure map is opened with ds9, and check a distribution of count rates against energy.
From this, estimate the upper threshold value. Any events beyond this upper threshold are
assumed erroneous events such as bad pixels.
- Using this upper threshold, the data is filtered, and create a cleaned exposure map for the month.
- The exposure map from each month from the Aug 1999 is added up to create a cumulative exposure
map for each month.
- Using fimgstatistic, we compute count rate statistics for each CCDs.
- For observations with high data drop rates (e.g., Crab nebula, Cas A), we corrected the
observations by adding events.
Note: Counts and RMS's of Cumulative maps are lower than the previous months. This is because we excluded
extreme outliers.
Please check more detail plots at Telemetered Photon Dose Trend page.
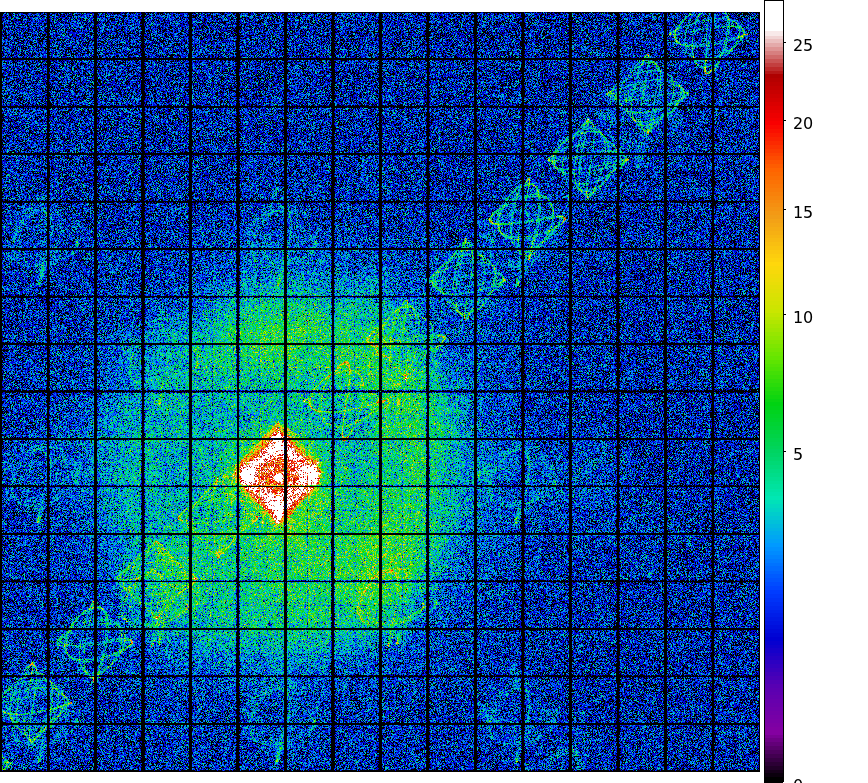
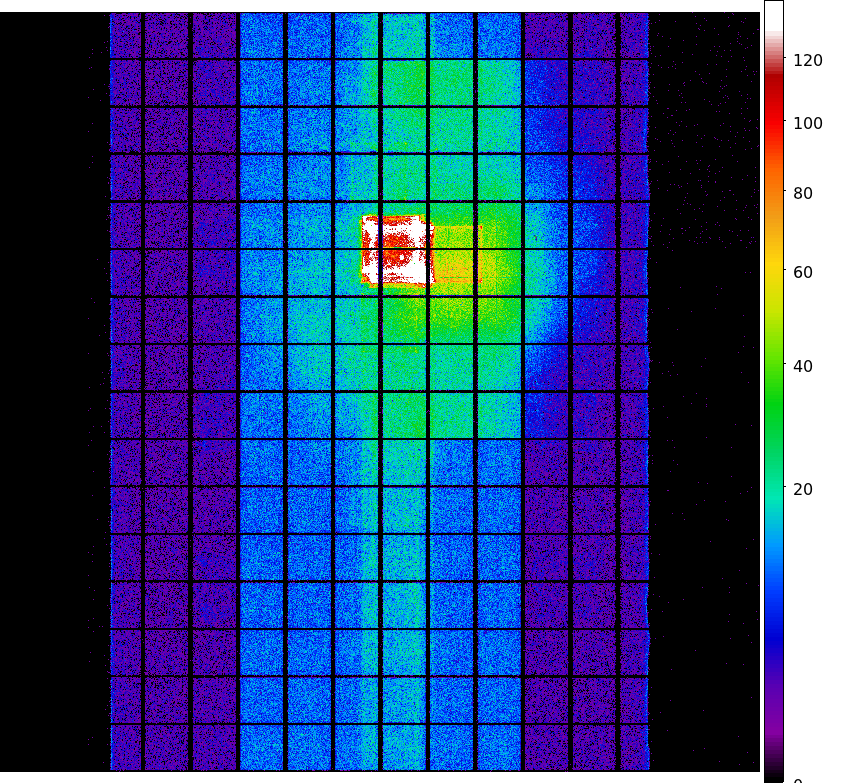
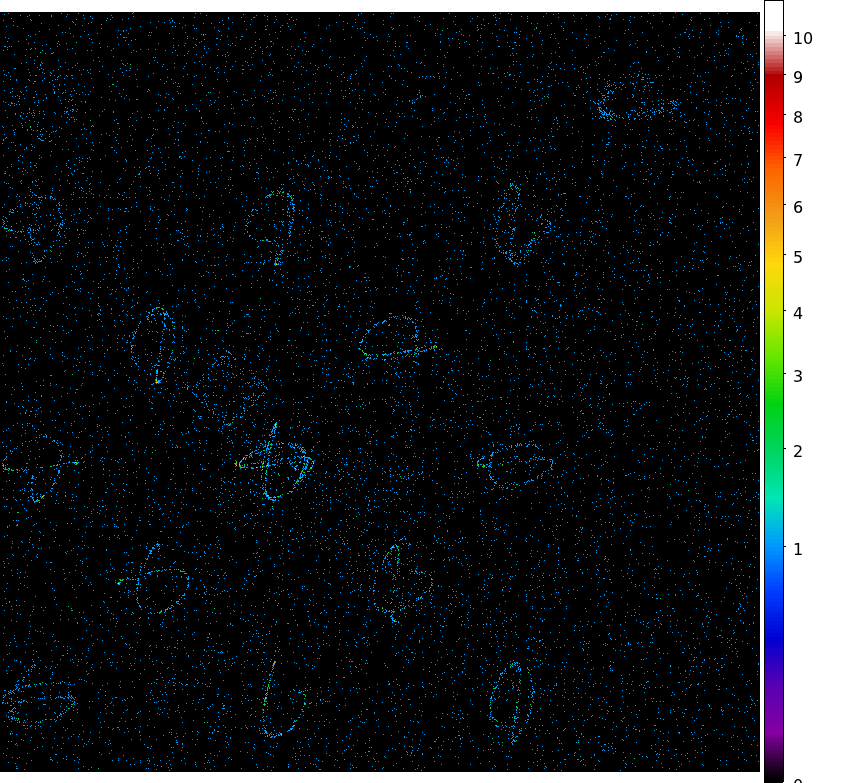
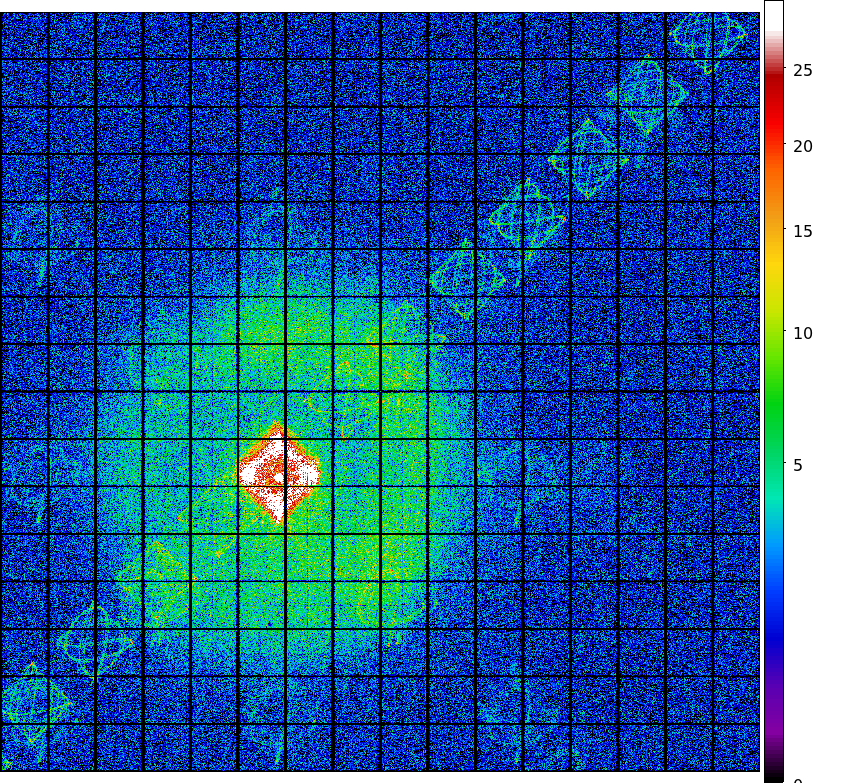
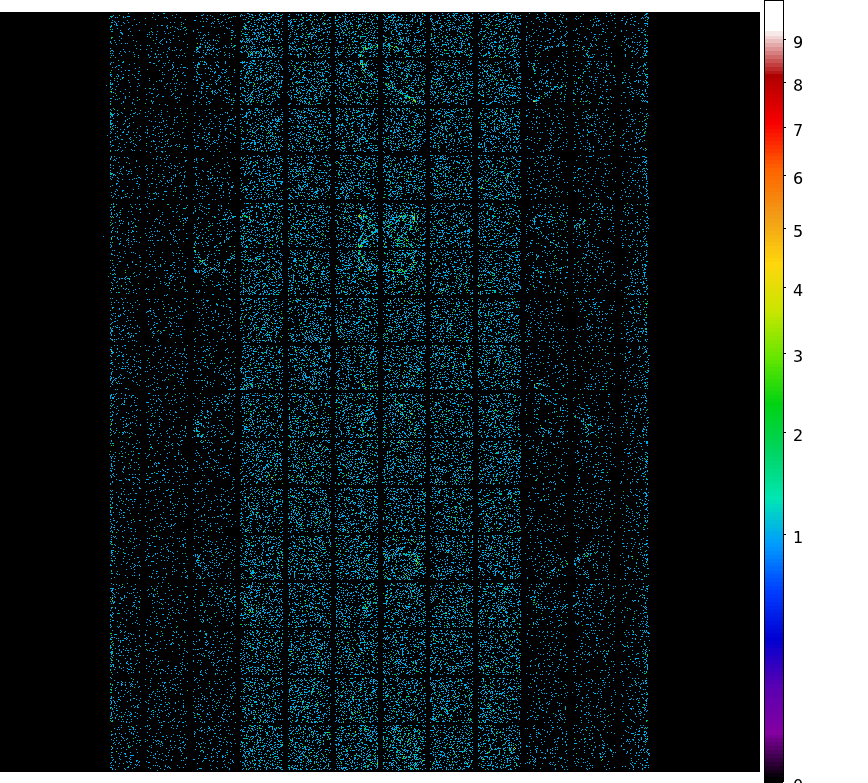
- SEP registered-photon-map in fits
Statistics:
# IMAGE     NPIX        MEAN           RMS              MIN     MAX
ACIS_sep06 6004901      10.11          14.52            0.0    748.0

 I2 node 0  262654      11.071449       3.952794        0.0      68.0
 I2 node 1  262654      11.704272       4.570230        0.0     664.0
 I2 node 2  262654      11.940804       4.285308        0.0      97.0
 I2 node 3  262654      12.696642       5.108628        0.0      66.0

 I3 node 0  262654      12.515714       5.785240        0.0     157.0
 I3 node 1  262654      12.108315       10.533375       0.0     286.0
 I3 node 2  262654      10.969165       3.867952        0.0      62.0
 I3 node 3  262654      10.925827       3.974567        0.0     193.0

 S2 node 0  262654      12.884995       4.242401        0.0     206.0
 S2 node 1  262654      13.293503       5.327363        0.0      87.0
 S2 node 2  262654      13.538163       4.579324        0.0      87.0
 S2 node 3  262654      13.054586       4.159353        0.0     295.0

 S3 node 0  262654      16.619600       4.573270        1.0      57.0
 S3 node 1  262654      18.044297       5.284352        0.0      77.0
 S3 node 2  262654      17.882812       4.694499        0.0     158.0
 S3 node 3  262654      16.564935       4.406212        1.0     150.0
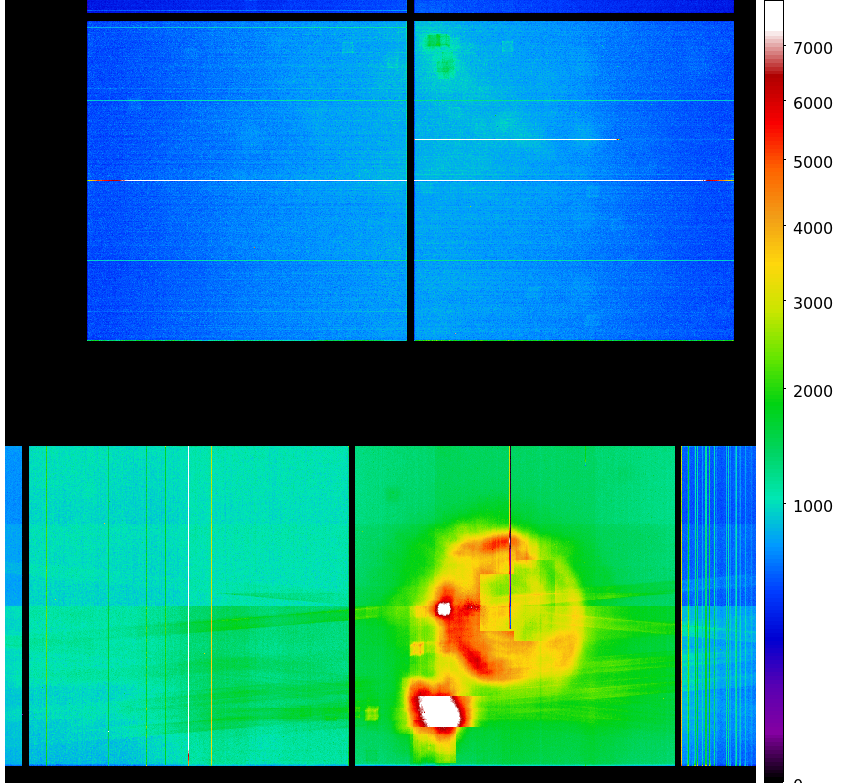
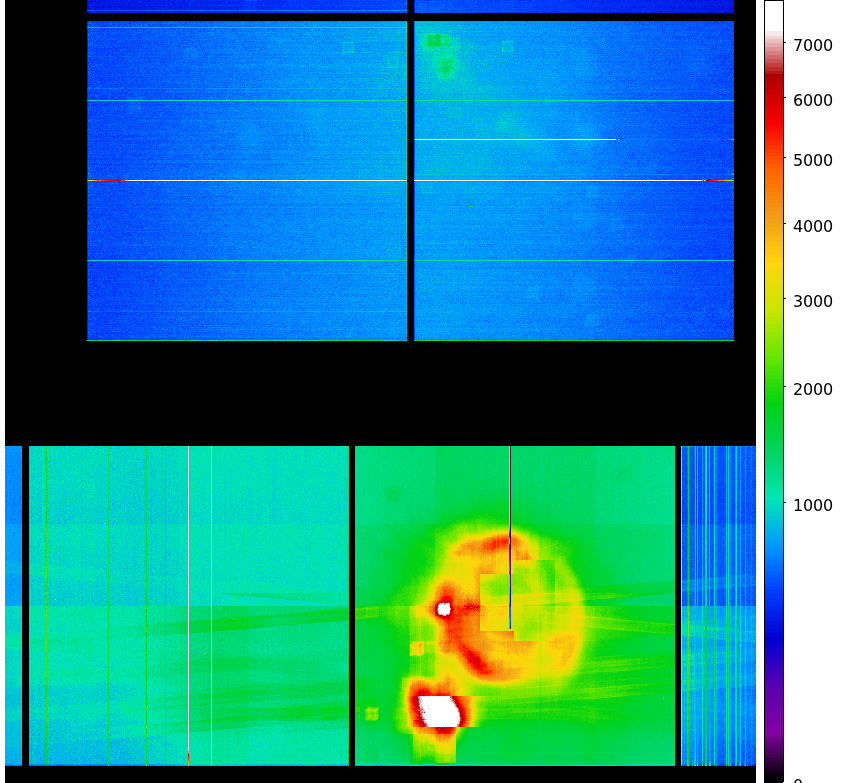
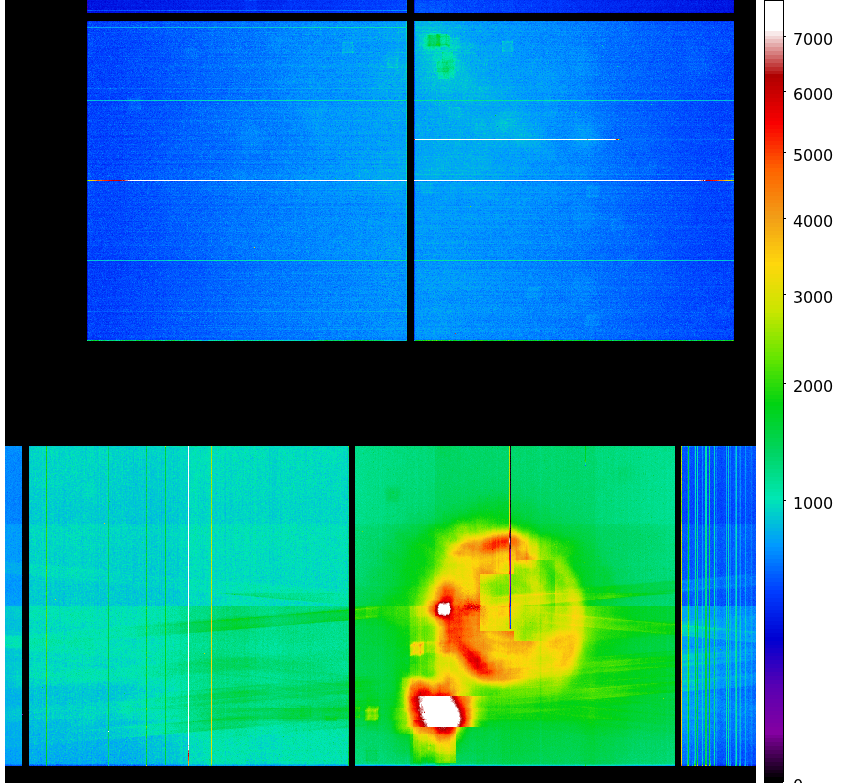
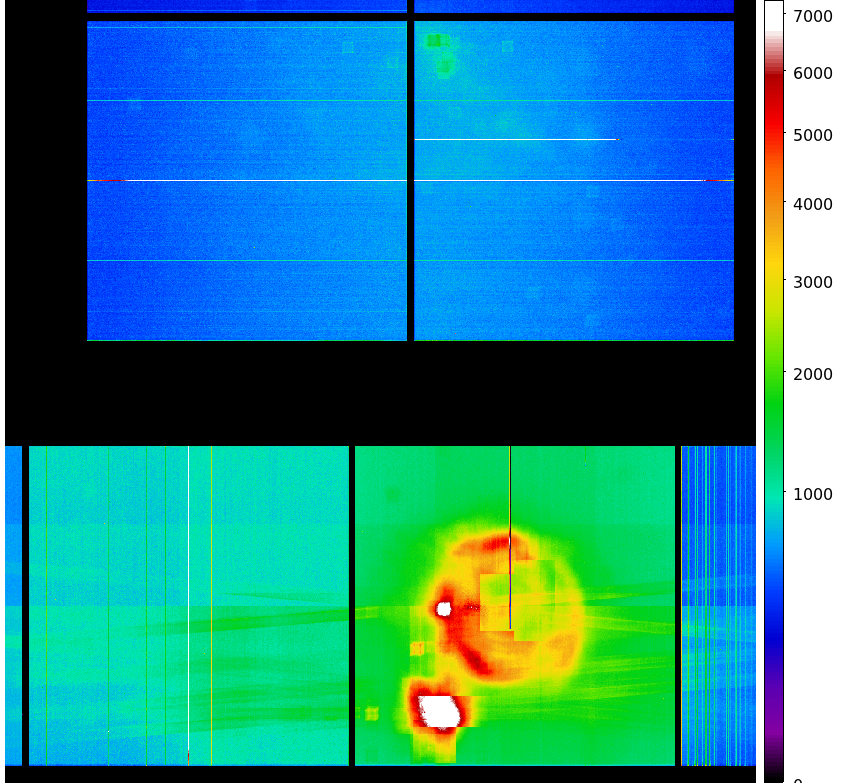
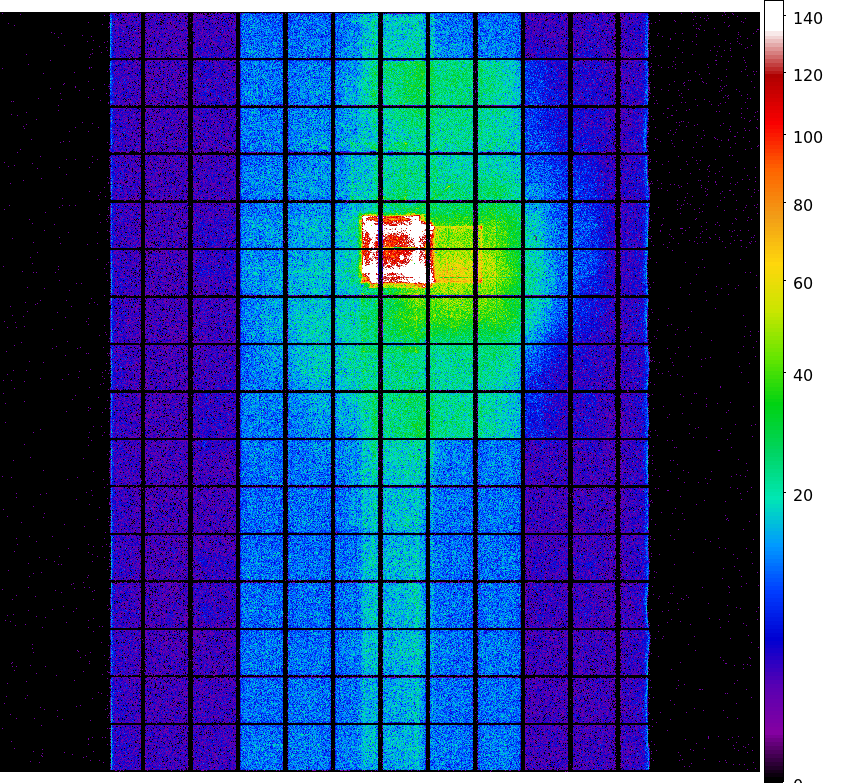
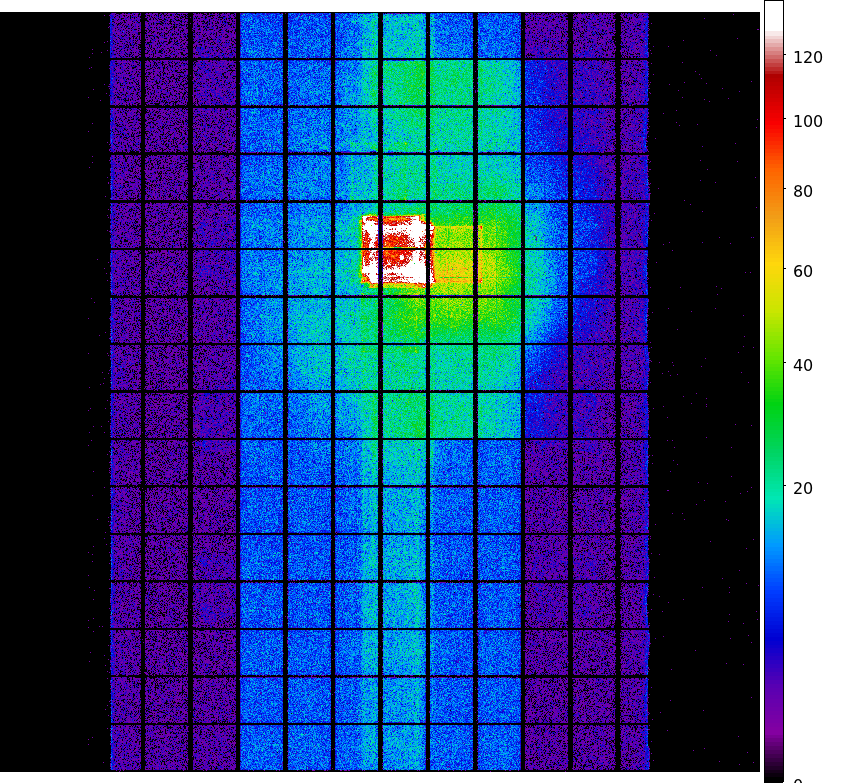
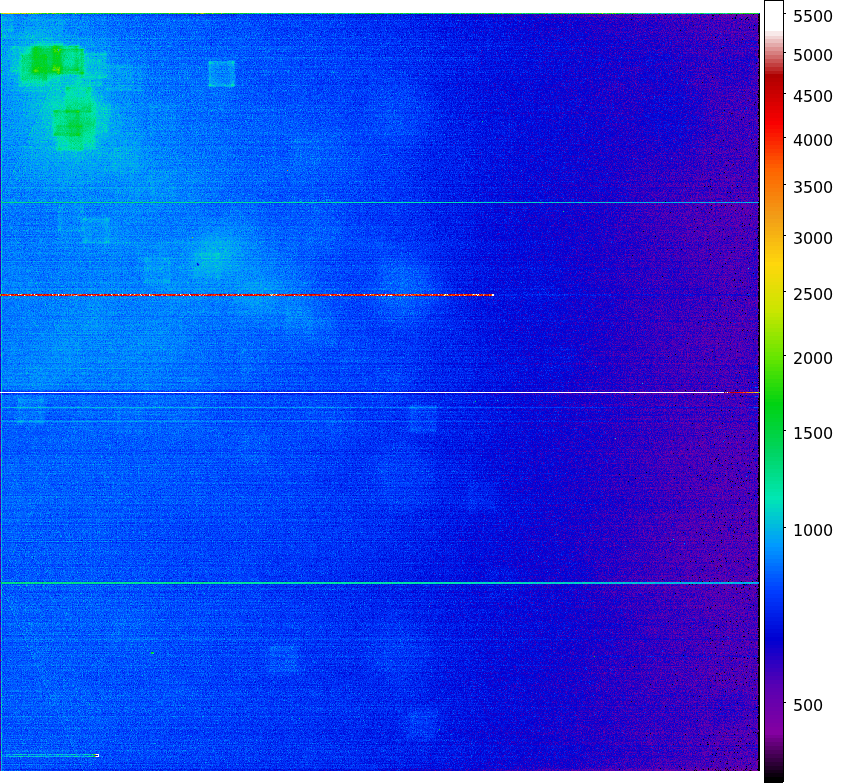
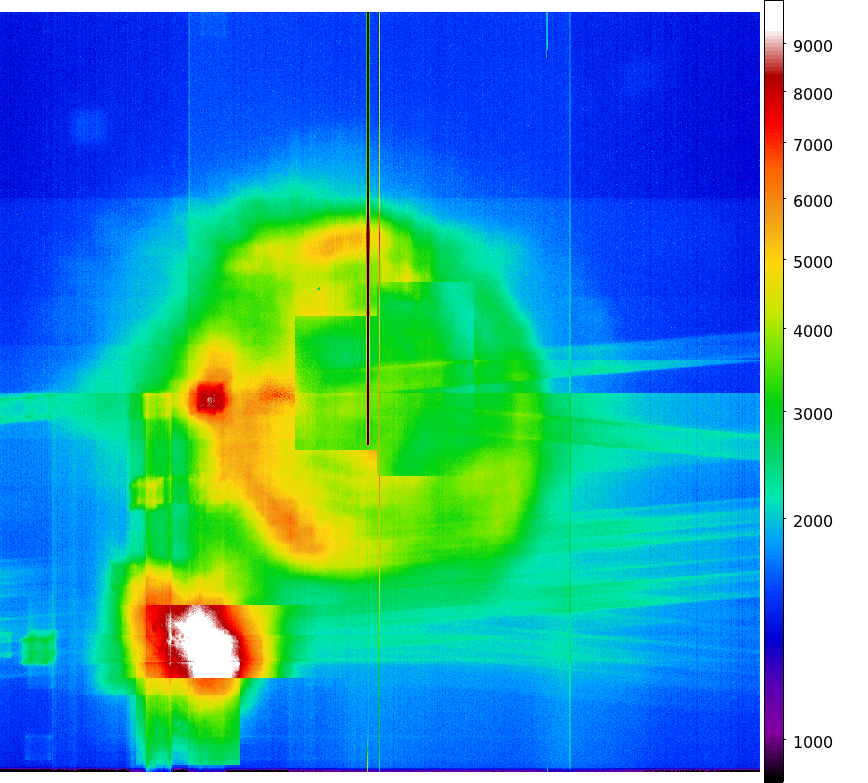
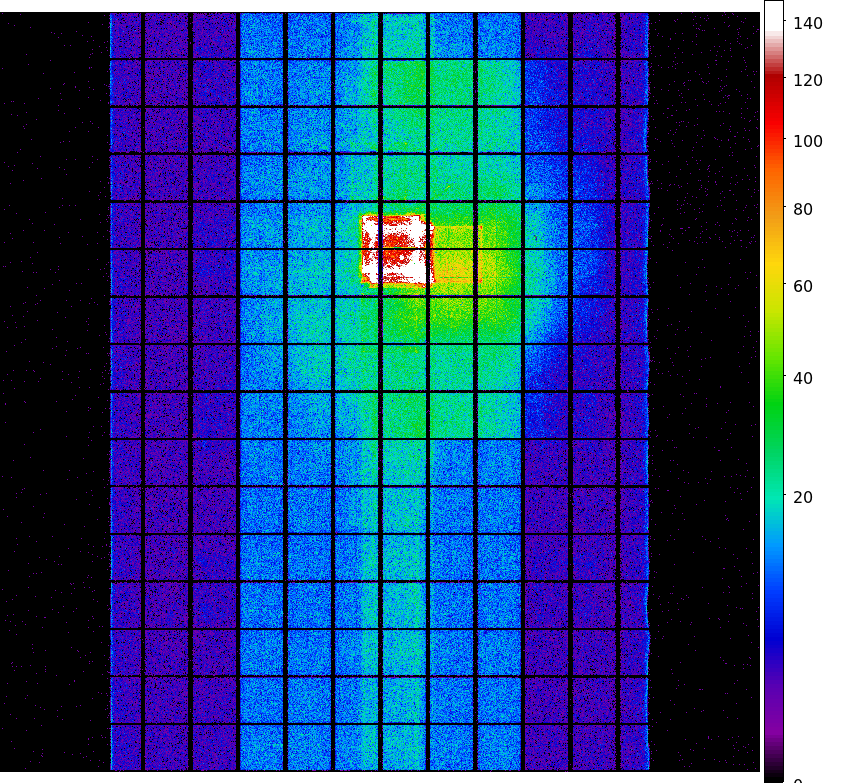
- Jul 1999 - Sep 2006 registered-photon-map in fits
Statistics:
 IMAGE        NPIX      MEAN          RMS              MIN    MAX
ACIS_total  6004901   934.36        1310.45            0.0   55150.0

 I2 node 0  262654      662.257683      115.616479      0.0     2653.0
 I2 node 1  262654      697.842952      157.895100      0.0     6322.0
 I2 node 2  262654      702.370464      125.275459      0.0     2336.0
 I2 node 3  262654      702.391388      159.401976      0.0     3284.0

 I3 node 0  262654      753.758169      184.199544      0.0     4755.0
 I3 node 1  262654      778.502419      523.078855      0.0     14111.0
 I3 node 2  262654      696.264947      114.473109      0.0     2752.0
 I3 node 3  262654      688.818077      124.728246      0.0     12729.0

 S2 node 0  262654      1071.715089     133.412397      498.0   12395.0
 S2 node 1  262654      1136.316776     229.083522      528.0   5576.0
 S2 node 2  262654      1293.788162     262.615938      715.0   8921.0
 S2 node 3  262654      1261.817549     213.152328      725.0   10016.0

 S3 node 0  262654      2100.879102     1213.903642     775.0   10384.0
 S3 node 1  262654      3275.925926     1742.685062     0.0     11393.0
 S3 node 2  262654      2282.340487     758.915897      646.0   4838.0
 S3 node 3  262654      1663.327050     292.231950      811.0   7056.0
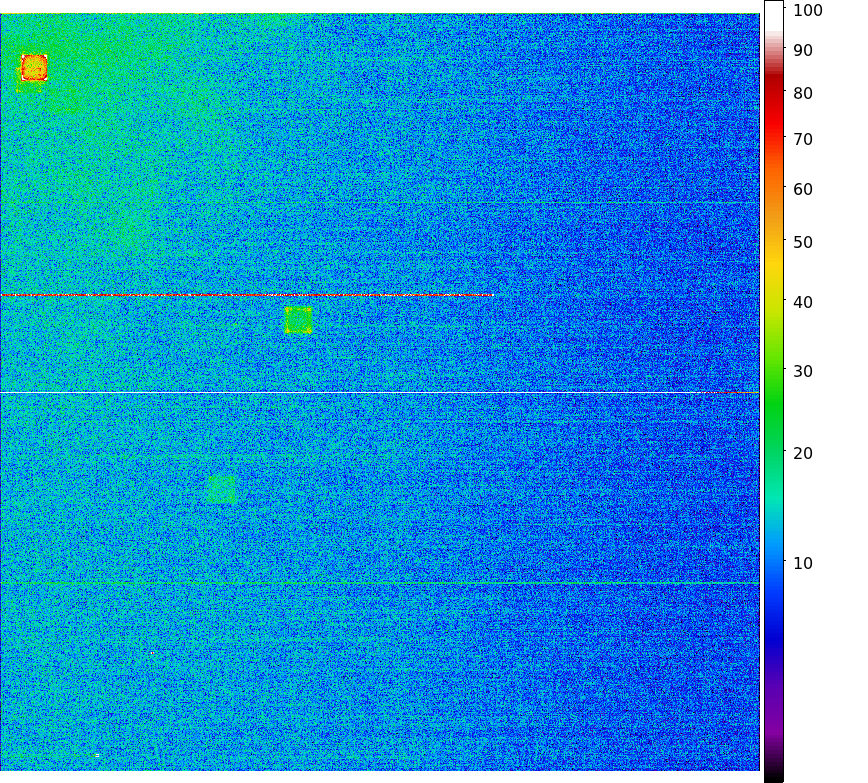
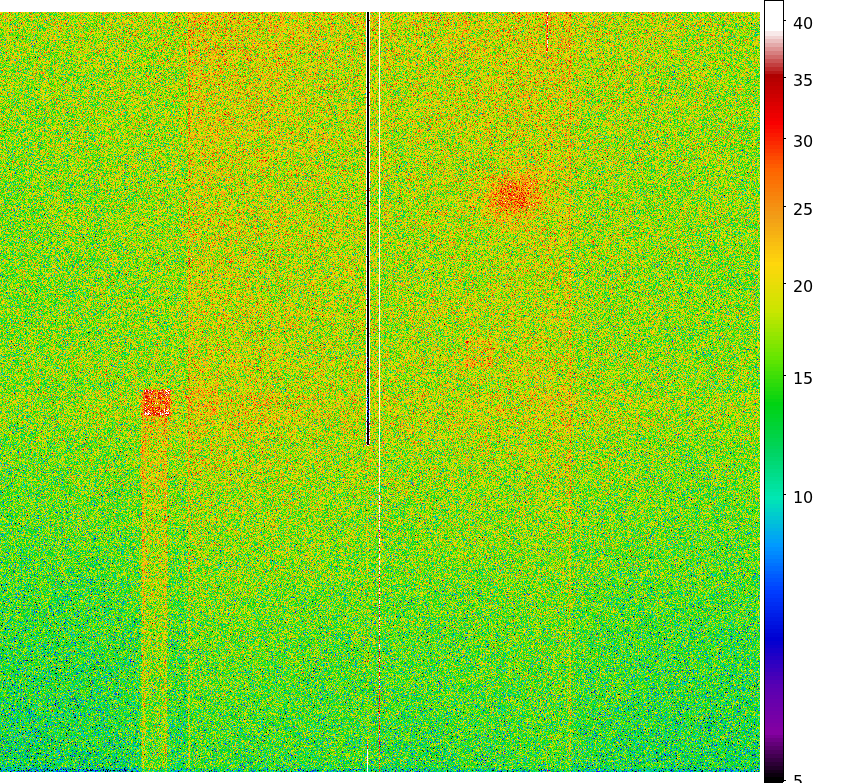
- SEP 2006 dose PNG image
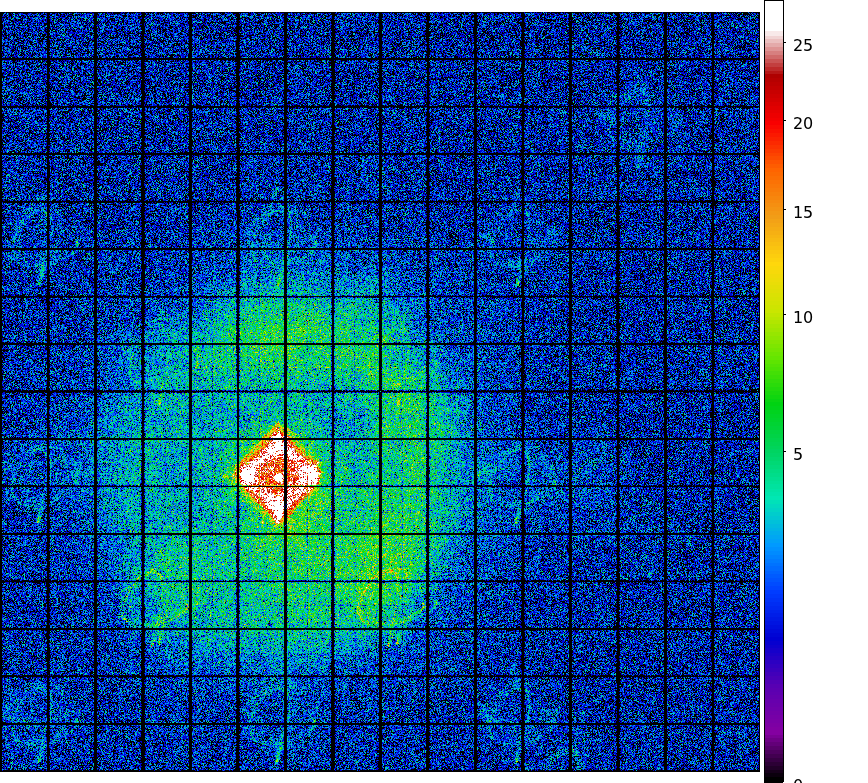
- SEP I3 dose PNG image
- SEP S3 dose PNG image
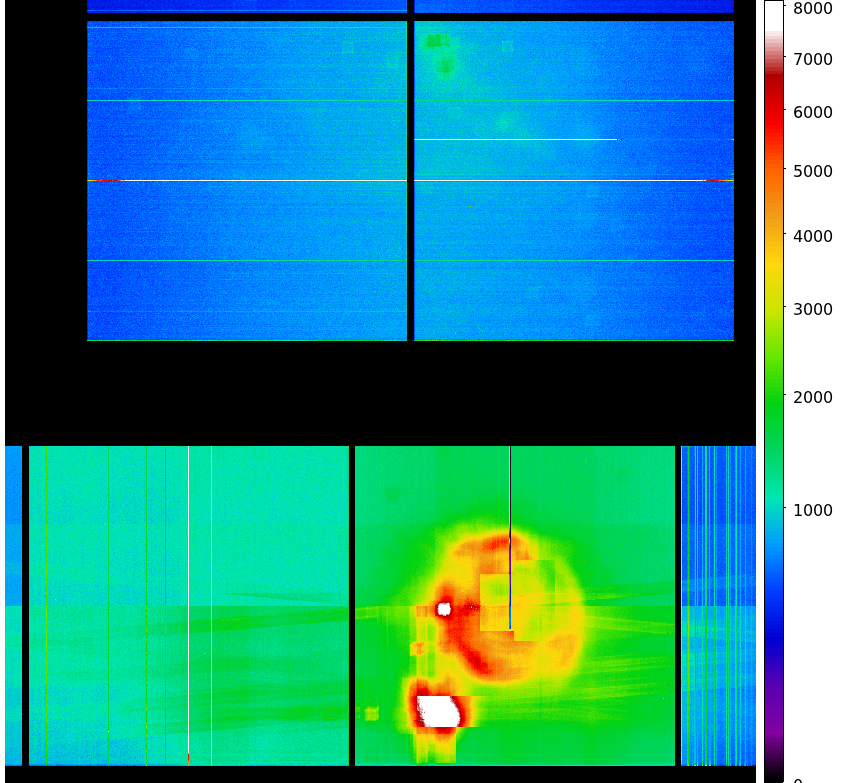
- TOTAL JUL 1999 - SEP 2006 dose PNG image
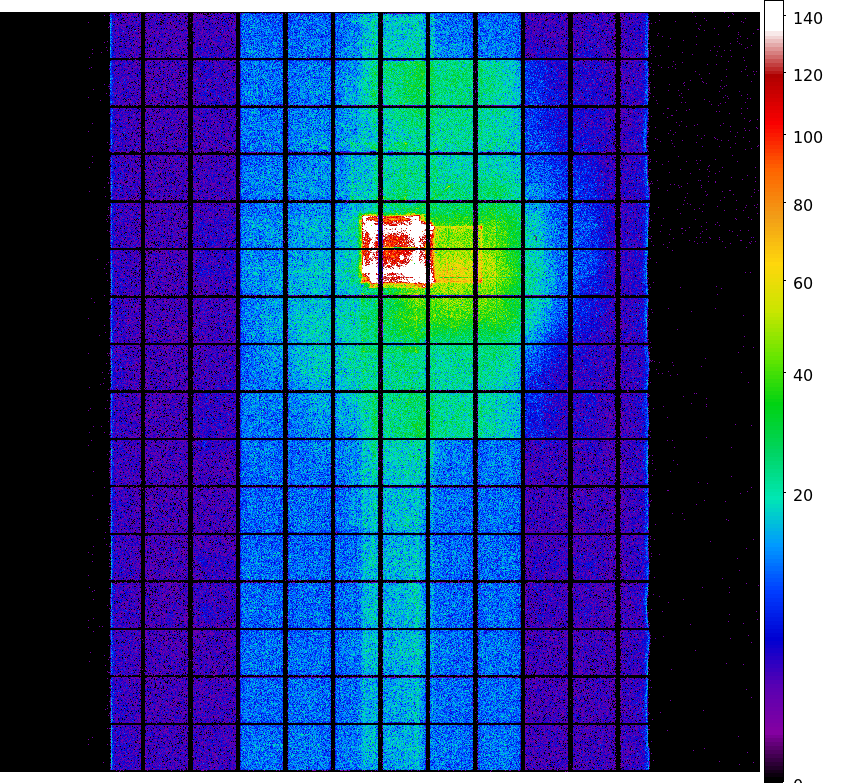
- TOTAL I3 dose PNG image
- TOTAL S3 dose PNG image


)
)
)
)
)
)
)
)
)
)
)
)
)
)
)
)
)
)
)
)
)
)
)