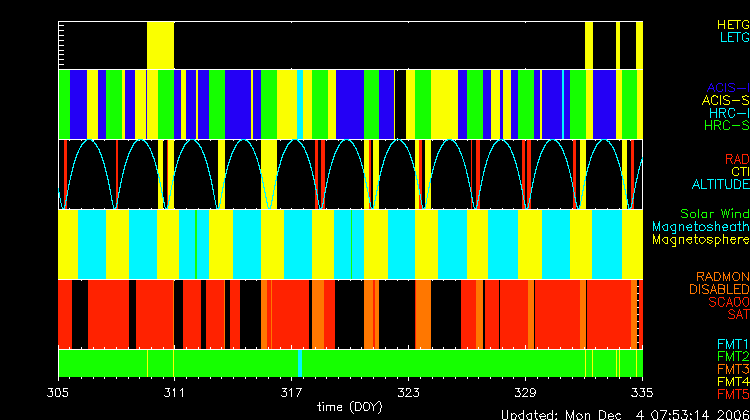

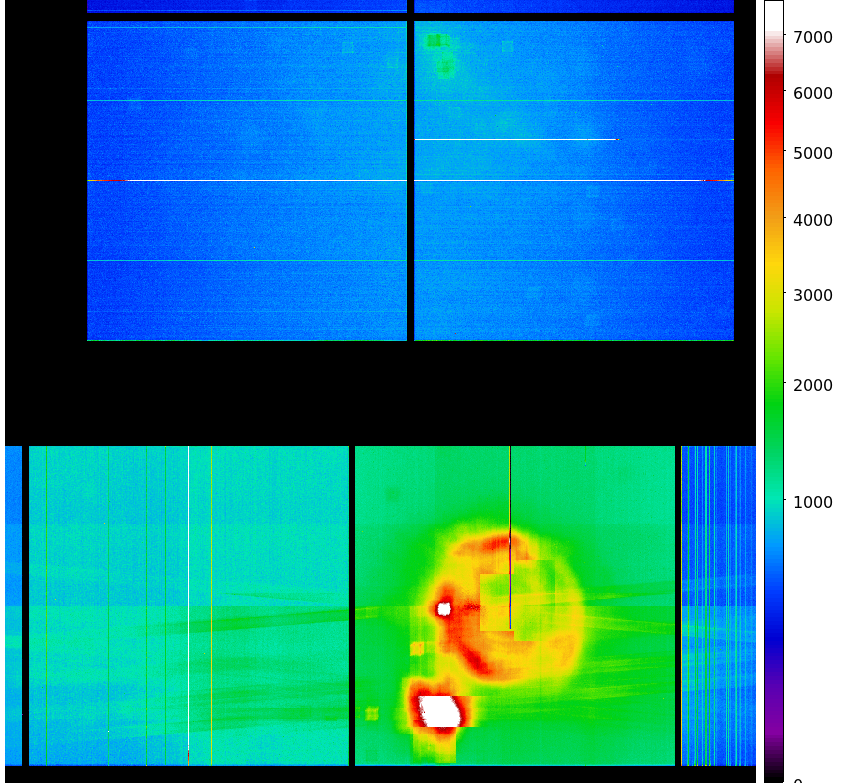
The steps we took to compute the dose map are;
Please check more detail plots at Telemetered Photon Dose Trend page.
Statistics:
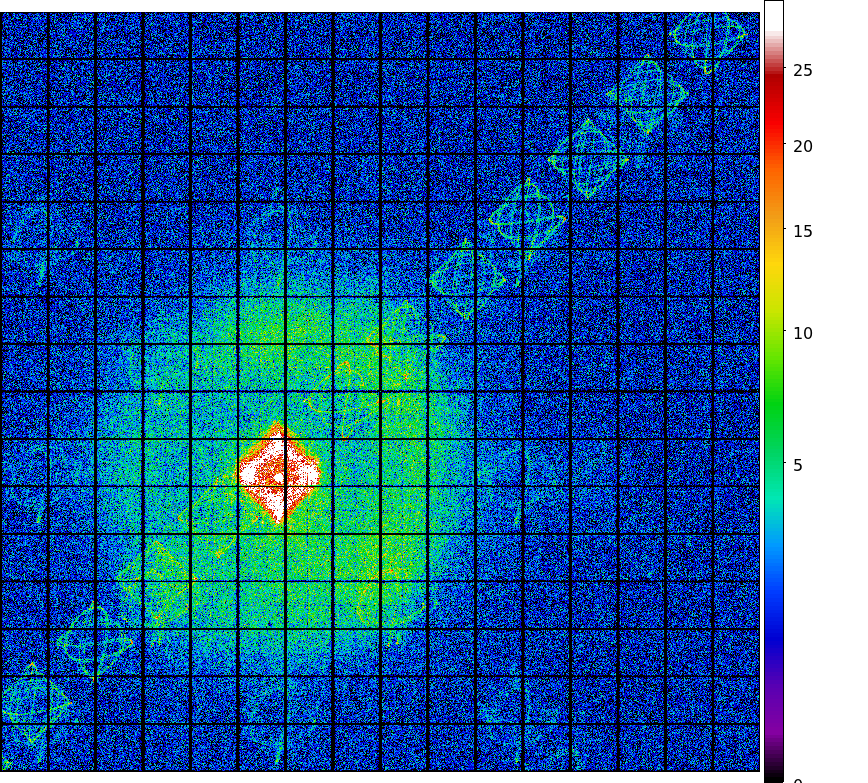
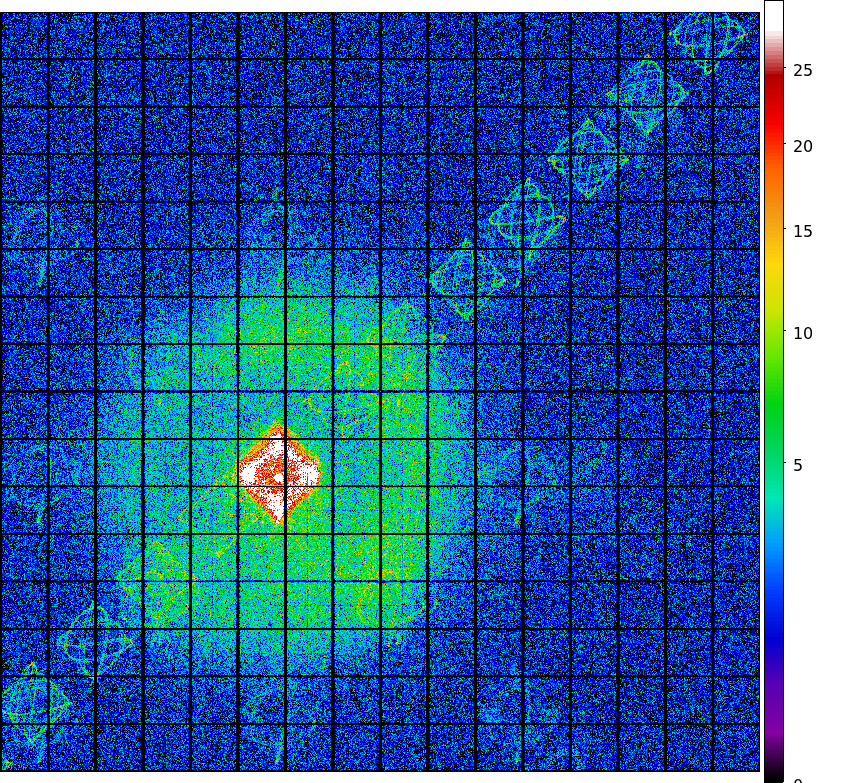
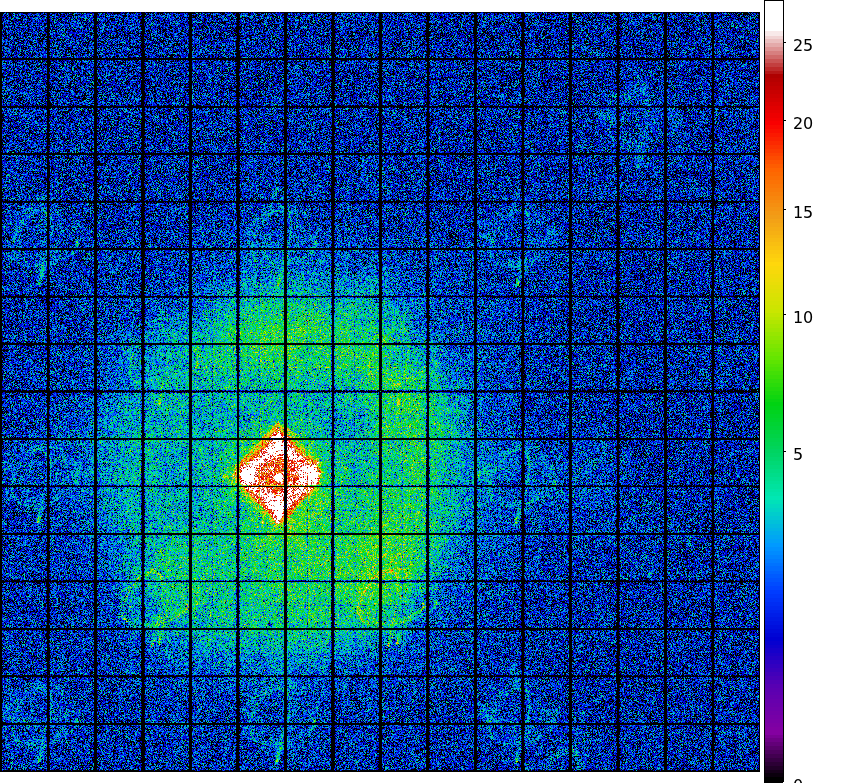
# IMAGE     NPIX        MEAN           RMS              MIN     MAX
ACIS_nov06 6004901      12.88          19.53            0.0    1027.0

 I2 node 0  262654      11.715286       4.218326        0.0      74.0
 I2 node 1  262654      12.479283       4.828071        0.0     672.0
 I2 node 2  262654      12.461445       4.345287        0.0     110.0
 I2 node 3  262654      12.211612       4.651429        0.0      69.0

 I3 node 0  262654      12.716181       4.776978        0.0      75.0
 I3 node 1  262654      13.297863       12.105875       0.0     333.0
 I3 node 2  262654      12.234460       4.256694        0.0      64.0
 I3 node 3  262654      12.211235       4.381116        0.0     251.0

 I2 node 0  262654      17.206637       5.164035        0.0     1027.0
 I2 node 1  262654      19.633380       6.315152        2.0     113.0
 I2 node 2  262654      19.595113       5.584015        2.0     122.0
 I2 node 3  262654      17.591930       4.837559        1.0     456.0

 I3 node 0  262654      30.464040       40.493970       3.0     347.0
 I3 node 1  262654      22.030684       6.175419        0.0     106.0
 I3 node 2  262654      24.656667       6.697431        4.0     407.0
 I3 node 3  262654      22.425132       5.880399        3.0     220.0
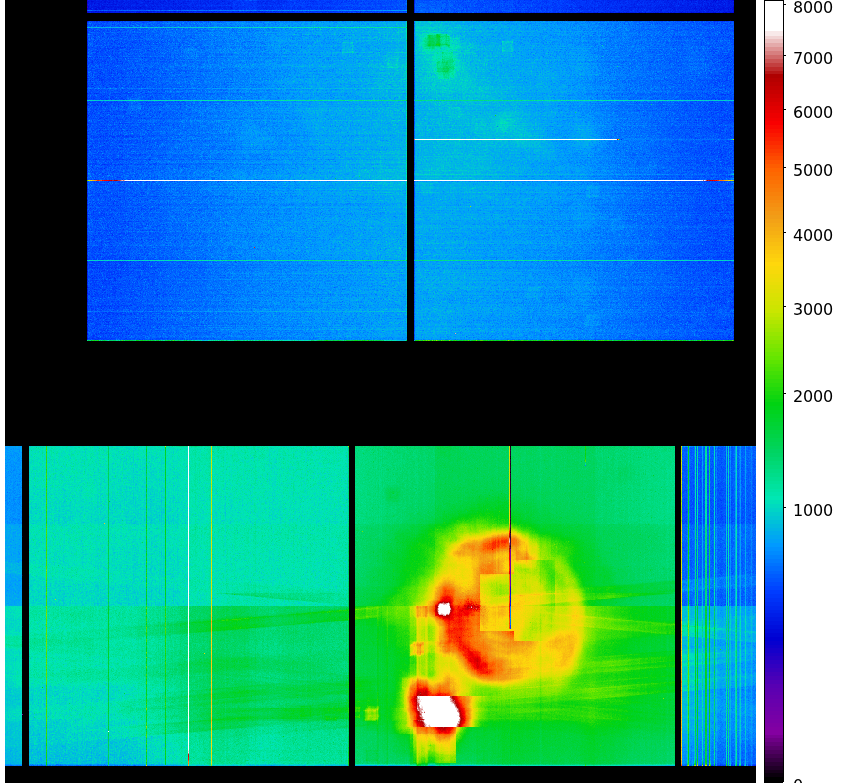
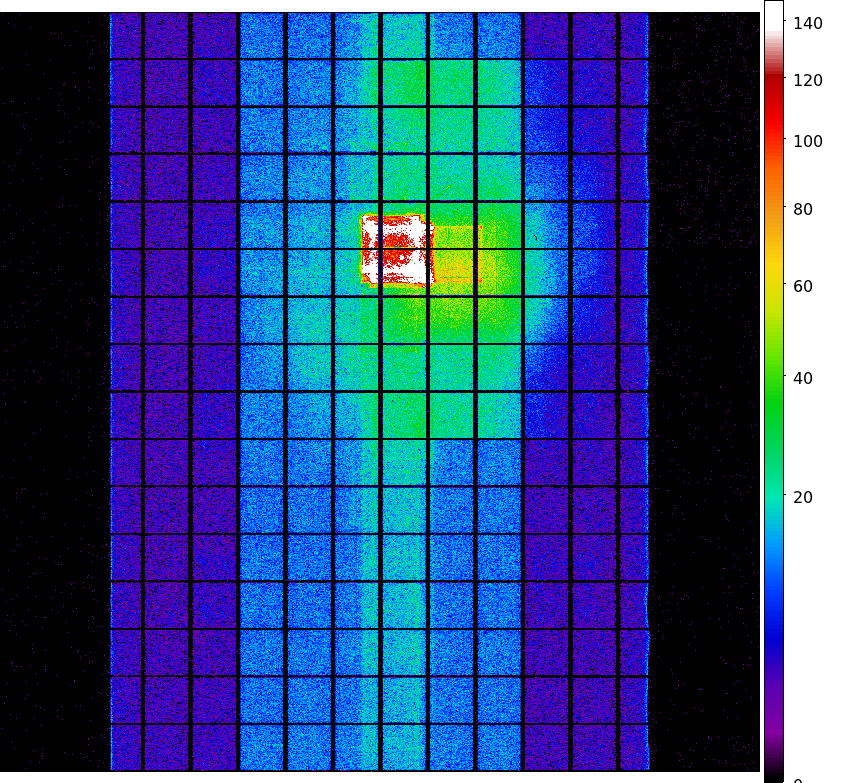
Statistics:
 IMAGE        NPIX      MEAN          RMS              MIN    MAX
ACIS_total  6004901   959.36        1336.71            0.0   56412.0

 I2 node 0  262654      685.673821      120.136301      0.0     2785.0
 I2 node 1  262654      723.851764      164.703036      0.0     7360.0
 I2 node 2  262654      736.658470      138.832647      0.0     2552.0
 I2 node 3  262654      741.791849      176.833437      0.0     3446.0

 I3 node 0  262654      788.662846      201.276769      0.0     4853.0
 I3 node 1  262654      808.510155      545.295764      0.0     14705.0
 I3 node 2  262654      721.239347      119.535367      0.0     2870.0
 I3 node 3  262654      712.555012      129.323417      0.0     13212.0

 I2 node 0  262654      1100.081319     136.572791      517.0   12452.0
 I2 node 1  262654      1168.732372     236.221396      550.0   5725.0
 I2 node 2  262654      1326.157108     267.634220      737.0   9084.0
 I2 node 3  262654      1290.868725     215.178616      737.0   10690.0

 I3 node 0  262654      2152.898878     1212.915053     812.0   10418.0
 I3 node 1  262654      3316.514056     1741.246517     0.0     11428.0
 I3 node 2  262654      2323.162175     762.922984      661.0   4883.0
 I3 node 3  262654      1699.588850     298.323196      841.0   7149.0
|
|
|
|
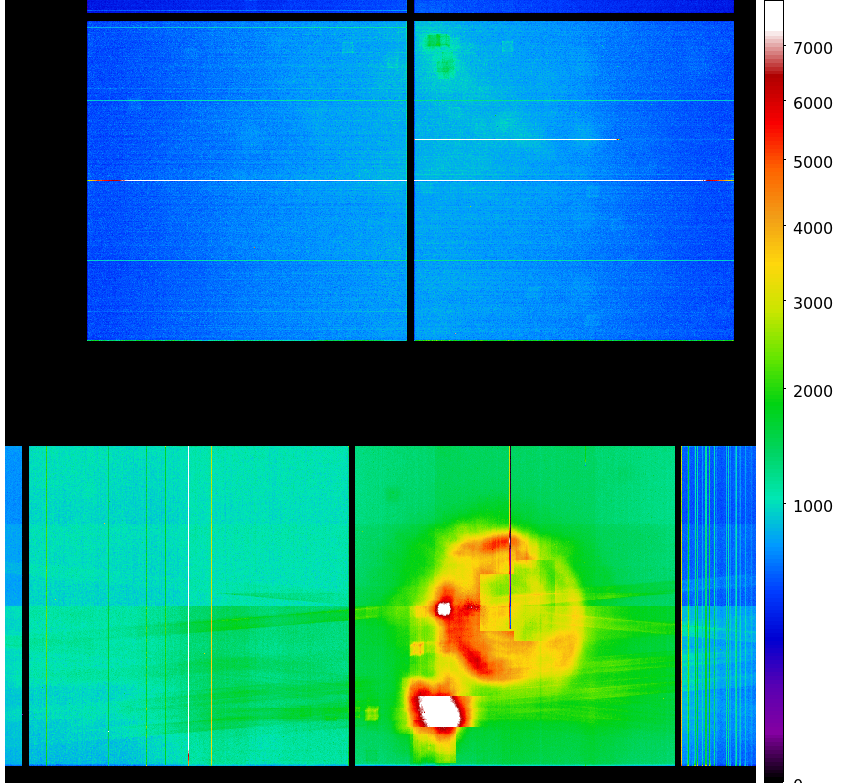
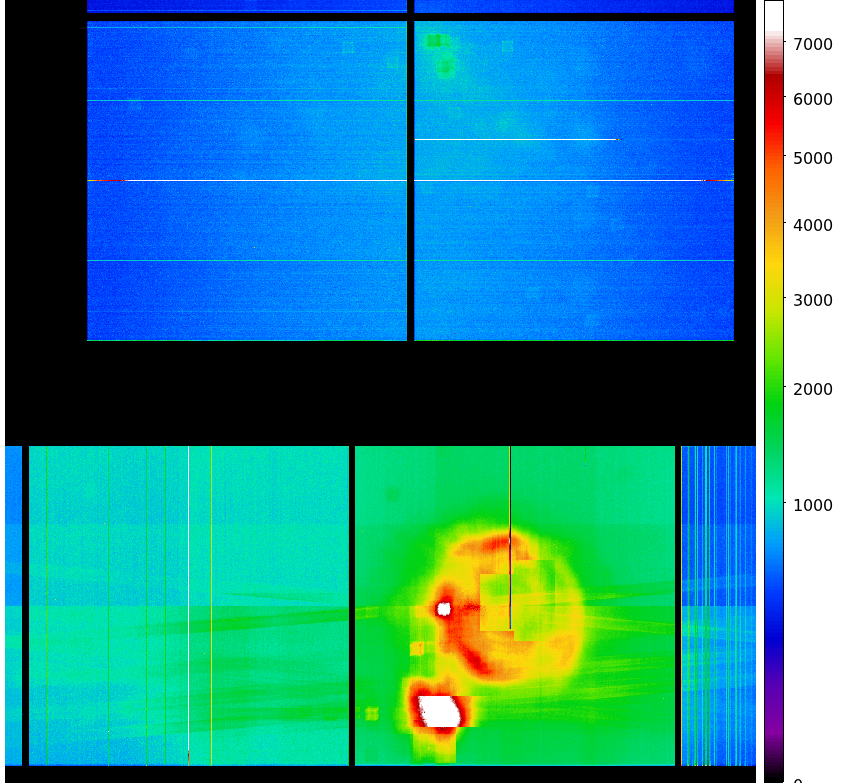
| Aug 2006 | May 2006 | Jul 2006 | Nov 2005 |
|---|
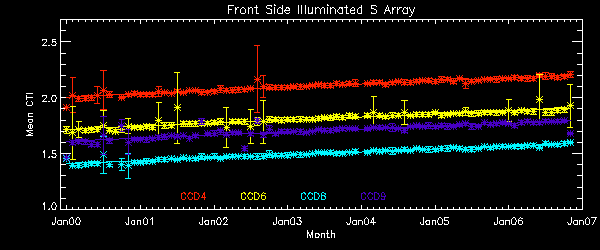
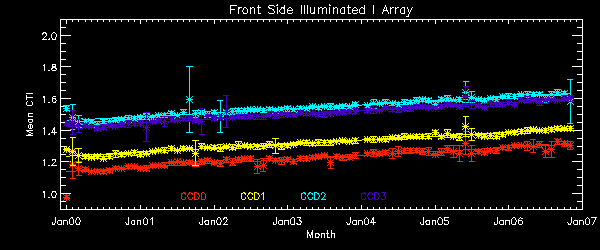
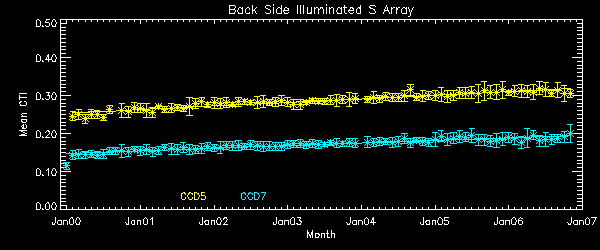
We report CTIs with a refined data definition. CTIs were computed for the temperature
dependency corrected data.
Please see
CTI page
for detailed explanation.
CTI's are computed for Mn K alpha, and defined as slope/intercept x10^4 of row # vs ADU.
Data file here
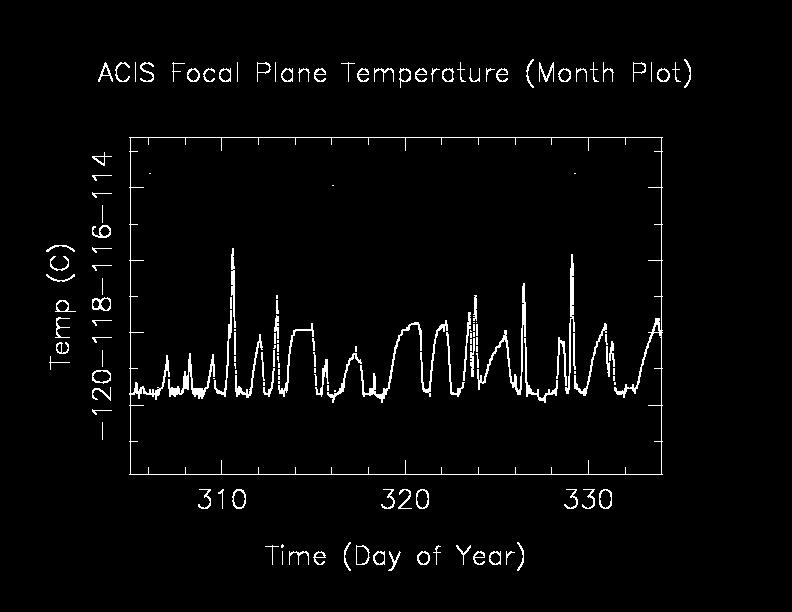
       The Mean (max) FPT: -117.87      std dev: 0.95
               mean width:    0.71 days std dev: 0.59

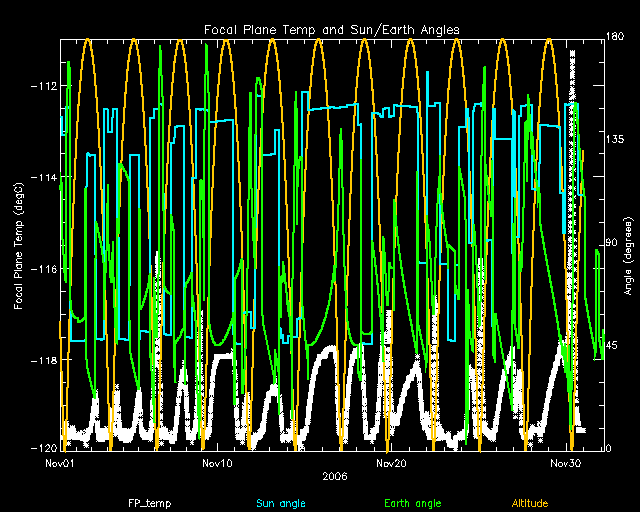
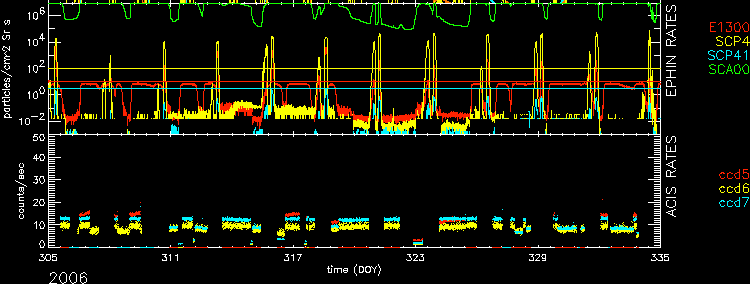
The following is a plot of focal plane temperature and sun angle, earth angle, and altitude.
| Name | Low (keV) | High(KeV) | Description |
|---|---|---|---|
| SSoft | 0.00 | 0.50 | Super soft photons |
| Soft | 0.50 | 1.00 | Soft photons |
| Med | 1.00 | 3.00 | Moderate energy photons |
| Hard | 3.00 | 5.00 | Hard Photons |
| Harder | 5.00 | 10.00 | Very Hard photons |
| Hardest | 10.00 | Beyond 10 keV |
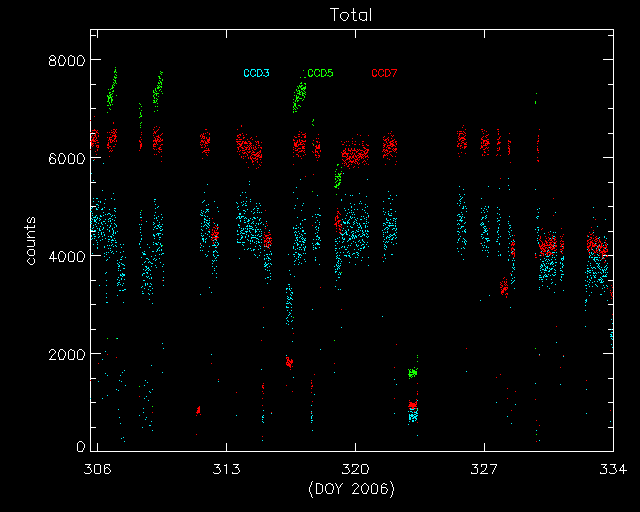
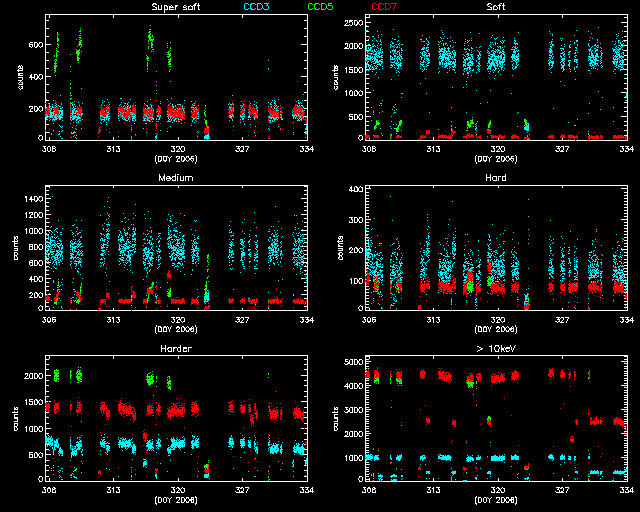
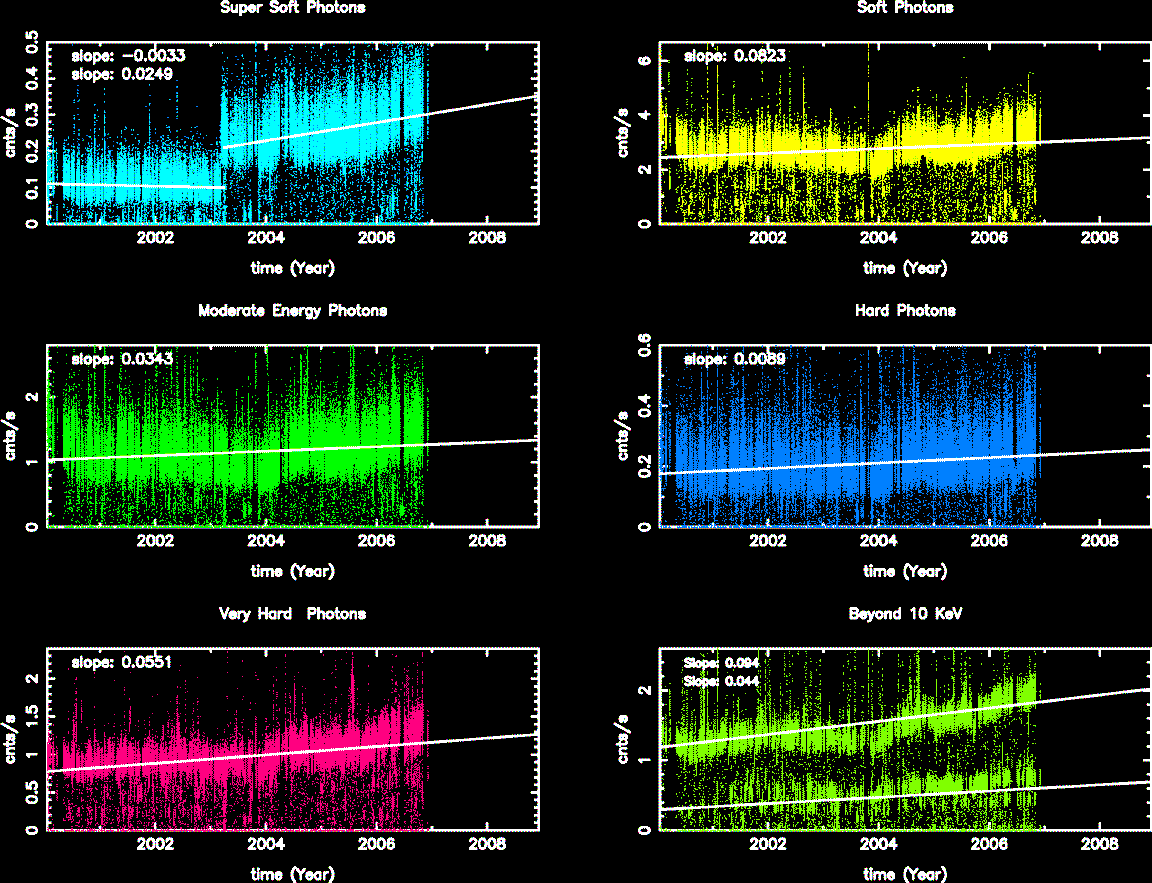
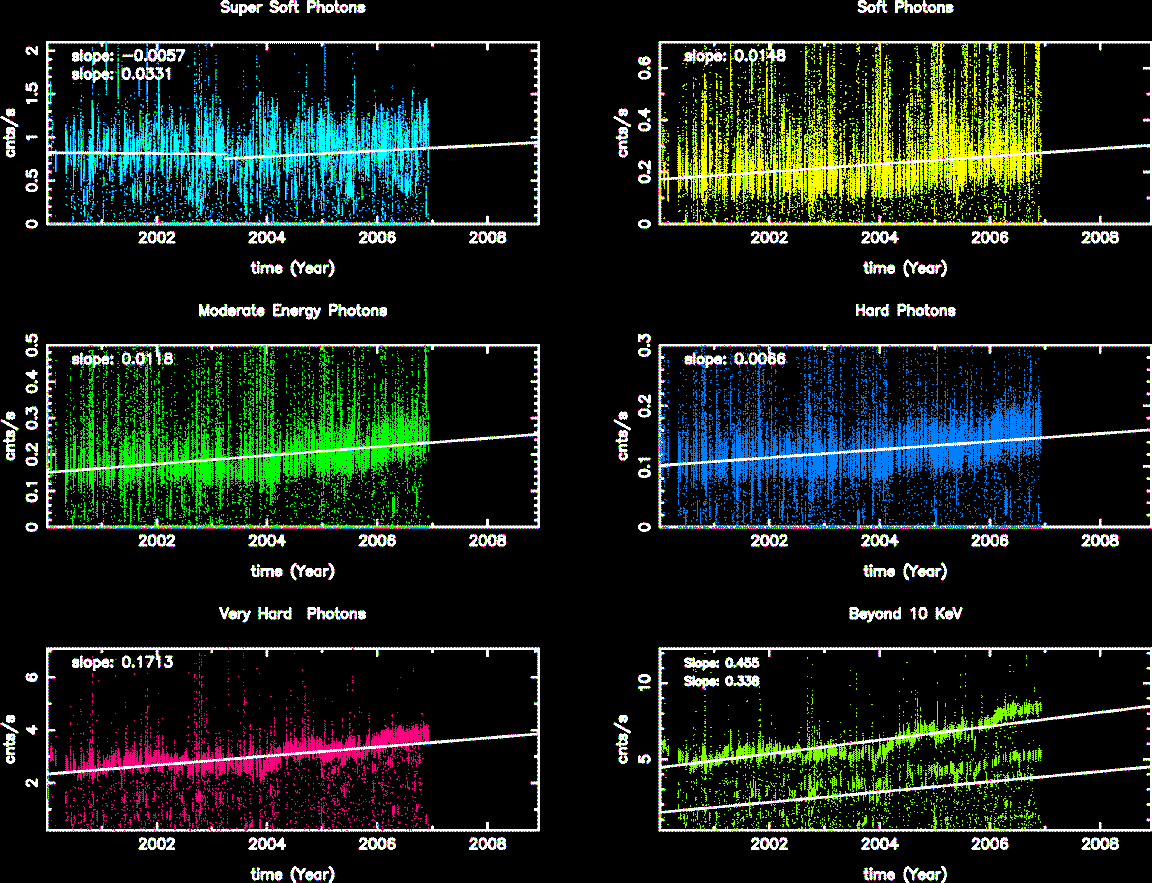
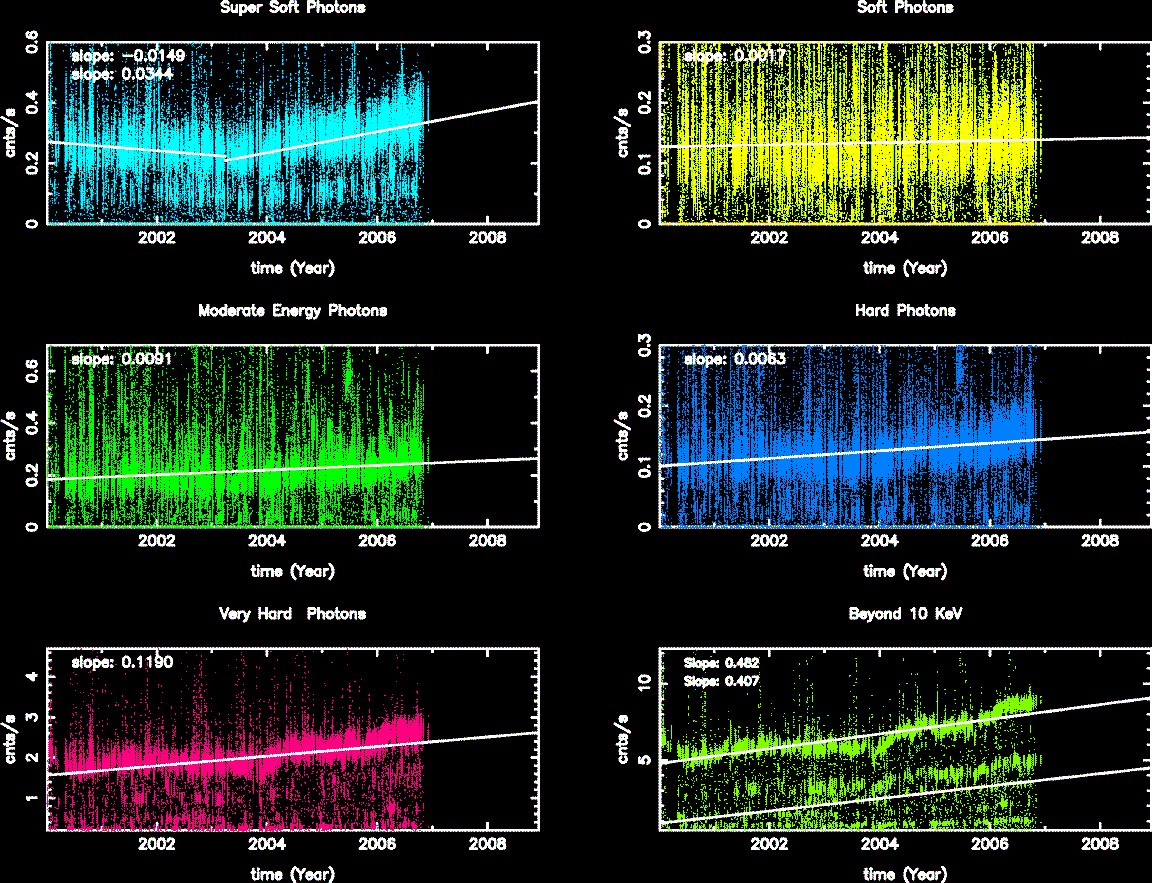
The following three plots show trends of SIB from year 2000. CCDs shown here are CCD3, CCD5, and CCD7. Fitted lines are linear fit after eliminating extreme outliers. For >10 keV plots, 2 lines are fit. One is with a 13 keV filter, and another without.
We collected data from acis histogram mode data, and created trend plots of peak portions and peak widths against time (DOM). The peaks were estimated by fitting a simple Gaussian on three peaks (Al, Ti, and Mn), and the widths were estimated by a width at the half max from the peak.
All histogram data are taken under TIMED and GRADED_HIST mode, SIM position is at an external calibration source position, the focal temperature is around -119.7 C, and parameter settings in aciselec, acistemp are set to about same for all.
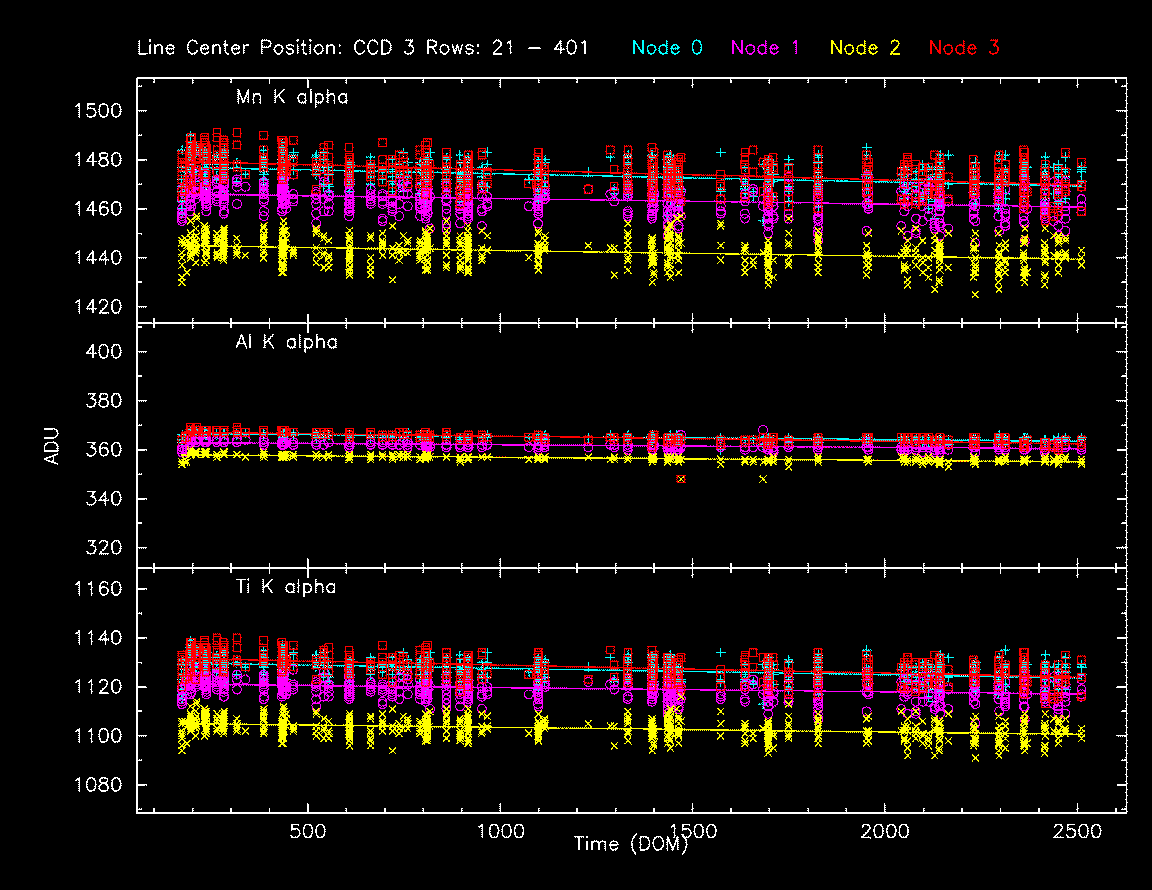
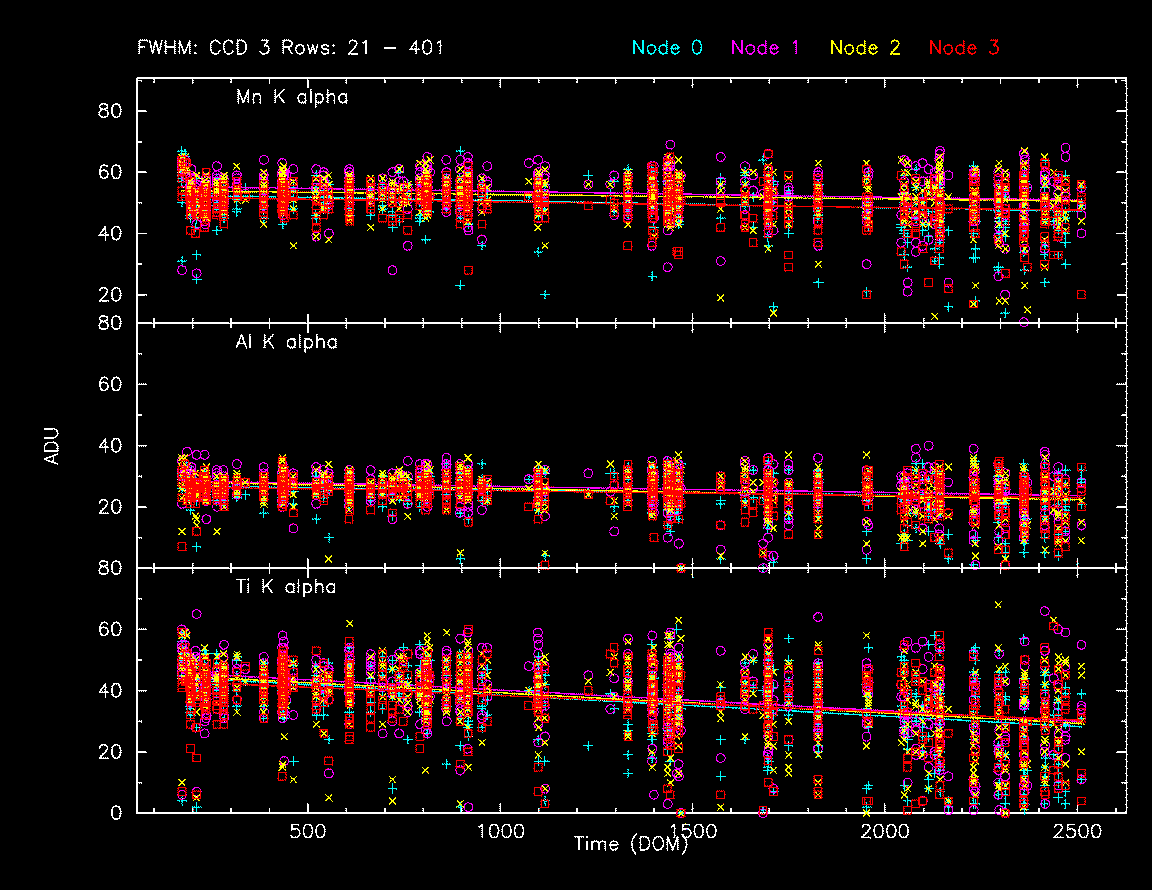
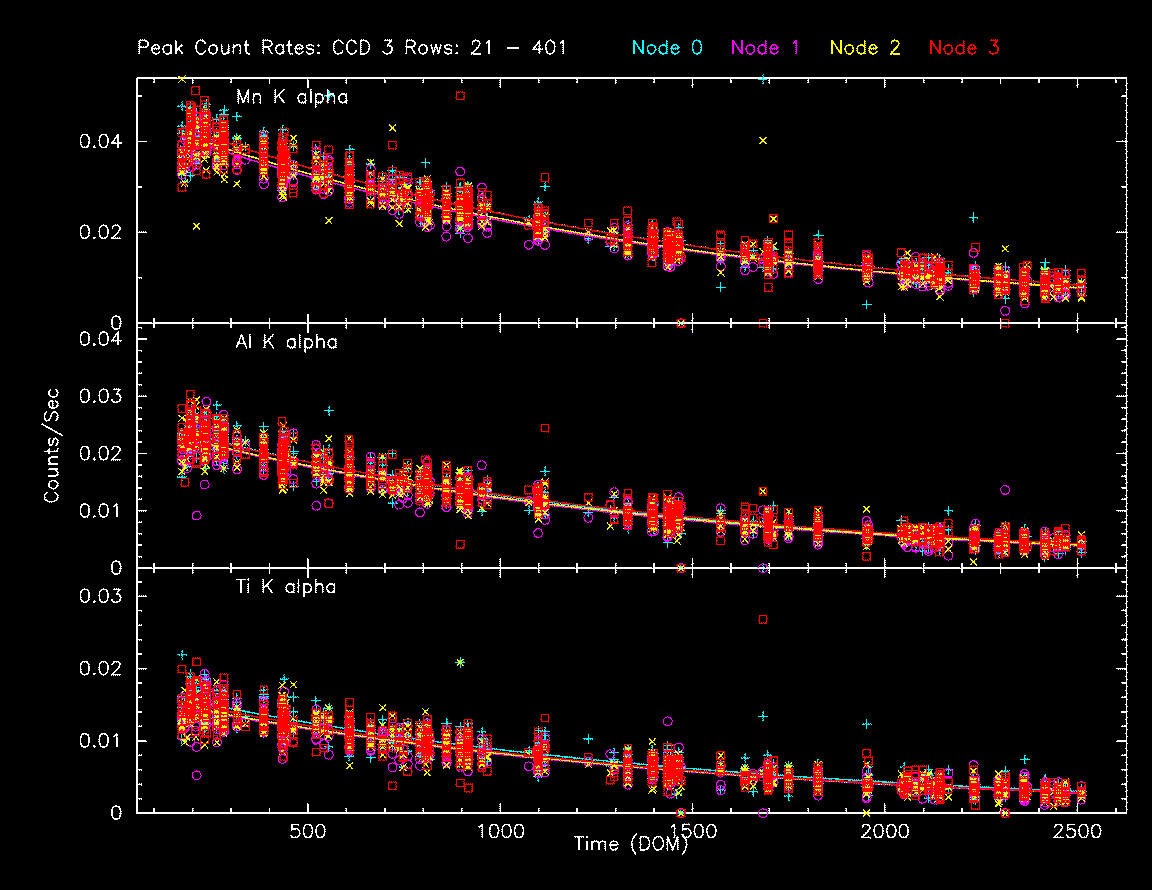
        IMAGE                NPIX      MEAN    STDDEV      MIN       MAX
HRCI_11_2006.fits          16777216  0.010     0.100       0.0        4.0
        IMAGE                NPIX      MEAN    STDDEV      MIN       MAX
HRCI_08_1999_11_2006.fits  16777216  2.205     3.314       0.0       288.0
        IMAGE                NPIX      MEAN    STDDEV      MIN       MAX
N/A
        IMAGE                NPIX     MEAN      STDDEV      MIN      MAX
HRCS_08_1999_11_2006.fits  16777216  7.504     15.140       0.0      1526.0
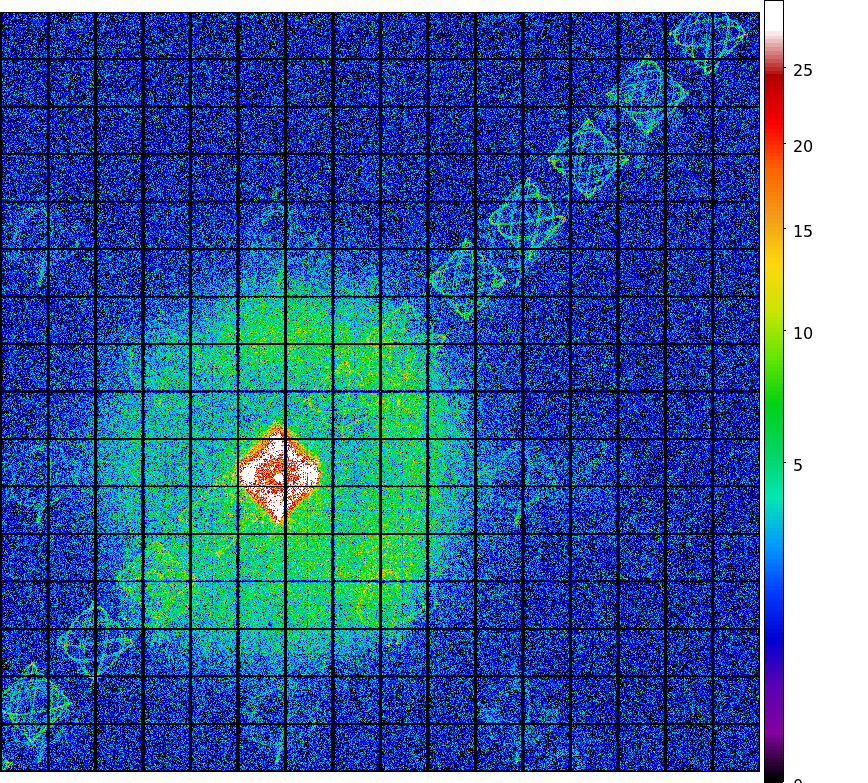
We display a max dose trend plot corrected for events that "pile-up" in the center of the taps due to bad position information.

|
|
|
|
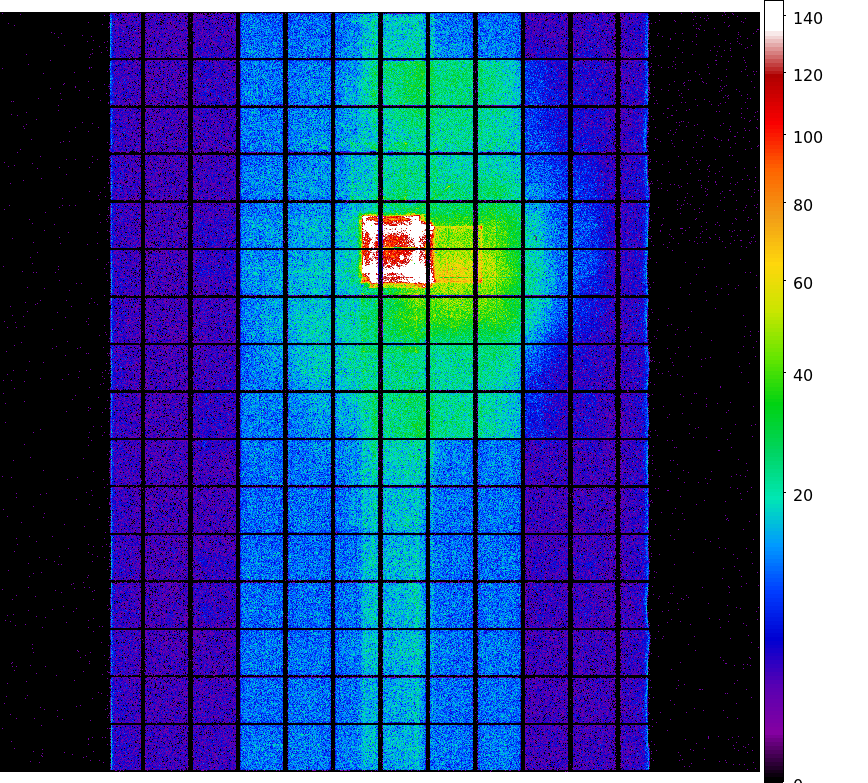
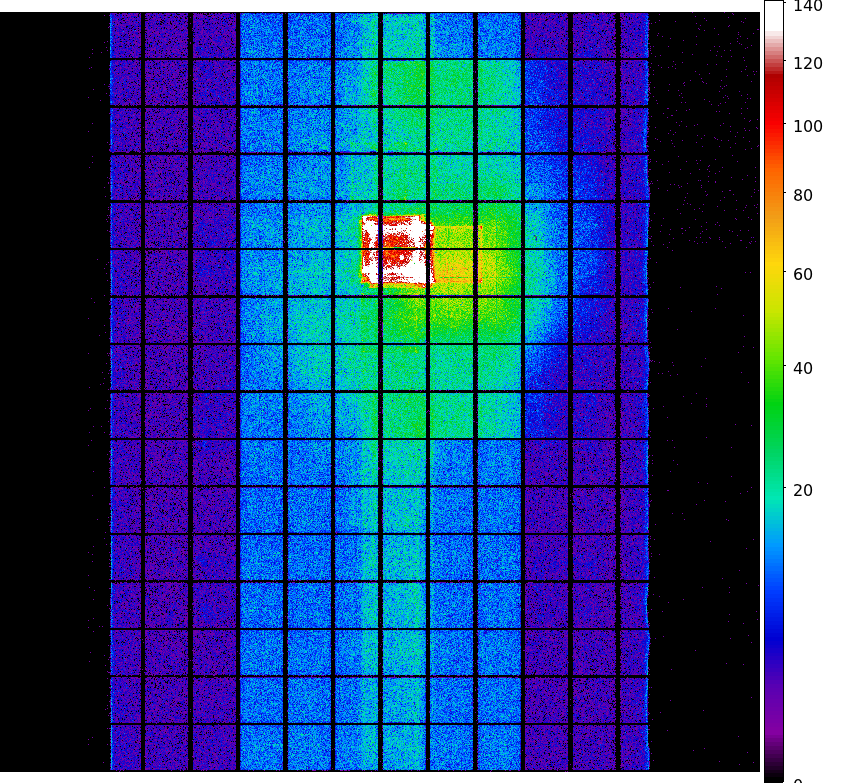
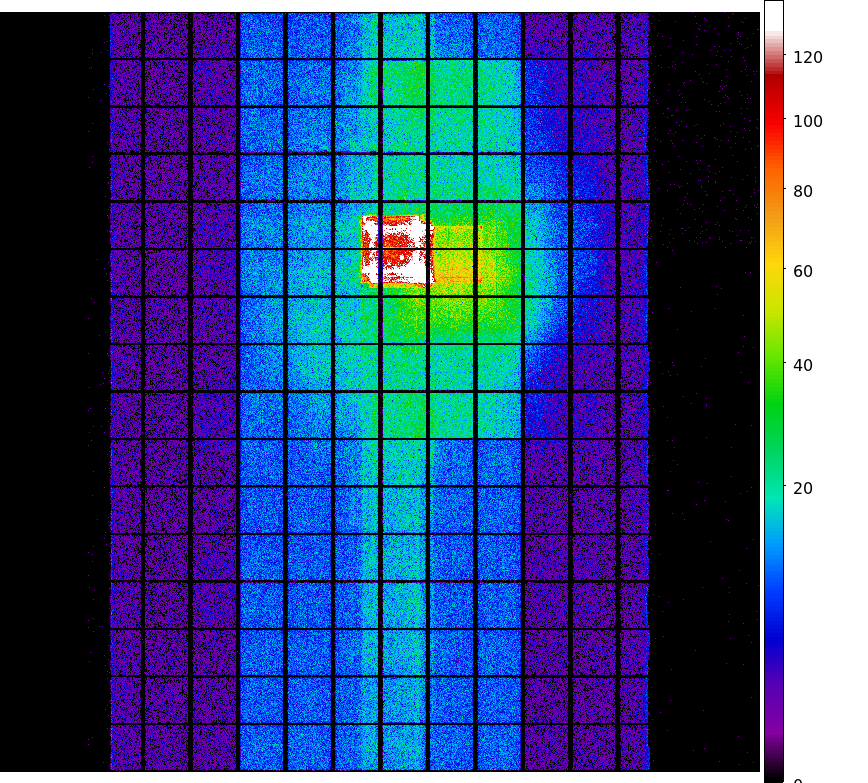
| Aug 2006 | May 2006 | Feb 2006 | Nov 2005 |
|---|
|
|
|
|
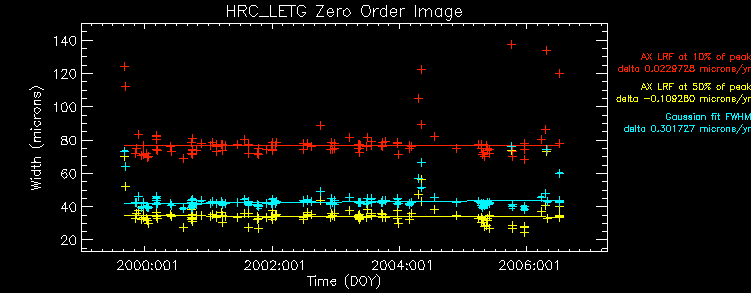
| Aug 2006 | May 2006 | Feb 2006 | Nov 2005 |
|---|

| Previous Quarter | ||||||
| MSID | MEAN | RMS | DELTA/YR | DELTA/YR/YR | UNITS | DESCRIPTION |
| 1DE28AVO | 28.68 | 0.22 | -2.470e+00 | -1.059e+01 | V | DEA +28V INPUT A |
| 1DP28AVO | 28.71 | 0.22 | -2.461e+00 | -1.069e+01 | V | DPA +28V INPUT A |
| Previous Quarter | ||||||
| MSID | MEAN | RMS | DELTA/YR | DELTA/YR/YR | UNITS | DESCRIPTION |
| 5EPHINT | 310.01 | 3.92 | -2.766e+00 | -9.505e+01 | K | EPHIN TEMP |
| HKEBOXTEMP | 314.70 | 3.84 | -2.565e+00 | -1.210e+02 | K | EPHIN HOUSEKEEPING EBOX: TEMPERATURE (5EHSE300) |
| HKP27I | 7.27 | 0.51 | -2.271e-01 | -6.316e+00 | AMP | HK 27 Volts Rail - Current |
| HKP27V | 16.01 | 5.10 | 6.521e+00 | 2.973e+02 | V | HK 27 Volts Rail - Voltage |
| TEIO | 313.36 | 16.05 | -1.811e+01 | -9.252e+02 | K | EPHIN ELECTRONICS HOUSING TEMP |
| TEPHIN | 310.20 | 4.11 | -3.141e+00 | -1.531e+02 | K | EPHIN SENSOR HOUSING TEMP |
| Previous Quarter | ||||||
| MSID | MEAN | RMS | DELTA/YR | DELTA/YR/YR | UNITS | DESCRIPTION |
| ELBI | 59.31 | 1.54 | -1.089e+00 | 2.149e+02 | AMP | LOAD BUS CURRENT |
| ELBV | 29.66 | 0.20 | -2.375e+00 | -1.161e+01 | V | LOAD BUS VOLTAGE |
| 
|

| Year | Month | |||||||||||
|---|---|---|---|---|---|---|---|---|---|---|---|---|
| 1999 | Jul | Aug | Sep | Oct | Nov | Dec | ||||||
| 2000 | Jan | Feb | Mar | Apr | May | Jun | Jul | Aug | Sep | Oct | Nov | Dec |
| 2001 | Jan | Feb | Mar | Apr | May | Jun | Jul | Aug | Sep | Oct | Nov | Dec |
| 2002 | Jan | Feb | Mar | Apr | May | Jun | Jul | Aug | Sep | Oct | Nov | Dec |
| 2003 | Jan | Feb | Mar | Apr | May | Jun | Jul | Aug | Sep | Oct | Nov | Dec |
| 2004 | Jan | Feb | Mar | Apr | May | Jun | Jul | Aug | Sep | Oct | Nov | Dec |
| 2005 | Jan | Feb | Mar | Apr | May | Jun | Jul | Aug | Sep | Oct | Nov | Dec |
| 2006 | Jan | Feb | Mar | Apr | May | Jun | Jul | Aug | Sep | Oct | ||