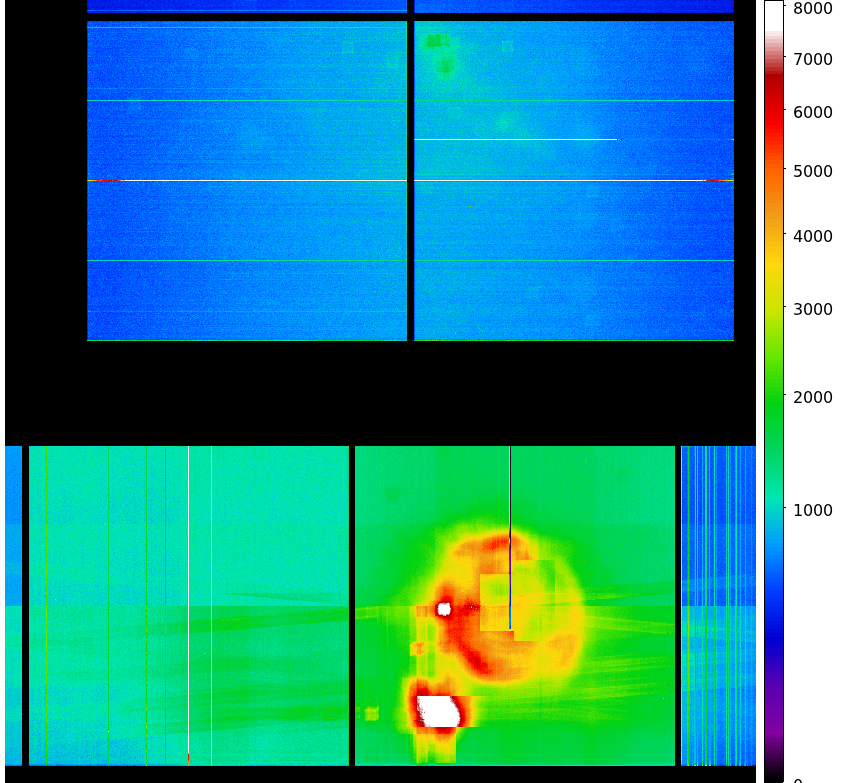
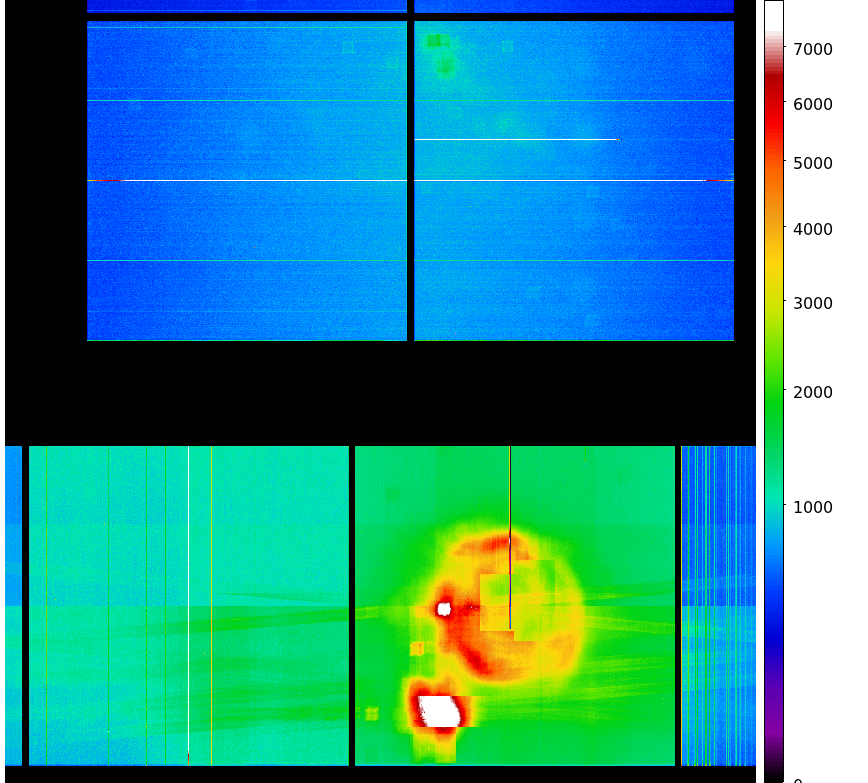
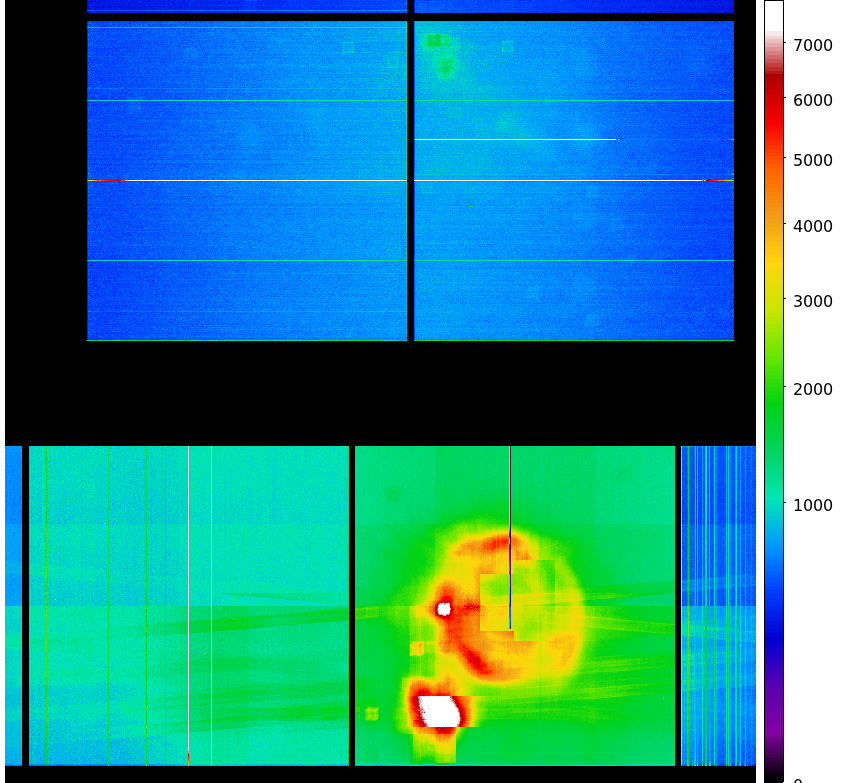
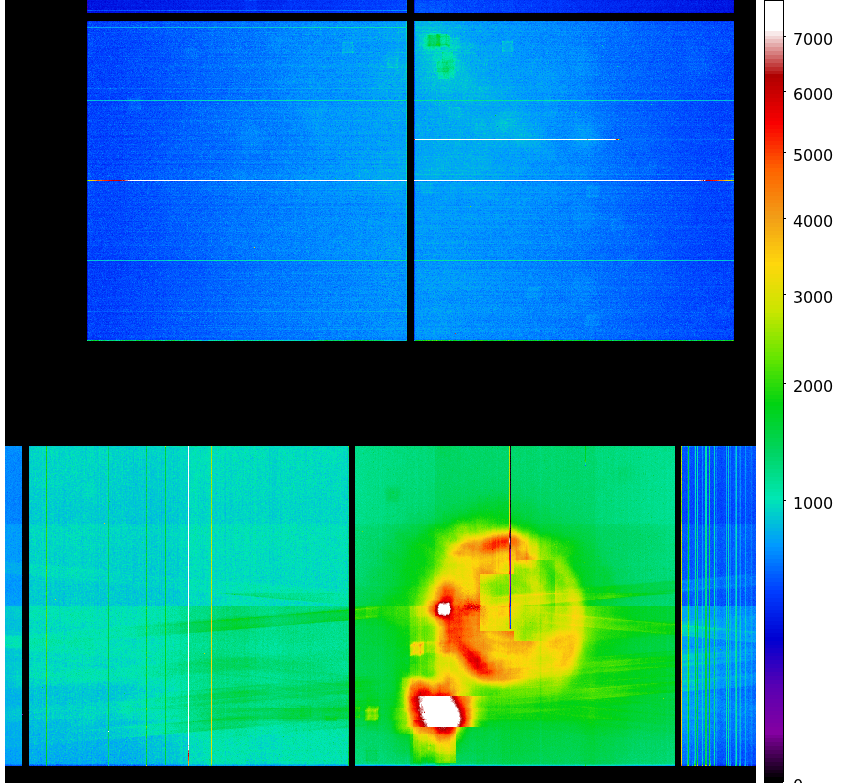
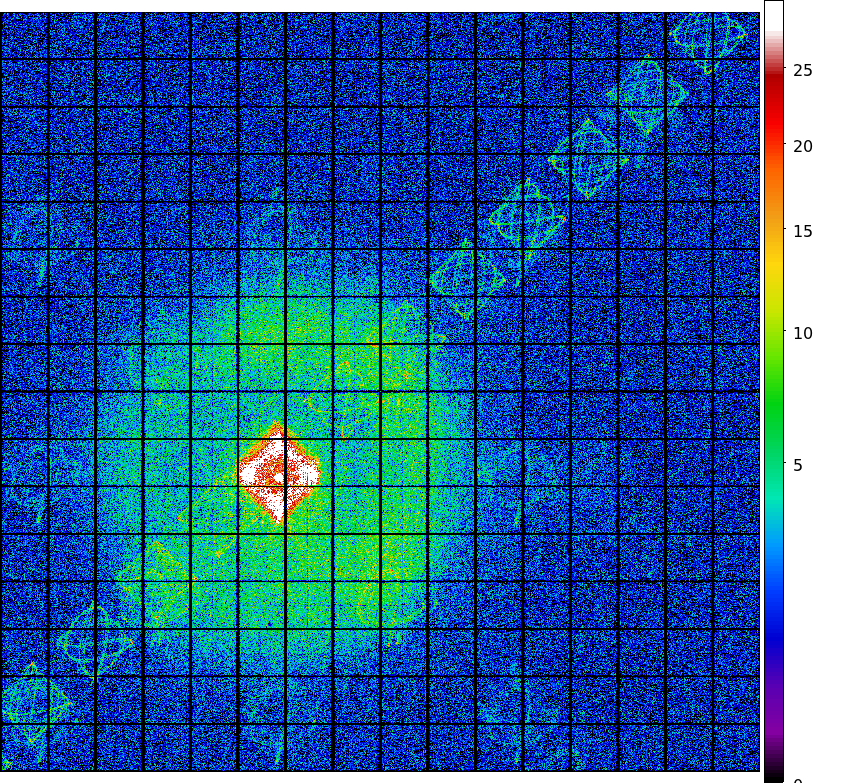
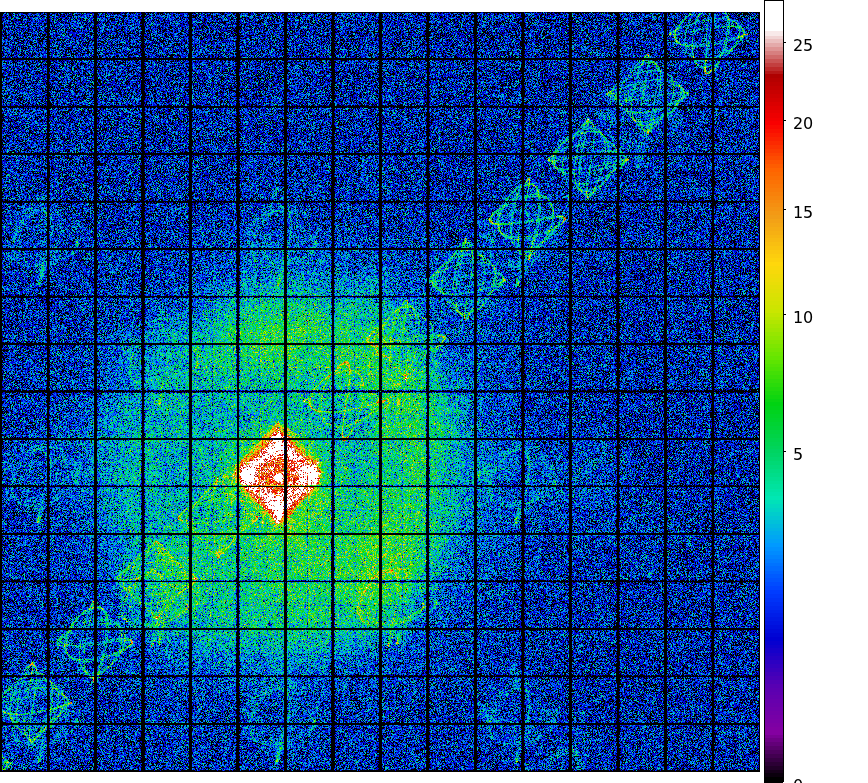
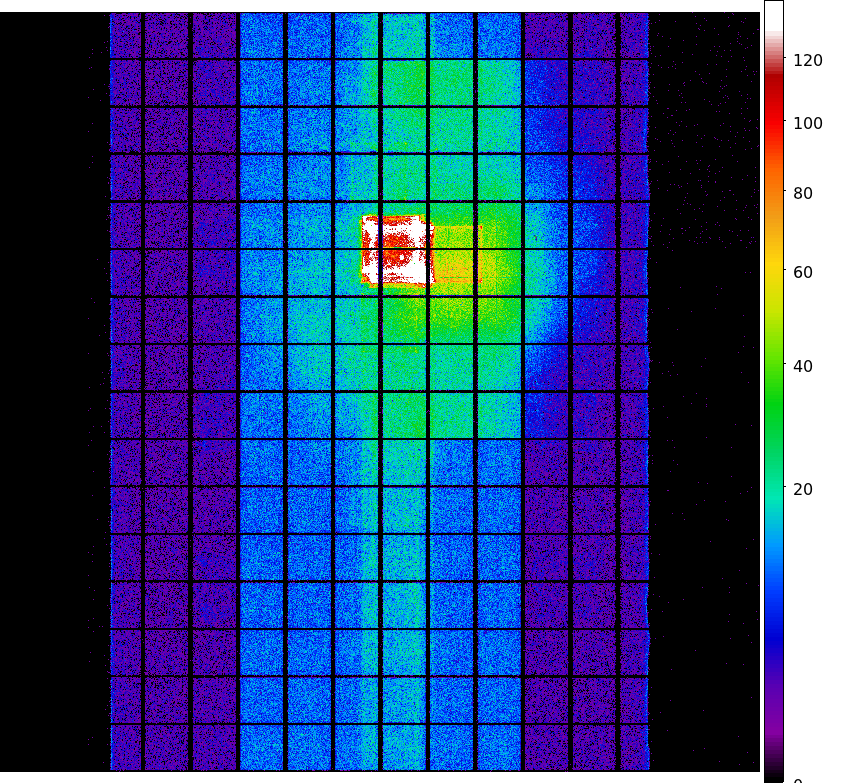
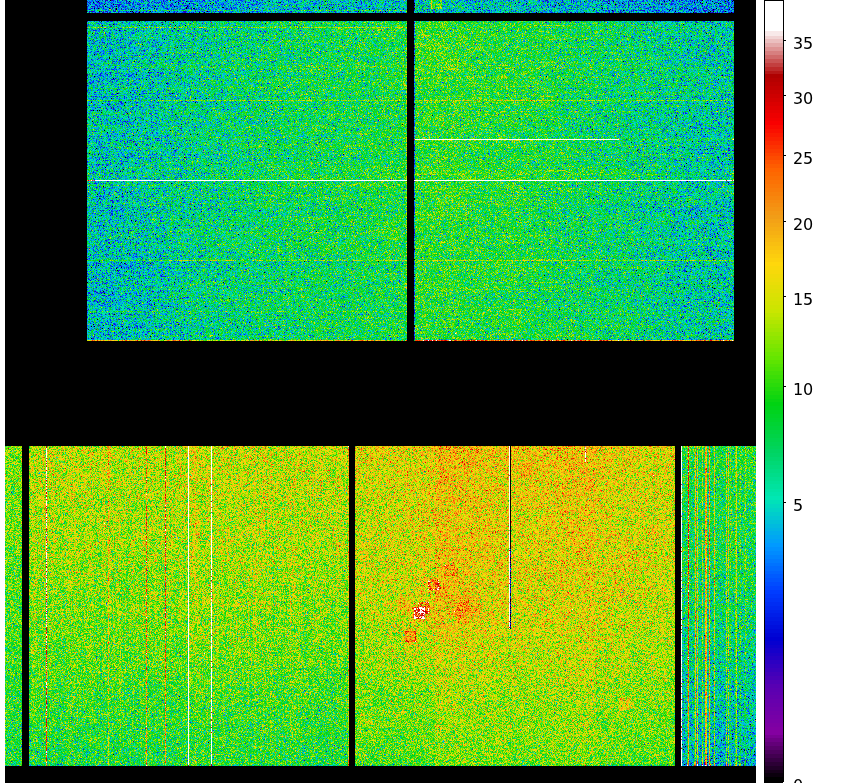
- ACIS DOSE registered-photon-map
The steps we took to compute the dose map are;
- Level 1 Event files for a specified month are obtained from archive.
- Image data including I2, I3, S2, S3 CCDs are extracted from all event files.
- All the extracted image data were merged to create a month long exposure map for the month.
- The exposure map is opened with ds9, and check a distribution of count rates against energy.
From this, estimate the upper threshold value. Any events beyond this upper threshold are
assumed erroneous events such as bad pixels.
- Using this upper threshold, the data is filtered, and create a cleaned exposure map for the month.
- The exposure map from each month from the Aug 1999 is added up to create a cumulative exposure
map for each month.
- Using fimgstatistic, we compute count rate statistics for each CCDs.
- For observations with high data drop rates (e.g., Crab nebula, Cas A), we corrected the
observations by adding events.
Note: Counts and RMS's of Cumulative maps are lower than the previous months. This is because we excluded
extreme outliers.
Please check more detail plots at Telemetered Photon Dose Trend page.
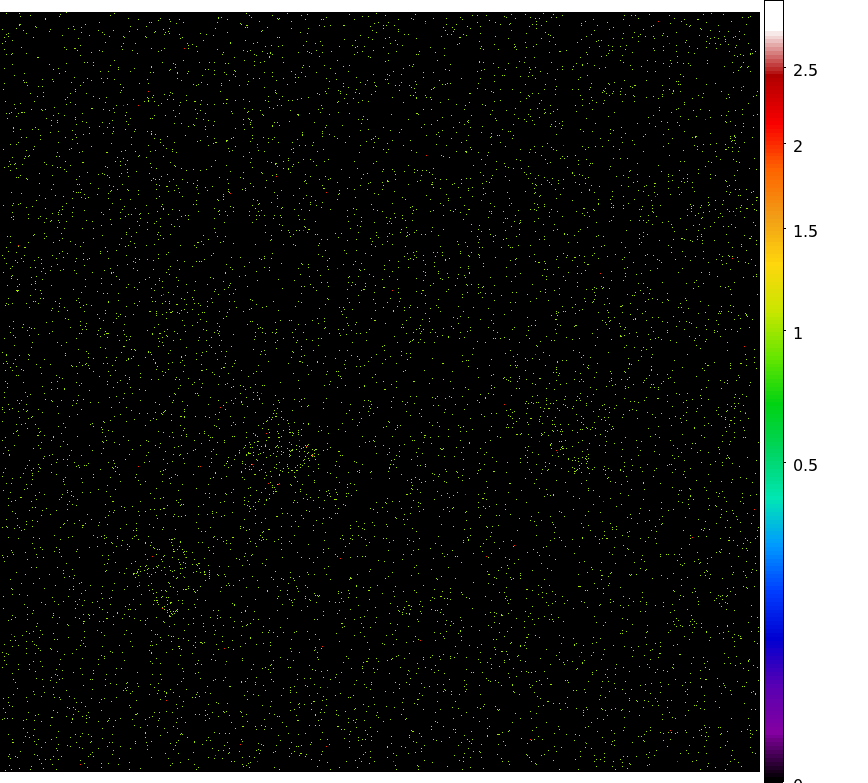
- DEC registered-photon-map in fits
Statistics:
# IMAGE     NPIX        MEAN           RMS              MIN     MAX
ACIS_dec06 6004901       8.18          11.86            0.0     717.0

 I2 node 0  262654      6.800404        2.977706        0.0      39.0
 I2 node 1  262654      7.224385        3.386044        0.0     329.0
 I2 node 2  262654      7.054157        3.020913        0.0      43.0
 I2 node 3  262654      7.057454        3.242488        0.0      44.0

 I3 node 0  262654      7.961887        3.333708        0.0      38.0
 I3 node 1  262654      8.392006        7.811122        0.0     177.0
 I3 node 2  262654      7.671119        3.157976        0.0      35.0
 I3 node 3  262654      7.705826        3.254960        0.0     162.0

 S2 node 0  262654      12.066789       4.416334        0.0     446.0
 S2 node 1  262654      12.278136       4.831094        0.0      93.0
 S2 node 2  262654      12.686432       4.635417        0.0      93.0
 S2 node 3  262654      12.145383       4.157060        0.0     398.0

 S3 node 0  262654      14.385666       4.620106        1.0      86.0
 S3 node 1  262654      15.827066       5.179847        0.0     125.0
 S3 node 2  262654      15.404588       4.439497        1.0     364.0
 S3 node 3  262654      14.363445       4.198408        0.0     163.0
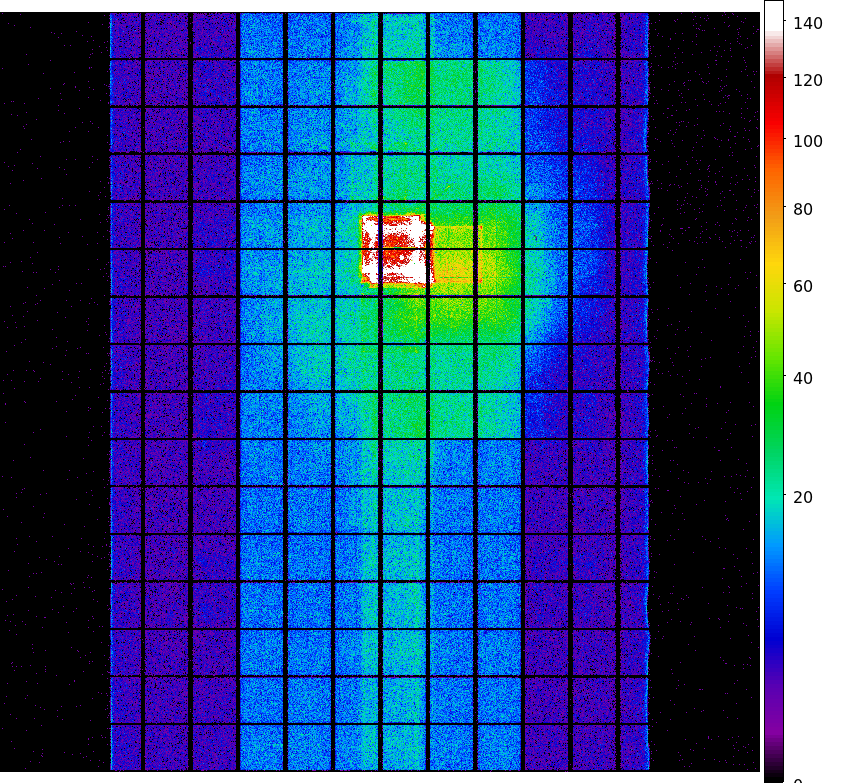
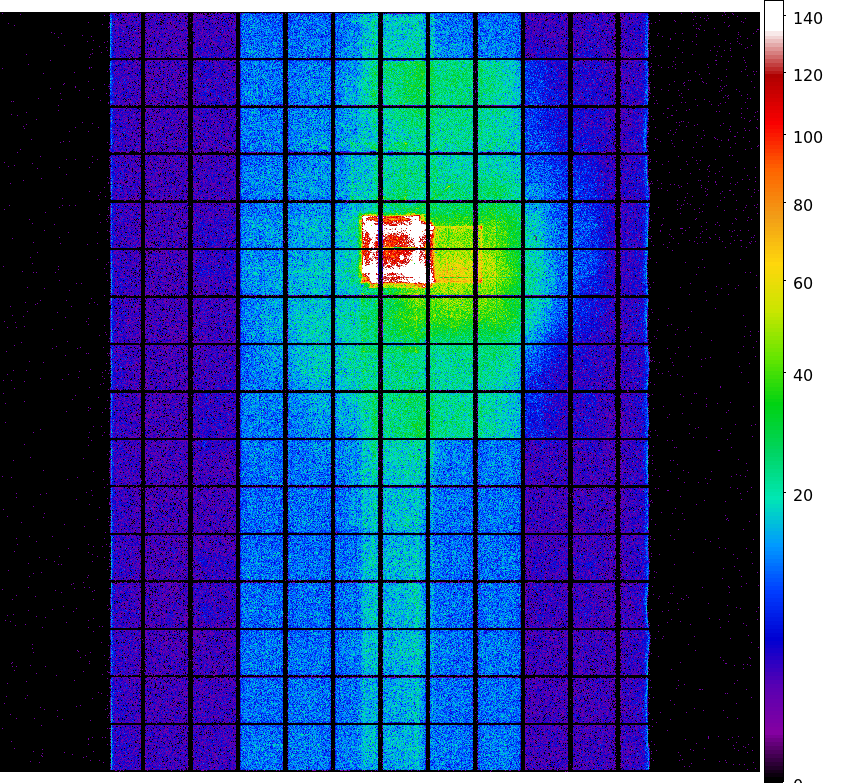
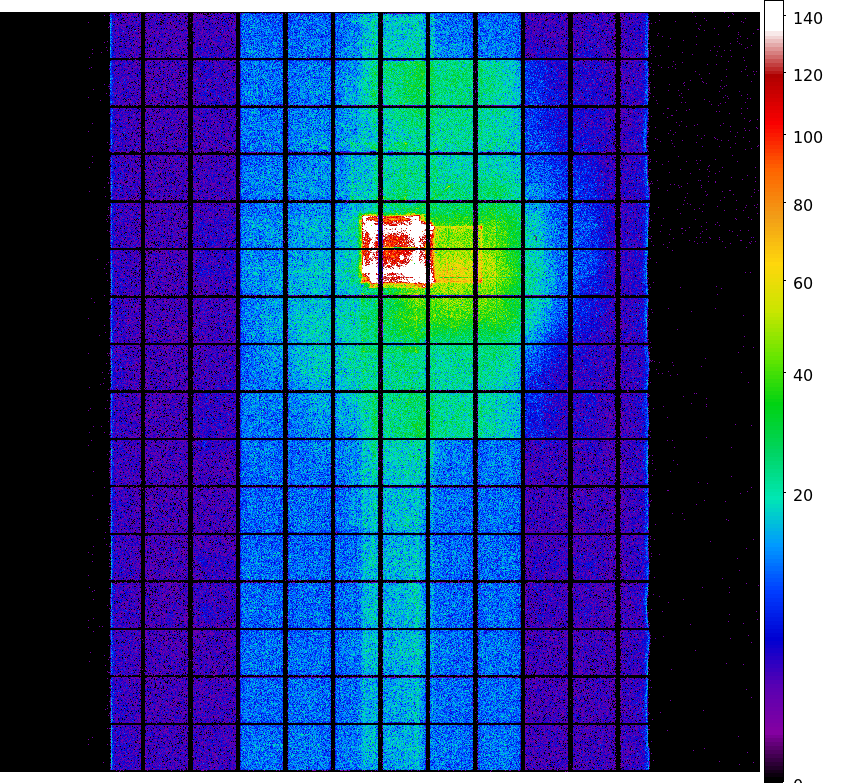
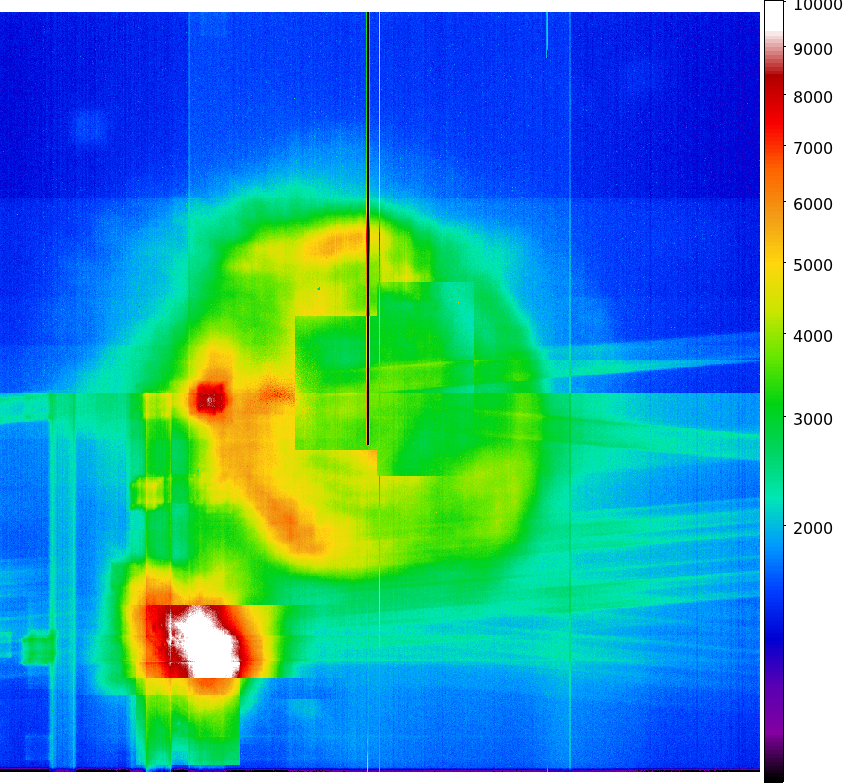
- Jul 1999 - Dec 2006 registered-photon-map in fits
Statistics:
 IMAGE        NPIX      MEAN          RMS              MIN    MAX
ACIS_total  6004901   967.54        1346.72            0.0   57077.0

 I2 node 0  262654      692.474224      121.440019      0.0     2824.0
 I2 node 1  262654      731.076149      166.593171      0.0     7689.0
 I2 node 2  262654      743.712627      140.110046      0.0     2595.0
 I2 node 3  262654      748.849303      178.555863      0.0     3487.0

 I3 node 0  262654      796.624733      202.771688      0.0     4883.0
 I3 node 1  262654      816.902161      552.481976      0.0     14882.0
 I3 node 2  262654      728.910466      120.915378      0.0     2905.0
 I3 node 3  262654      720.260838      130.865722      0.0     13374.0

 S2 node 0  262654      1112.148108     138.192422      520.0   12470.0
 S2 node 1  262654      1181.010508     238.302726      558.0   5804.0
 S2 node 2  262654      1338.843539     268.076097      742.0   9157.0
 S2 node 3  262654      1303.014108     214.460638      749.0   11088.0

 S3 node 0  262654      2167.284543     1212.714979     817.0   10429.0
 S3 node 1  262654      3332.341122     1741.441257     0.0     11444.0
 S3 node 2  262654      2338.566762     762.699890      673.0   4897.0
 S3 node 3  262654      1713.952295     297.742037      851.0   7205.0
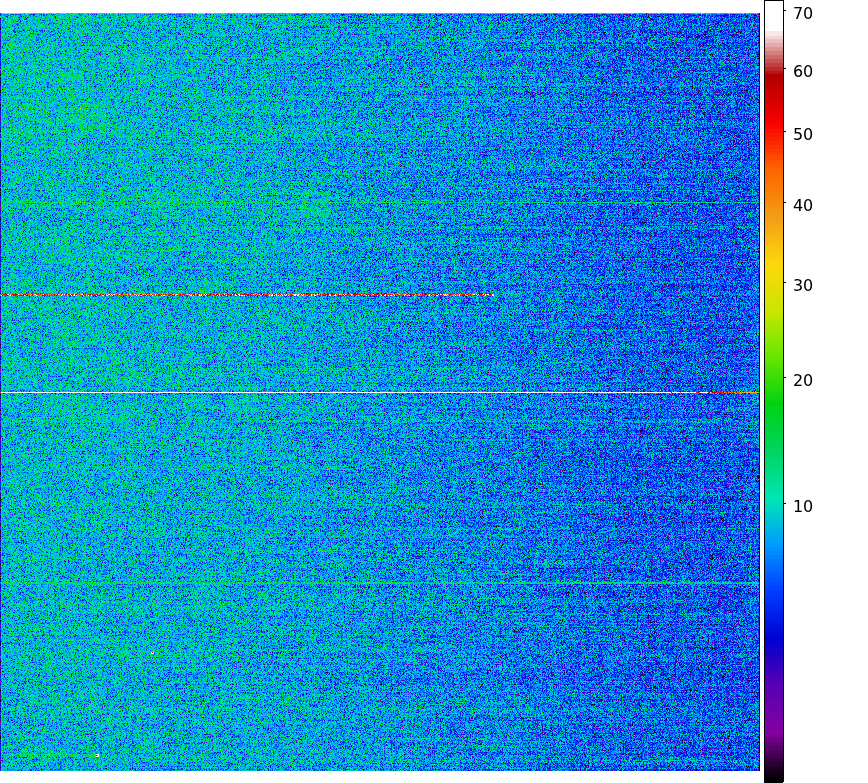
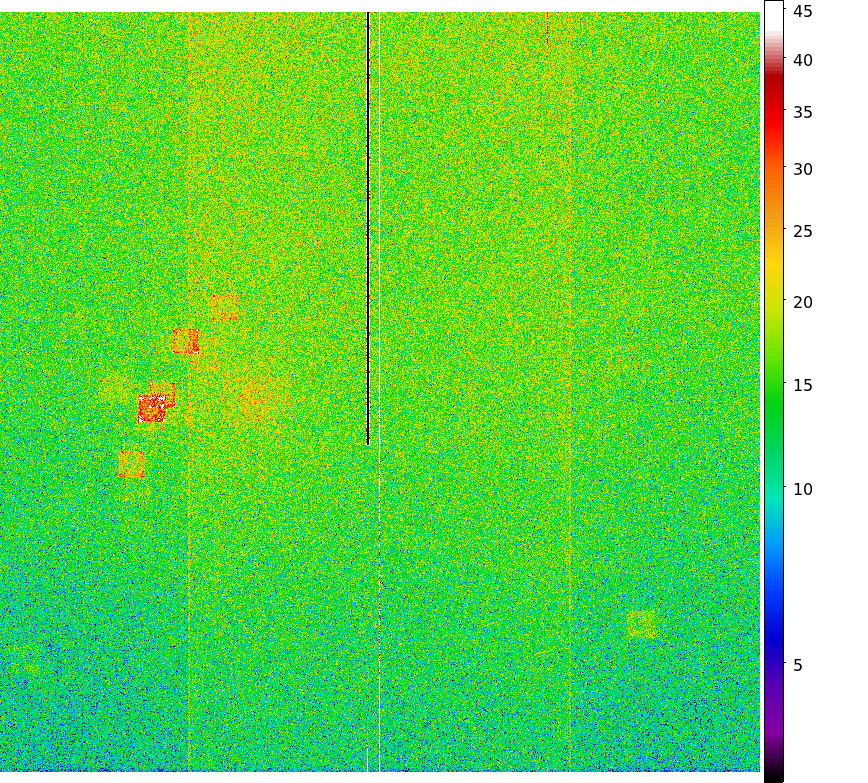
- DEC 2006 dose PNG image
- DEC I3 dose PNG image
- DEC S3 dose PNG image
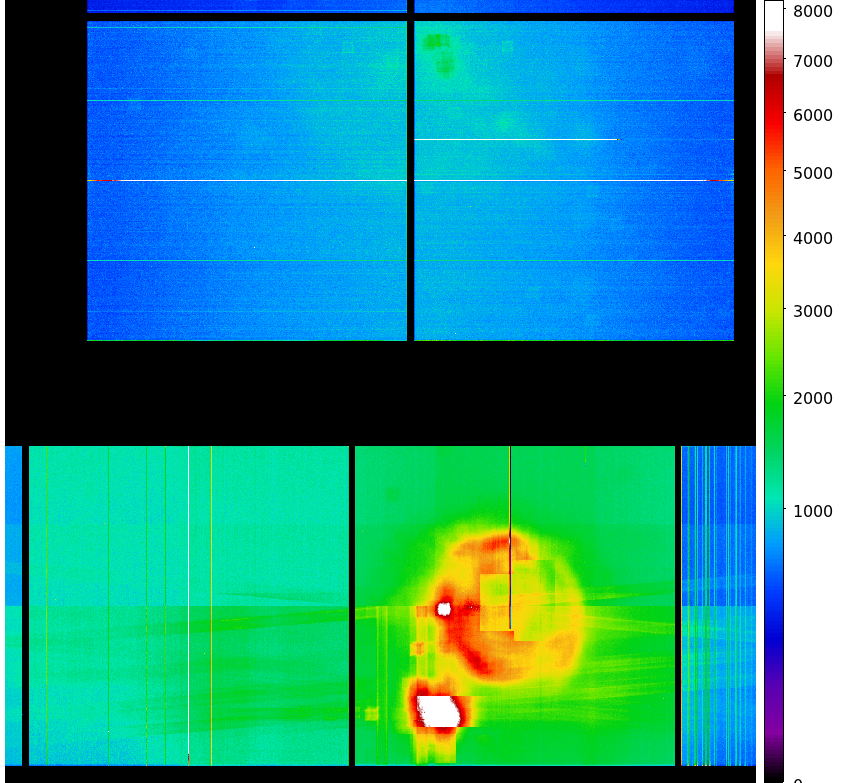
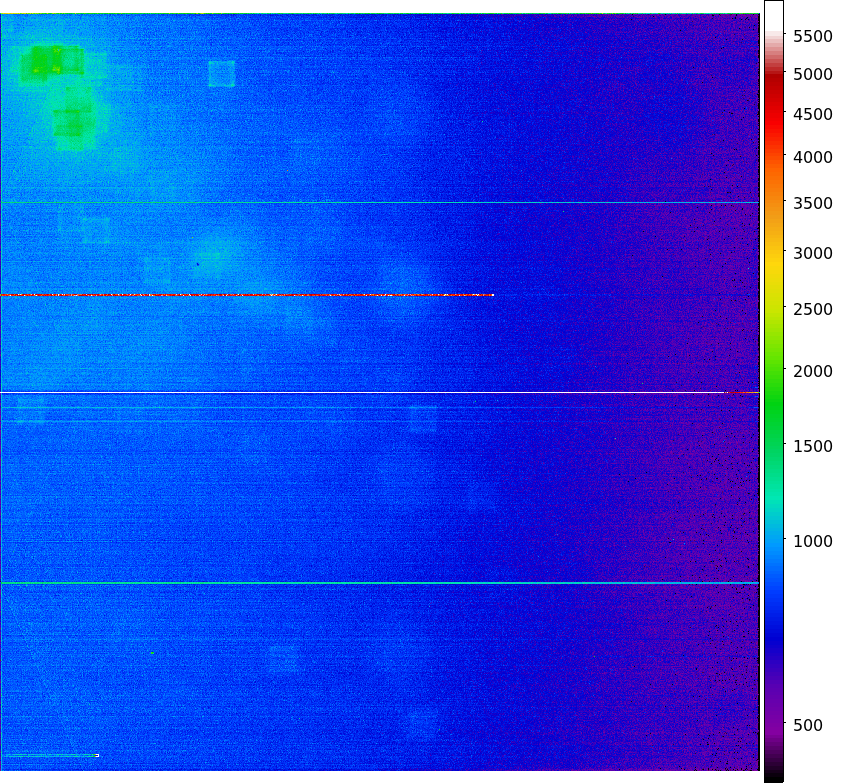
- TOTAL JUL 1999 - DEC 2006 dose PNG image
- TOTAL I3 dose PNG image
- TOTAL S3 dose PNG image
- Integrated Exposure Maps of Last 12 Months
|
|
|
|
| Sep 2006 |
Jun 2006 |
Mar 2006 |
Dec 2005 |
- The Mean Detrended CTI
We report CTIs with a refined data definition. CTIs were computed for the temperature
dependency corrected data.
Please see
CTI page
for detailed explanation.
CTI's are computed for Mn K alpha, and defined as slope/intercept x10^4 of row # vs ADU.
Data file here
- Focal Plane Temperature
       The Mean (max) FPT: -116.51      std dev: 2.33
               mean width:    0.75 days std dev: 0.43
We are using 10 period moving averages to show
trends of peak temperatures and peak widths.
Note, the gaps in the width plot are due to missing/corrupted data.
The following is a plot of focal plane temperature and sun angle, earth angle, and altitude.

-
Acis Count Rate Plot
This monitors the ACIS count Rate vs. EPHIN count Rate.
No sources or CTI observations are removed. For daily updates see:
Ephin/Acis Info
- Science instrument background rates
This page shows scientific instrument background data based on Acis
observations. A source region file is generated using get_srcregions
and then the input event file is filtered using the regions in that file
to remove the sources.
| Name | Low (keV) | High(KeV) | Description |
|---|
| SSoft | 0.00 | 0.50 | Super soft photons |
|---|
| Soft | 0.50 | 1.00 | Soft photons |
|---|
| Med | 1.00 | 3.00 | Moderate energy photons |
|---|
| Hard | 3.00 | 5.00 | Hard Photons |
|---|
| Harder | 5.00 | 10.00 | Very Hard photons |
|---|
| Hardest | 10.00 | | Beyond 10 keV |
|---|
The following three plots show trends of SIB from year 2000.
CCDs shown here are CCD3, CCD5, and CCD7. Fitted lines are linear fit after eliminating extreme
outliers. For >10 keV plots, 2 lines are fit. One is with a 13 keV filter, and
another without.
CCD 3
CCD 5
CCD 7
- HRC
- Gratings
- Focus
We plot the width of the zero order streak of ACIS/HETG observations and
the width of the zero order image for HRC/LETG observations of point sources.
No significant defocusing trend is seen at this time. See
Gratings Focus
pages.


)
)
)
)
)
)
)
)
)
)
)
)
)
)
)
)
)
)
)
)
)
)
)
)
)
)
)
)
)
)
)
)
)
)
)
)