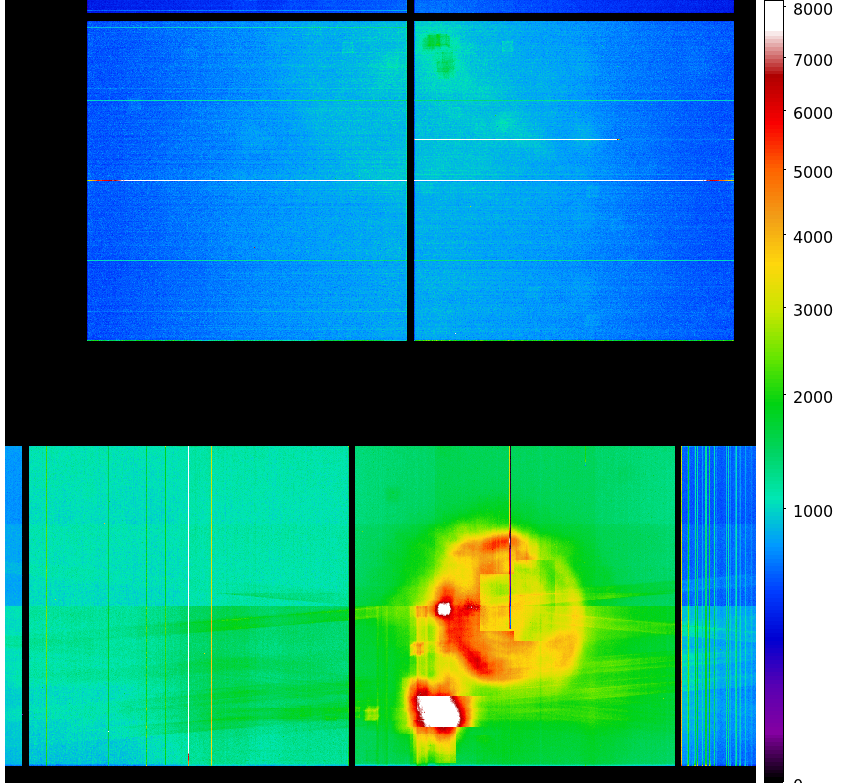
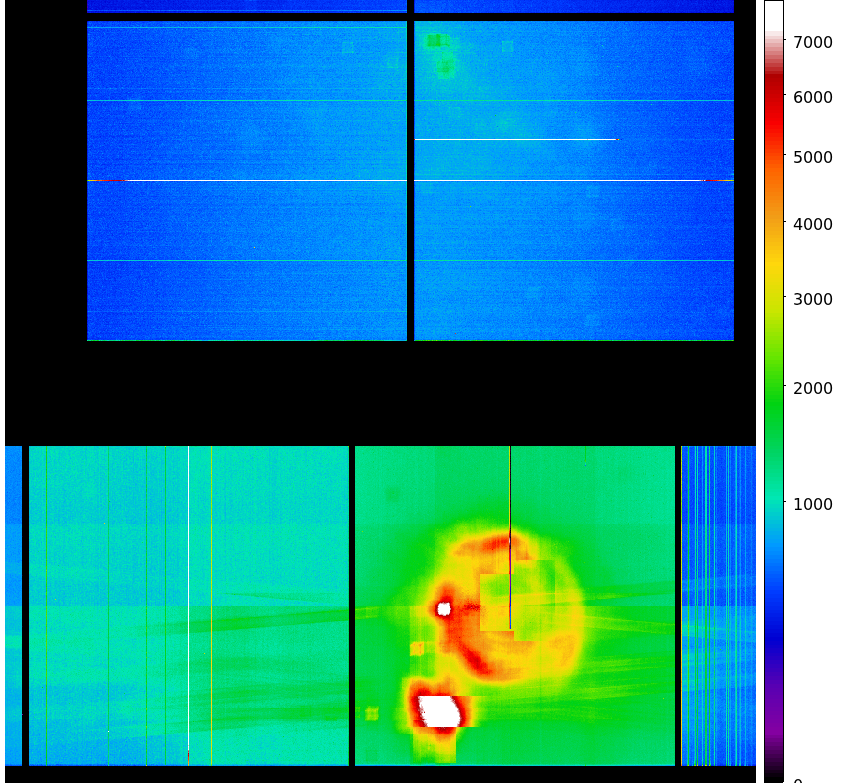
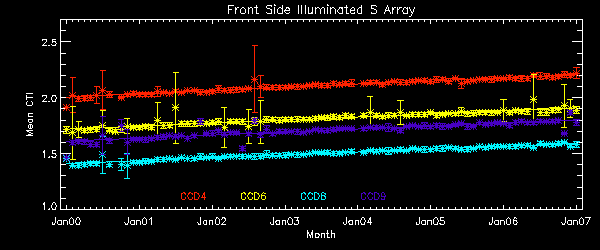
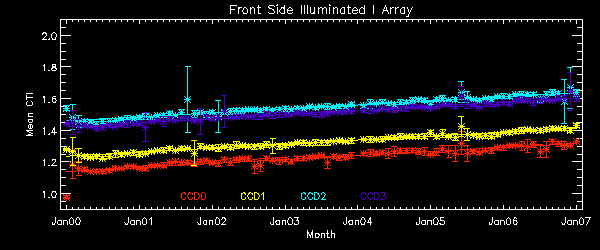
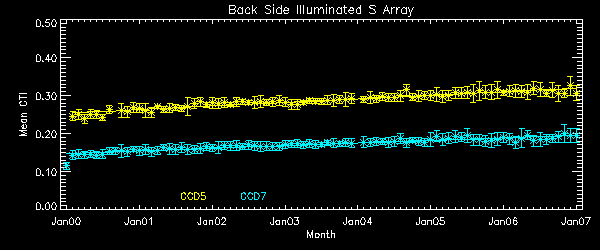
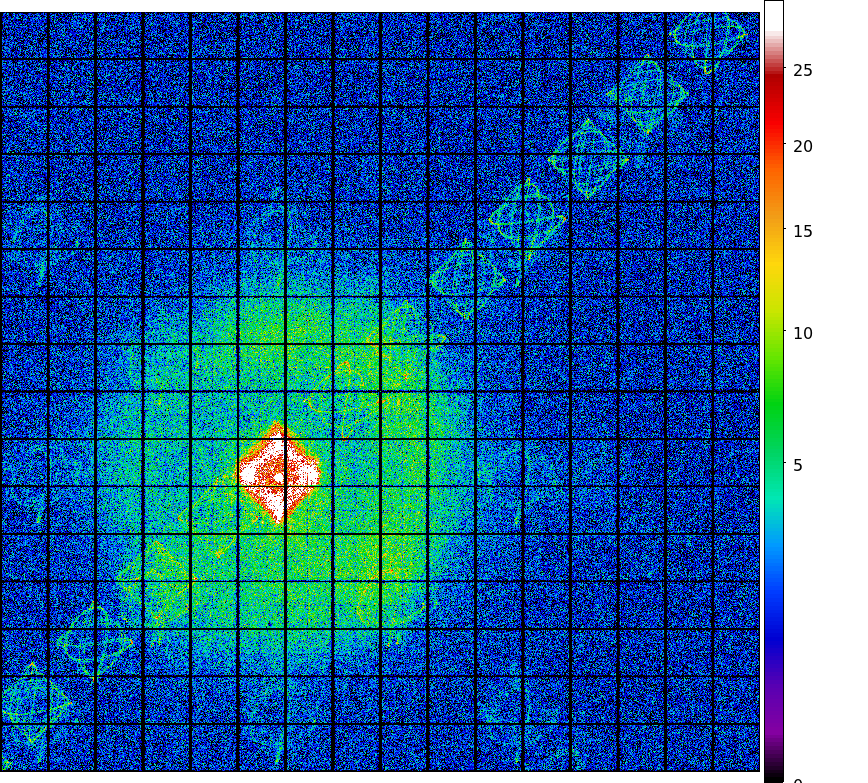
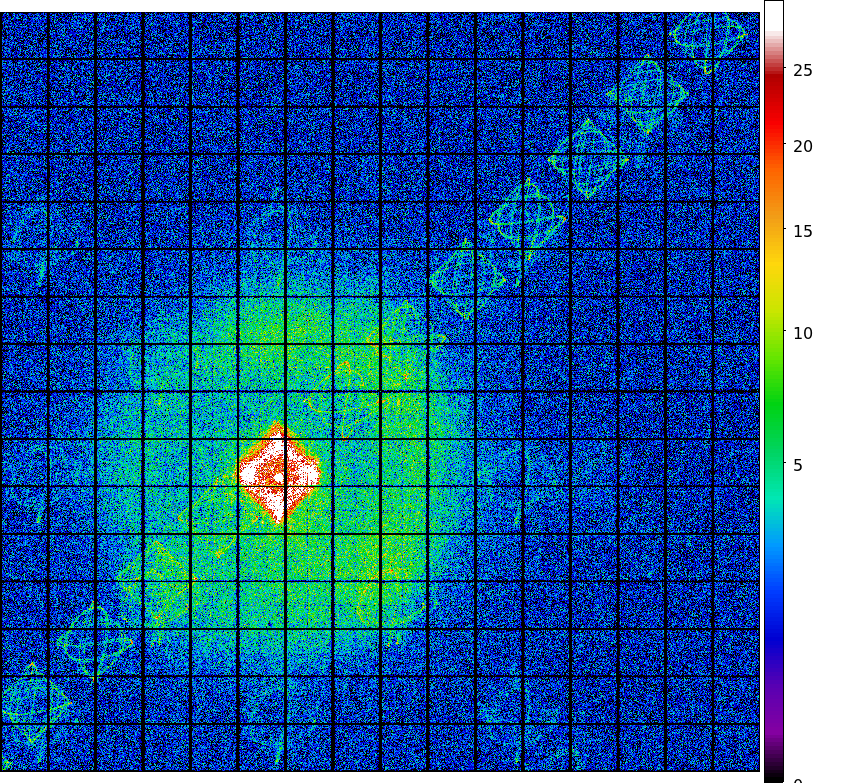
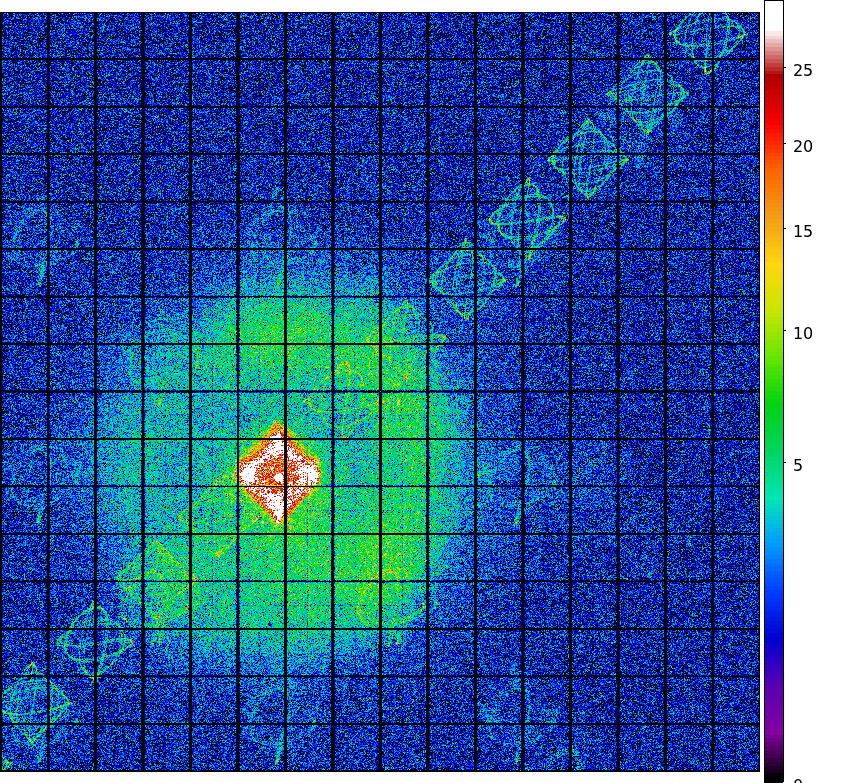
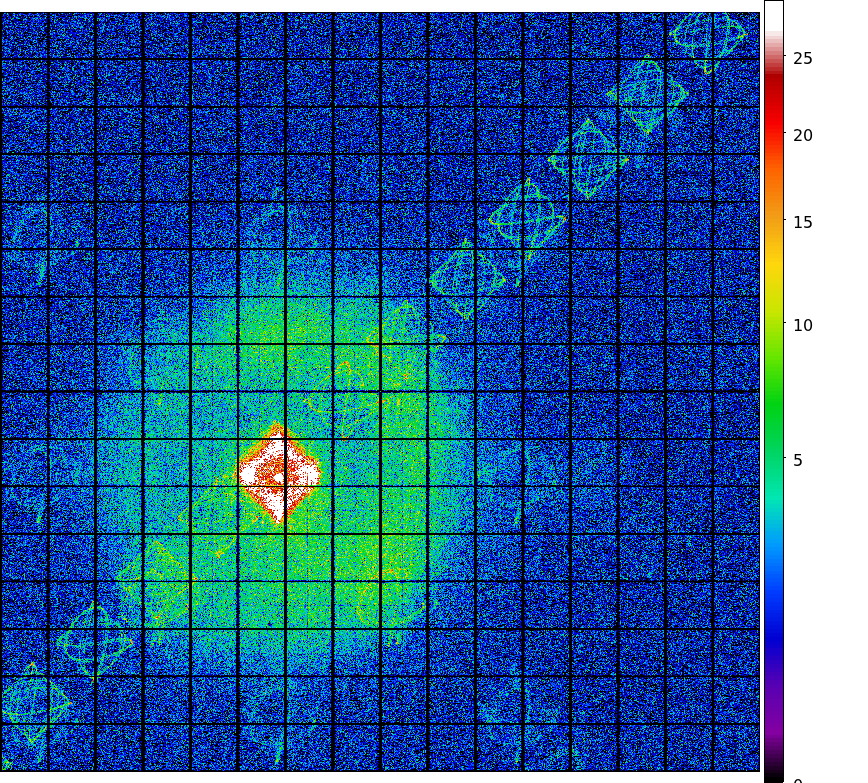
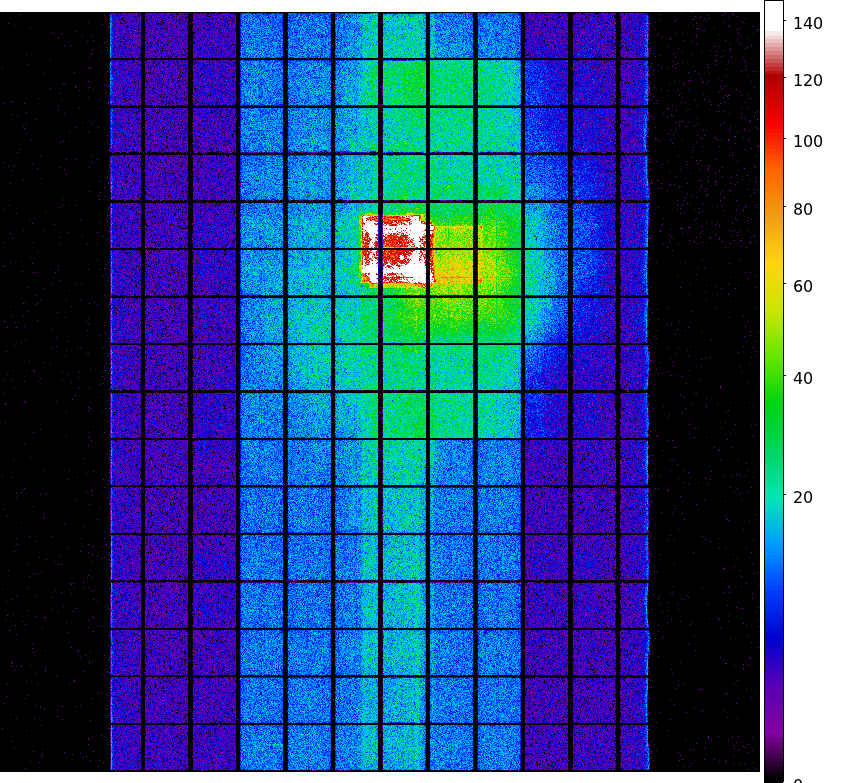
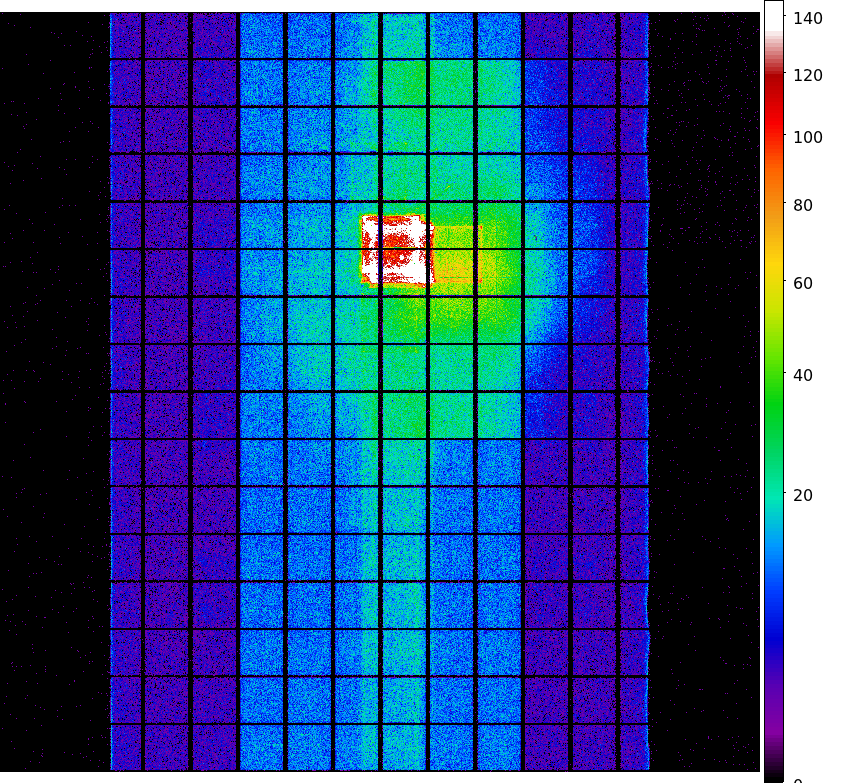
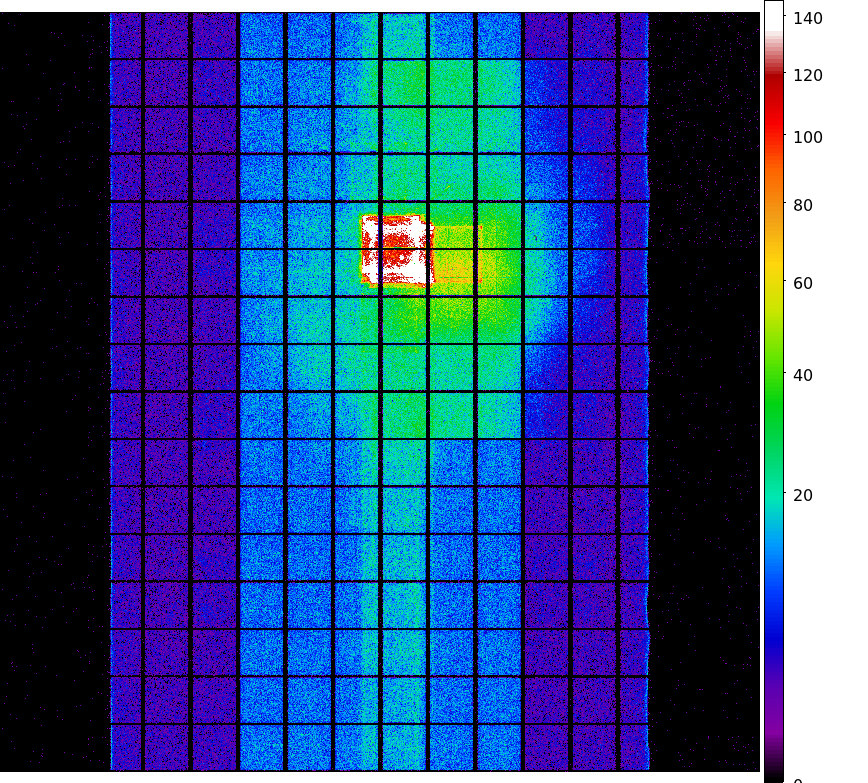
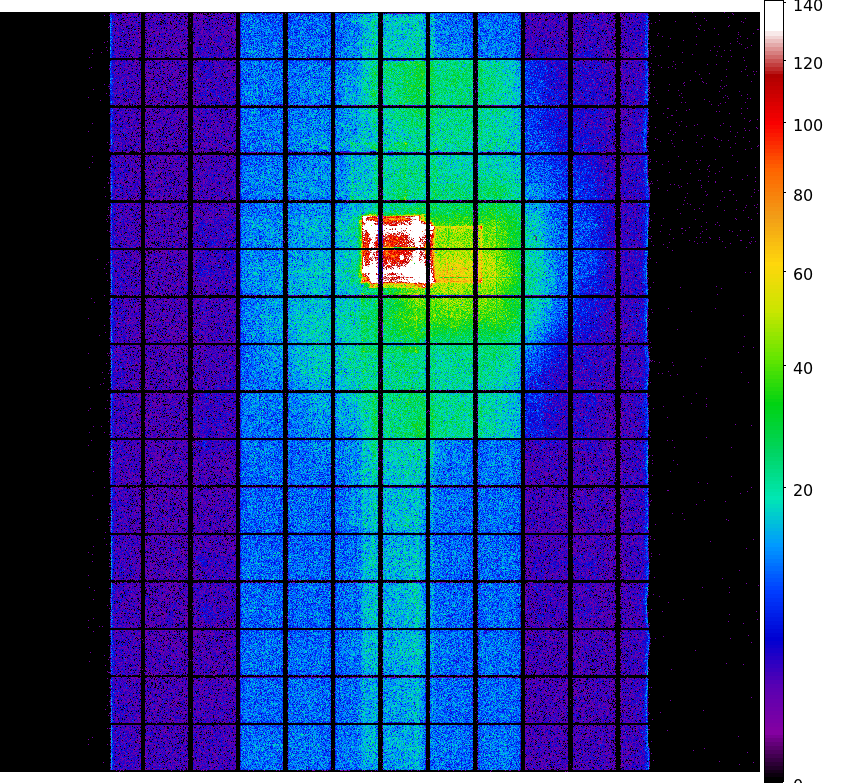
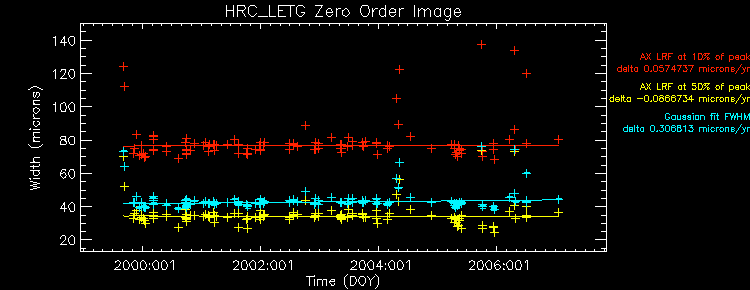
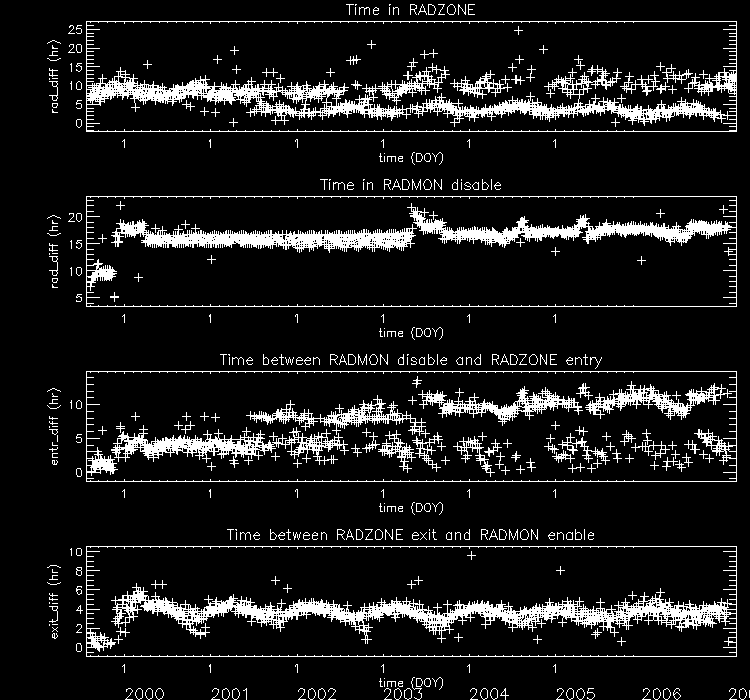
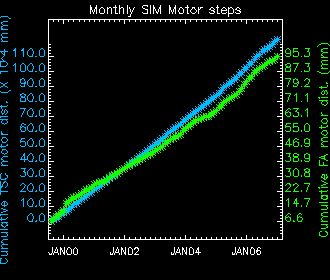
The steps we took to compute the dose map are;
- Level 1 Event files for a specified month are obtained from archive.
- Image data including I2, I3, S2, S3 CCDs are extracted from all event files.
- All the extracted image data were merged to create a month long exposure map for the month.
- The exposure map is opened with ds9, and check a distribution of count rates against energy.
From this, estimate the upper threshold value. Any events beyond this upper threshold are
assumed erroneous events such as bad pixels.
- Using this upper threshold, the data is filtered, and create a cleaned exposure map for the month.
- The exposure map from each month from the Aug 1999 is added up to create a cumulative exposure
map for each month.
- Using fimgstatistic, we compute count rate statistics for each CCDs.
- For observations with high data drop rates (e.g., Crab nebula, Cas A), we corrected the
observations by adding events.
Note: Counts and RMS's of Cumulative maps are lower than the previous months. This is because we excluded
extreme outliers.
Please check more detail plots at Telemetered Photon Dose Trend page.
- JAN registered-photon-map in fits
Statistics:
# IMAGE     NPIX        MEAN           RMS              MIN     MAX
ACIS_jan07 6004901       7.76          11.54            0.0     632.0

 I2 node 0  262654      8.071728        3.315372        0.0      47.0
 I2 node 1  262654      8.535195        3.685056        0.0     422.0
 I2 node 2  262654      8.450119        3.402599        0.0      61.0
 I2 node 3  262654      8.401053        3.587437        0.0      55.0

 I3 node 0  262654      8.291636        3.509354        0.0      49.0
 I3 node 1  262654      8.783817        8.231081        0.0     202.0
 I3 node 2  262654      8.071804        3.340578        0.0      57.0
 I3 node 3  262654      8.039581        3.448241        0.0     310.0

 I2 node 0  262654      10.443578       3.944515        0.0     632.0
 I2 node 1  262654      10.719122       4.213367        0.0      65.0
 I2 node 2  262654      11.226532       4.046585        0.0      95.0
 I2 node 3  262654      10.912081       3.910822        0.0     323.0

 I3 node 0  262654      13.862753       10.425451       0.0     295.0
 I3 node 1  262654      14.198642       5.148670        0.0      61.0
 I3 node 2  262654      13.626394       4.491857        0.0     286.0
 I3 node 3  262654      12.542729       4.183041        0.0      86.0
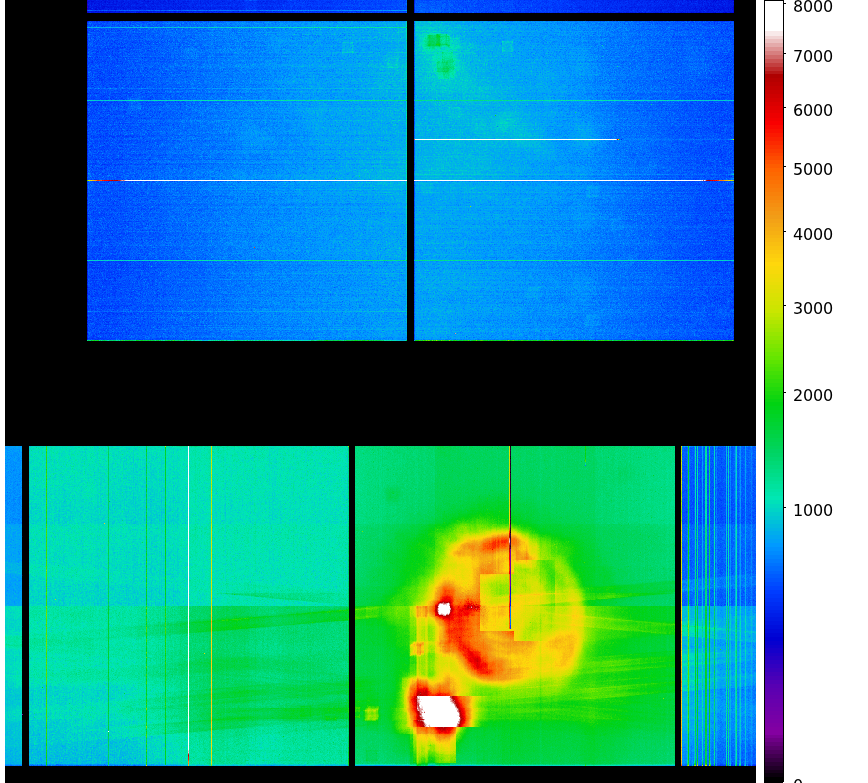
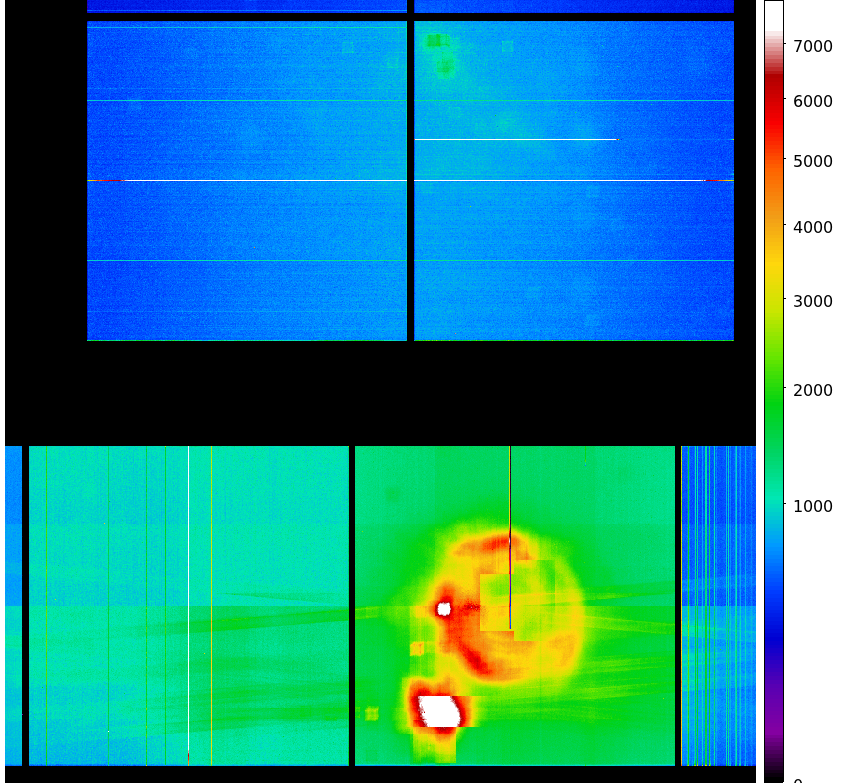
- Jul 1999 - Jan 2007 registered-photon-map in fits
Statistics:
 IMAGE        NPIX      MEAN          RMS              MIN    MAX
ACIS_total  6004901   975.32        1356.30            0.0   57629.0

 I2 node 0  262654      700.545952      122.971129      0.0     2871.0
 I2 node 1  262654      739.611344      168.573628      0.0     8111.0
 I2 node 2  262654      752.162746      141.687740      0.0     2646.0
 I2 node 3  262654      757.250357      180.483180      0.0     3528.0

 I3 node 0  262654      804.916368      204.502397      0.0     4913.0
 I3 node 1  262654      825.685978      560.077395      0.0     15084.0
 I3 node 2  262654      736.982271      122.471439      0.0     2962.0
 I3 node 3  262654      728.300419      132.550874      0.0     13519.0

 I2 node 0  262654      1122.591686     139.344795      529.0   12489.0
 I2 node 1  262654      1191.729630     240.050201      563.0   5858.0
 I2 node 2  262654      1350.070071     268.482006      748.0   9212.0
 I2 node 3  262654      1313.926189     214.303289      753.0   11411.0

 I3 node 0  262654      2181.147296     1213.388690     819.0   10436.0
 I3 node 1  262654      3346.539764     1742.361729     0.0     11466.0
 I3 node 2  262654      2352.193156     763.245526      687.0   4913.0
 I3 node 3  262654      1726.495024     297.837732      862.0   7262.0
- JAN 2007 dose PNG image
- JAN I3 dose PNG image
- JAN S3 dose PNG image
- TOTAL JUL 1999 - JAN 2007 dose PNG image
- TOTAL I3 dose PNG image
- TOTAL S3 dose PNG image
