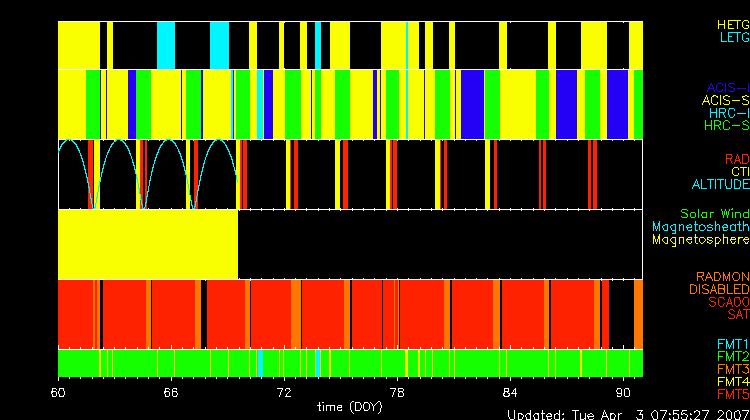

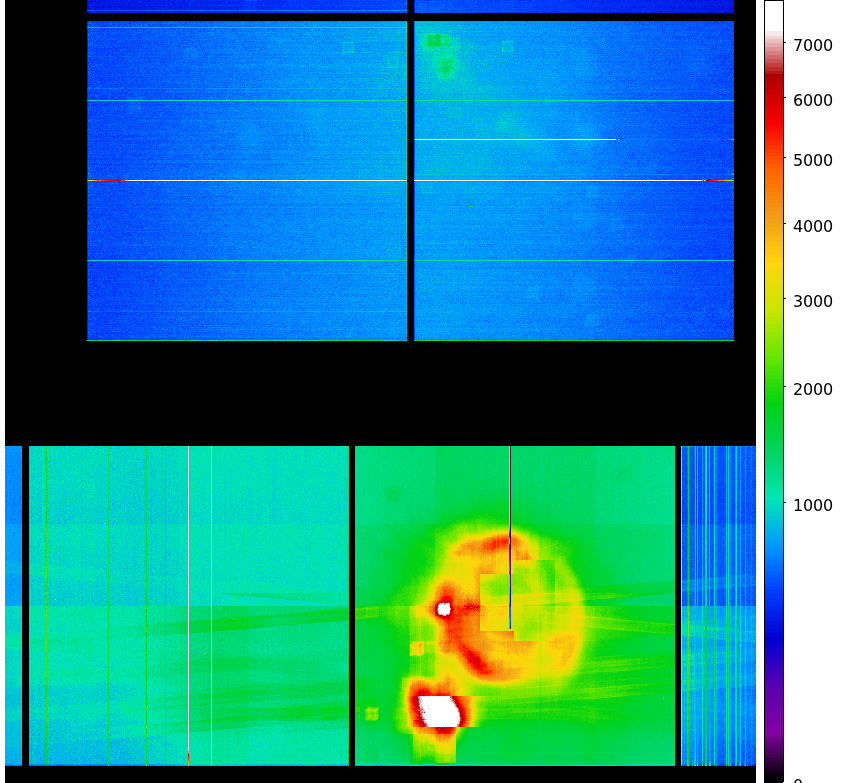
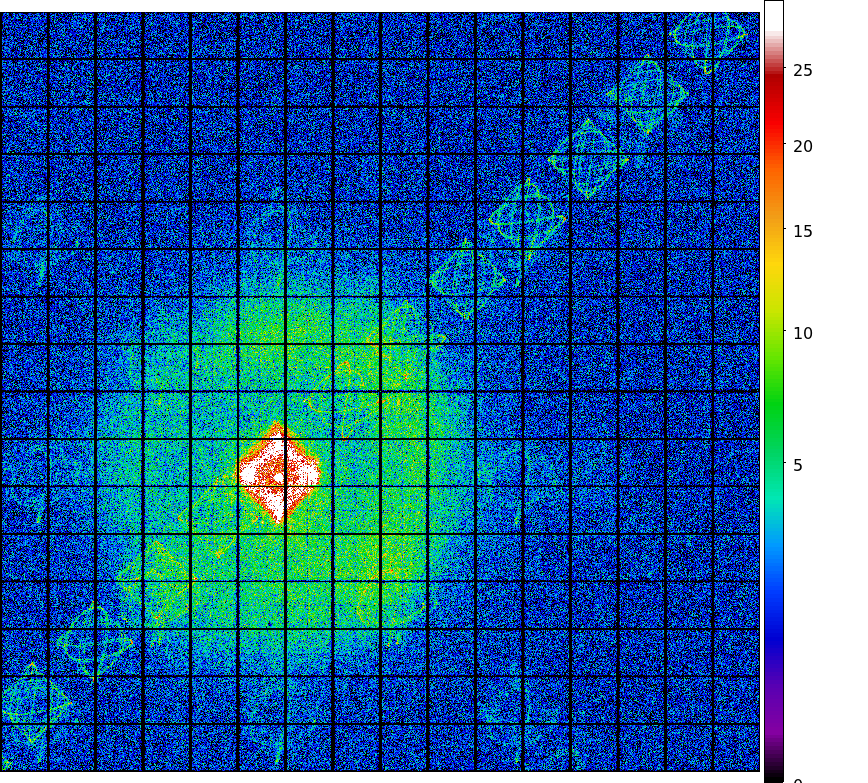
The steps we took to compute the dose map are;
Please check more detail plots at Telemetered Photon Dose Trend page.
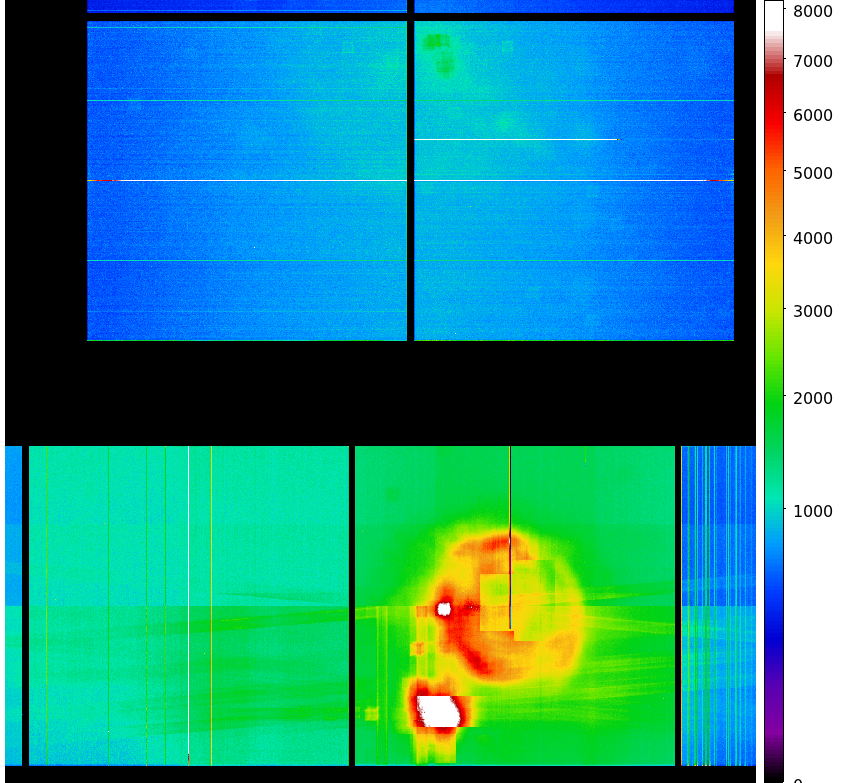
Statistics:
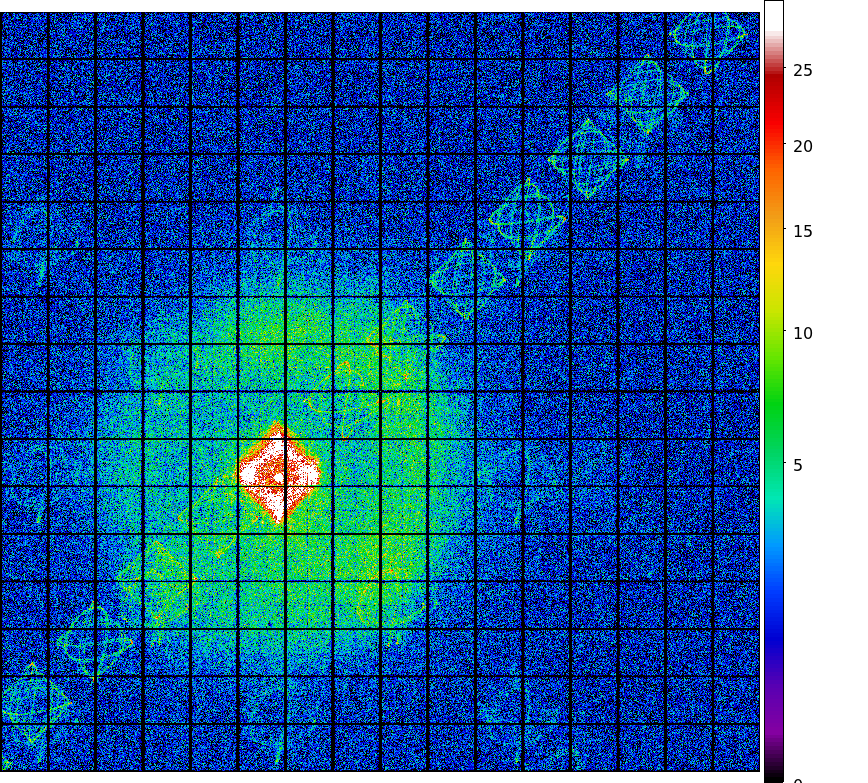
# IMAGE     NPIX        MEAN           RMS              MIN     MAX
ACIS_mar07 6004901      8.176          11.861           0.0     717.0

 I2 node 0  262654      8.636616        3.474134        0.0      48.0
 I2 node 1  262654      9.282087        3.980772        0.0     299.0
 I2 node 2  262654      9.478279        4.423496        0.0      93.0
 I2 node 3  262654      8.893683        3.747700        0.0      48.0

 I3 node 0  262654      9.222509        3.620935        0.0      46.0
 I3 node 1  262654      11.853909       15.633994       0.0     336.0
 I3 node 2  262654      9.680249        3.879477        0.0      41.0
 I3 node 3  262654      8.830383        3.549994        0.0     137.0

 I2 node 0  262654      14.769466       4.545481        0.0      67.0
 I2 node 1  262654      15.248759       5.395276        1.0      92.0
 I2 node 2  262654      16.366333       4.950773        1.0     126.0
 I2 node 3  262654      15.400348       4.425534        2.0     476.0

 I3 node 0  262654      15.749674       7.579724        0.0     159.0
 I3 node 1  262654      17.885831       6.709902        0.0     127.0
 I3 node 2  262654      17.430917       5.427593        0.0     159.0
 I3 node 3  262654      15.938025       4.774795        1.0     110.0
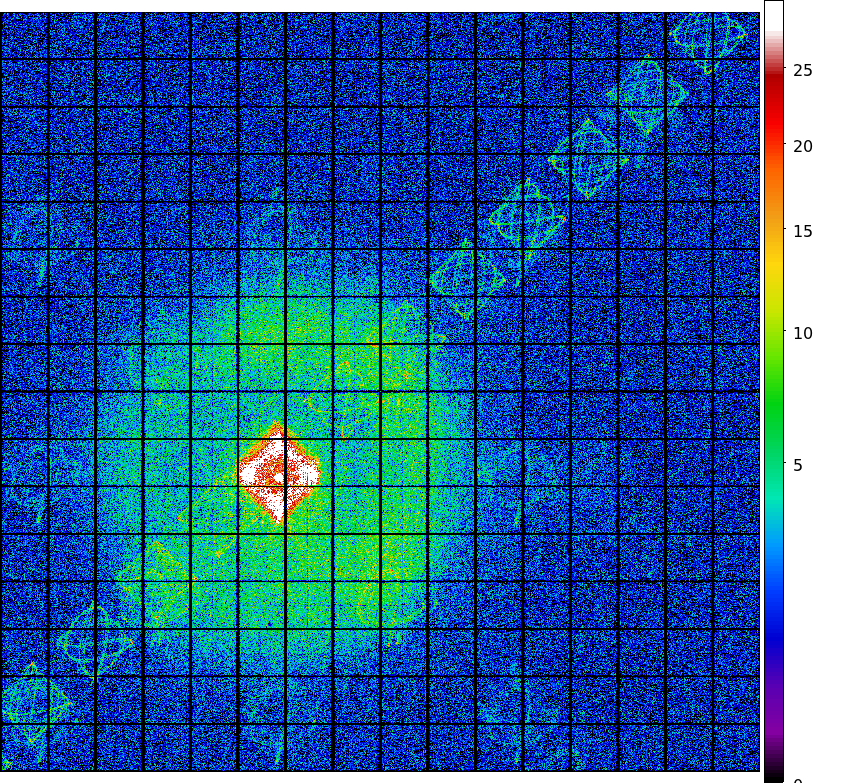
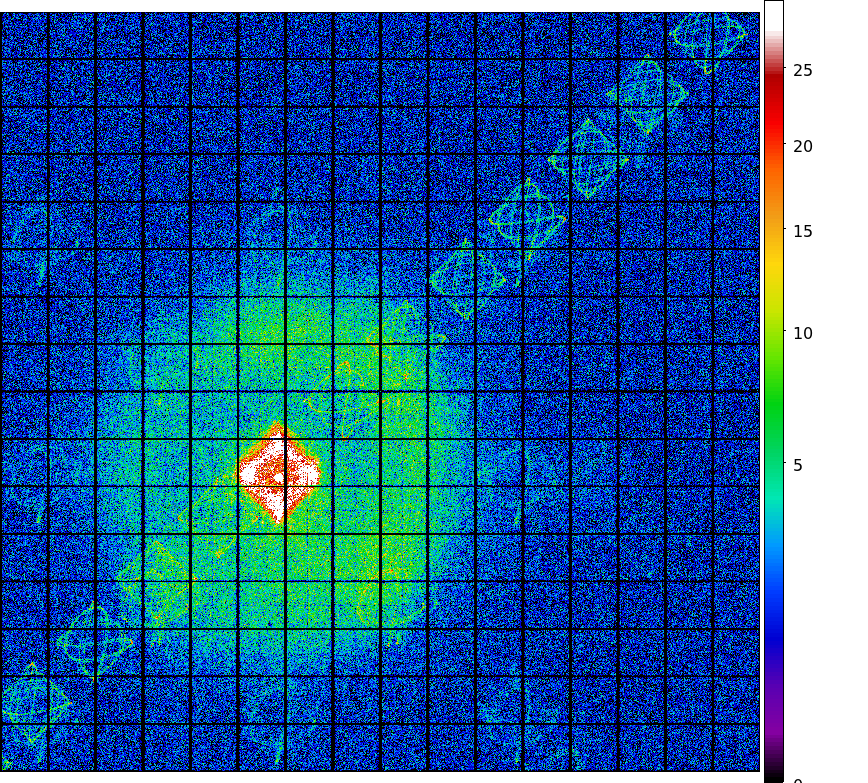
Statistics:
 IMAGE        NPIX      MEAN          RMS              MIN    MAX
ACIS_total  6004901   995.90        1379.86            0.0   58955.0

2 node 0  262654      716.585602      125.951823      0.0     2960.0
 I2 node 1  262654      756.770136      172.617320      0.0     8706.0
 I2 node 2  262654      769.463131      145.176414      0.0     2759.0
 I2 node 3  262654      773.786172      184.277364      0.0     3609.0

 I3 node 0  262654      821.904045      207.913102      0.0     4954.0
 I3 node 1  262654      845.439163      574.658931      0.0     15469.0
 I3 node 2  262654      753.976400      125.712342      0.0     3058.0
 I3 node 3  262654      744.455429      135.688158      0.0     13780.0

 I2 node 0  262654      1154.365533     143.772695      543.0   12552.0
 I2 node 1  262654      1226.843052     248.587167      578.0   6037.0
 I2 node 2  262654      1390.022262     279.278456      767.0   9366.0
 I2 node 3  262654      1347.907289     220.290362      771.0   12388.0

 I3 node 0  262654      2217.950954     1220.852418     843.0   10490.0
 I3 node 1  262654      3383.267873     1745.702020     0.0     11507.0
 I3 node 2  262654      2387.363948     765.833830      702.0   4950.0
 I3 node 3  262654      1759.048137     299.710581      888.0   7361.0
|
|
|
|
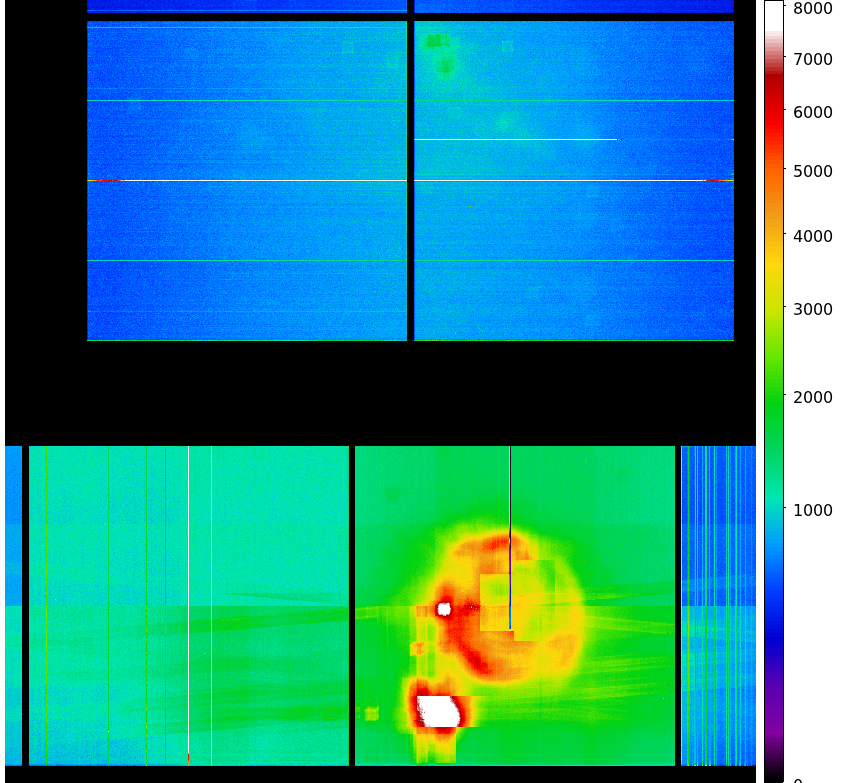
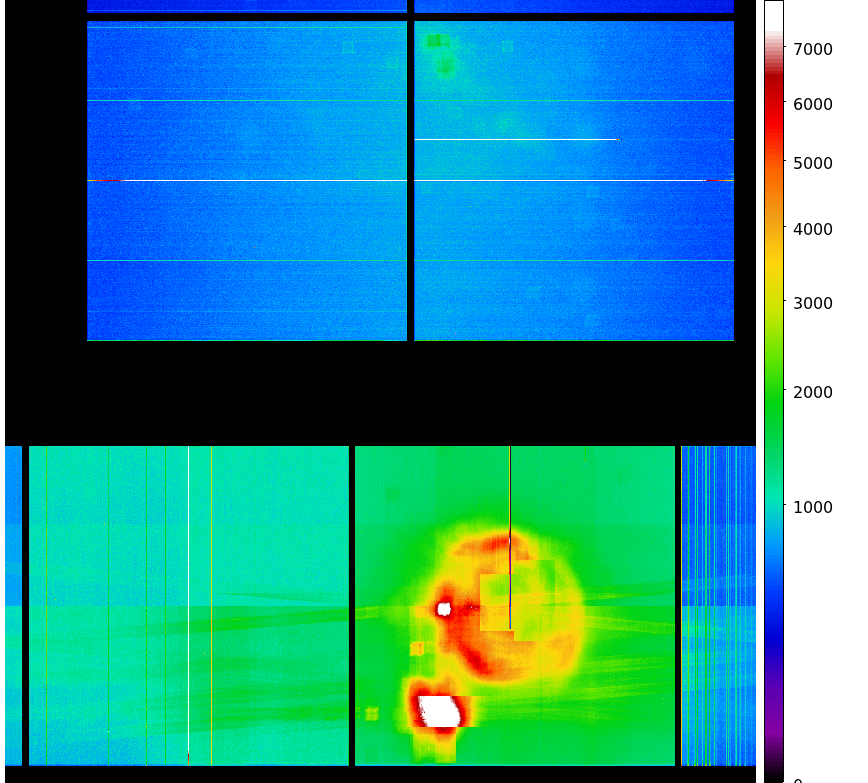
| Dec 2006 | Sep 2006 | Jun 2006 | Mar 2006 |
|---|
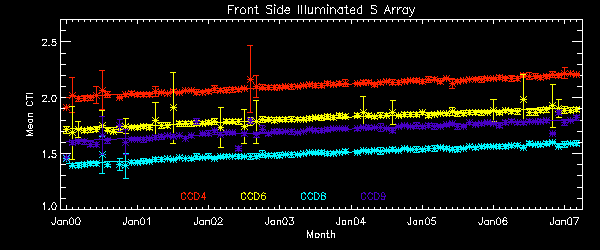
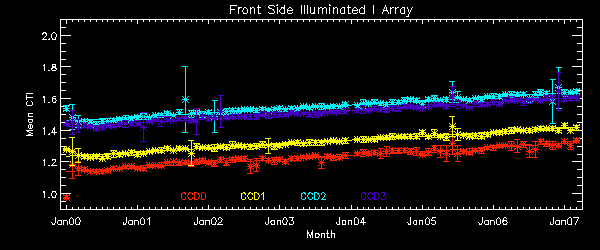
We report CTIs with a refined data definition. CTIs were computed for the temperature
dependency corrected data.
Please see
CTI page
for detailed explanation.
CTI's are computed for Mn K alpha, and defined as slope/intercept x10^4 of row # vs ADU.
Data file here

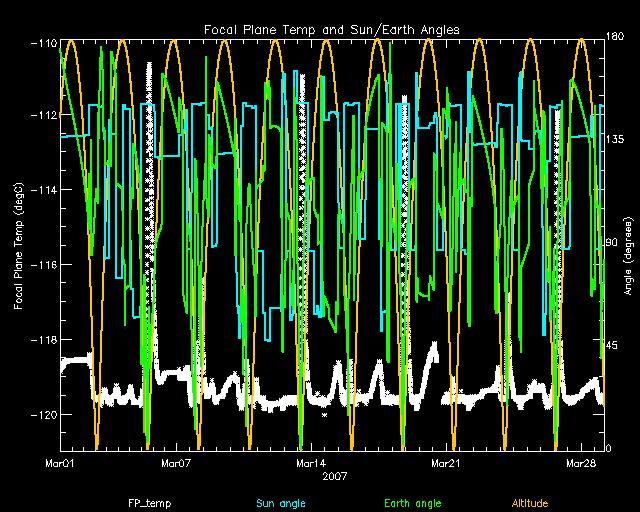
       The Mean (max) FPT: -116.97 C    std dev: 3.11
               mean width:    0.56 days std dev: 0.42
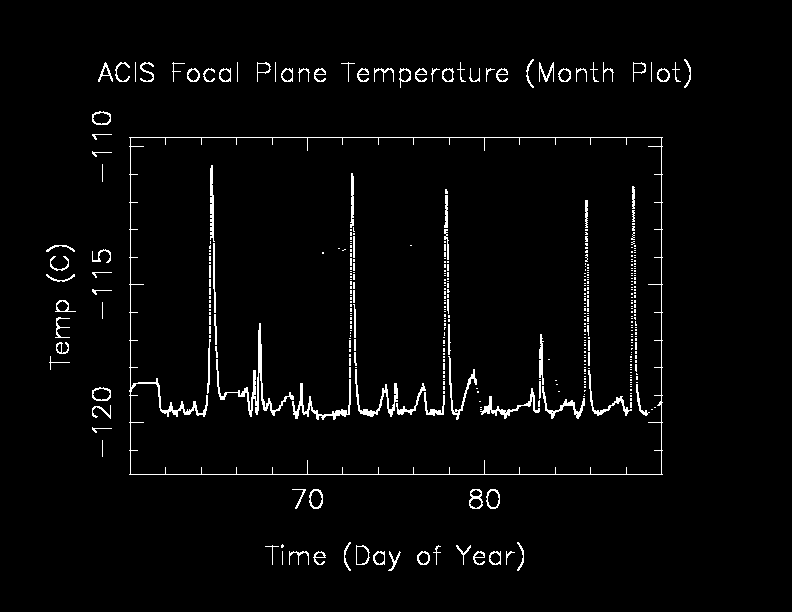

The following is a plot of focal plane temperature and sun angle, earth angle, and altitude.
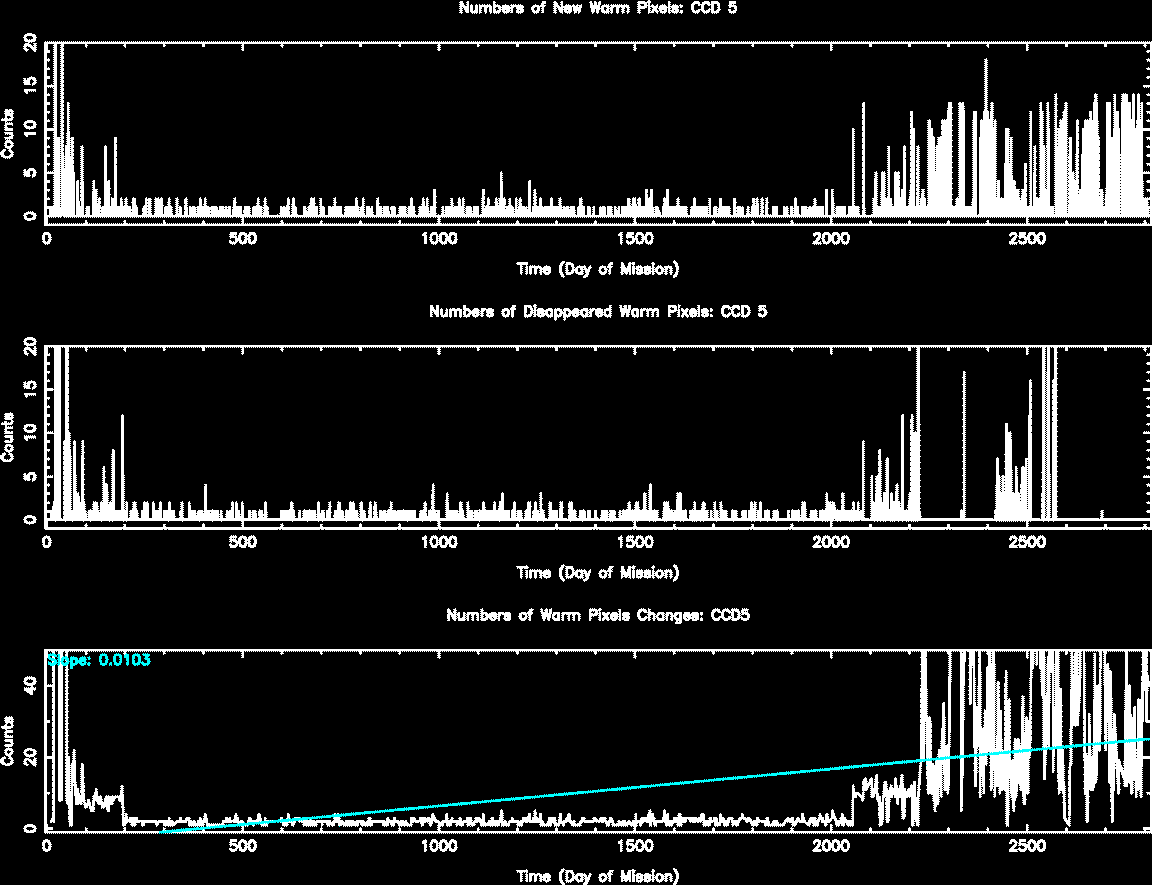
The plots below were generated with a new warm pixel finding script. Please see Acis Bad Pixel Page for details.
Front Side CCDs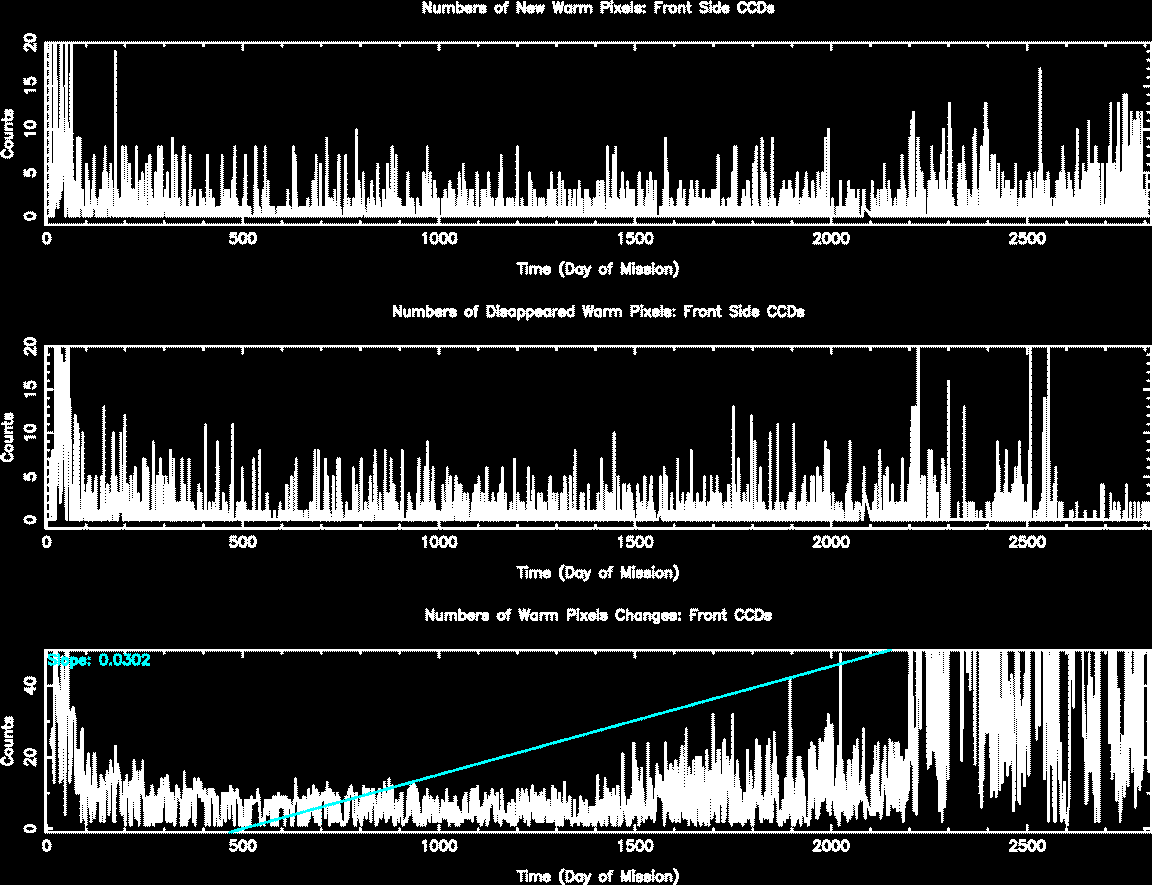
Back Side CCD (CCD5)
| Name | Low (keV) | High(KeV) | Description |
|---|---|---|---|
| SSoft | 0.00 | 0.50 | Super soft photons |
| Soft | 0.50 | 1.00 | Soft photons |
| Med | 1.00 | 3.00 | Moderate energy photons |
| Hard | 3.00 | 5.00 | Hard Photons |
| Harder | 5.00 | 10.00 | Very Hard photons |
| Hardest | 10.00 | Beyond 10 keV |
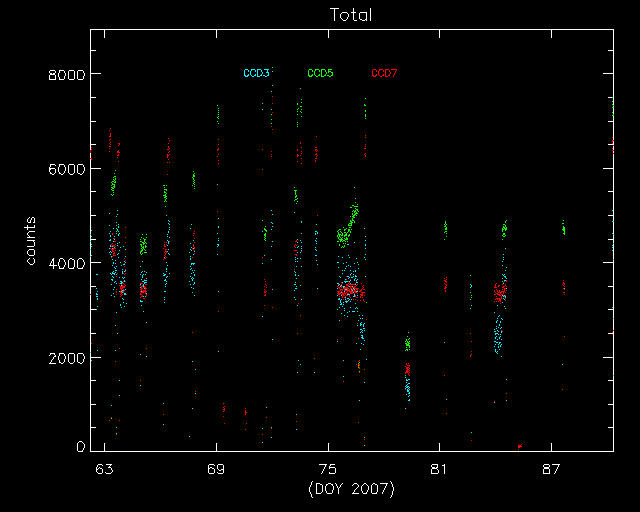
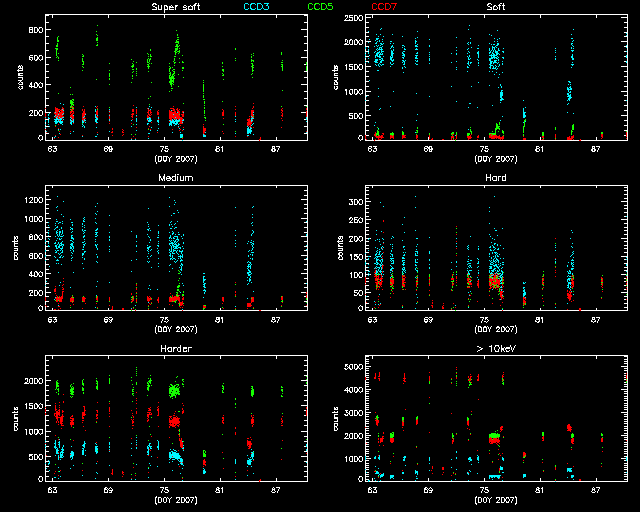
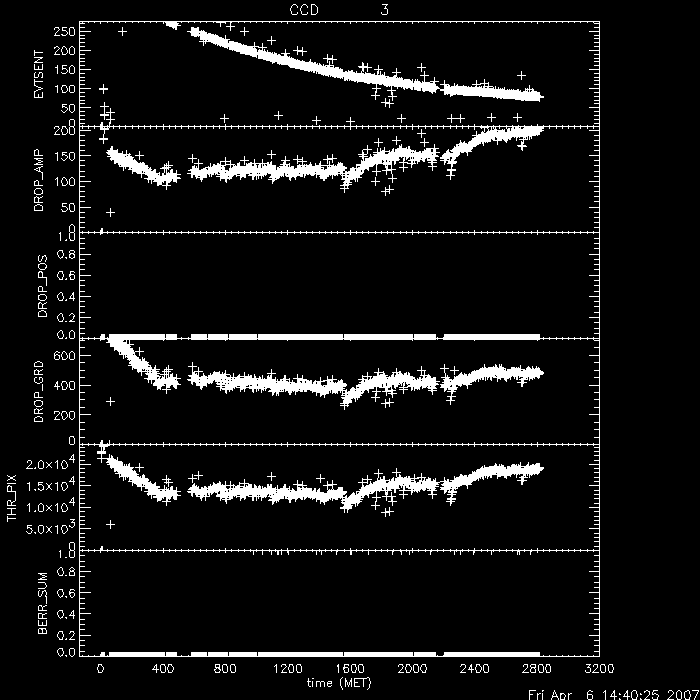
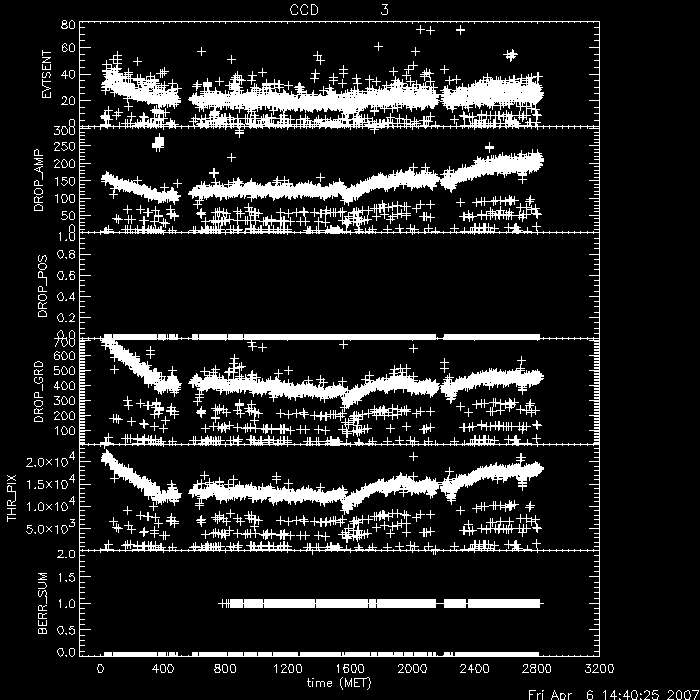
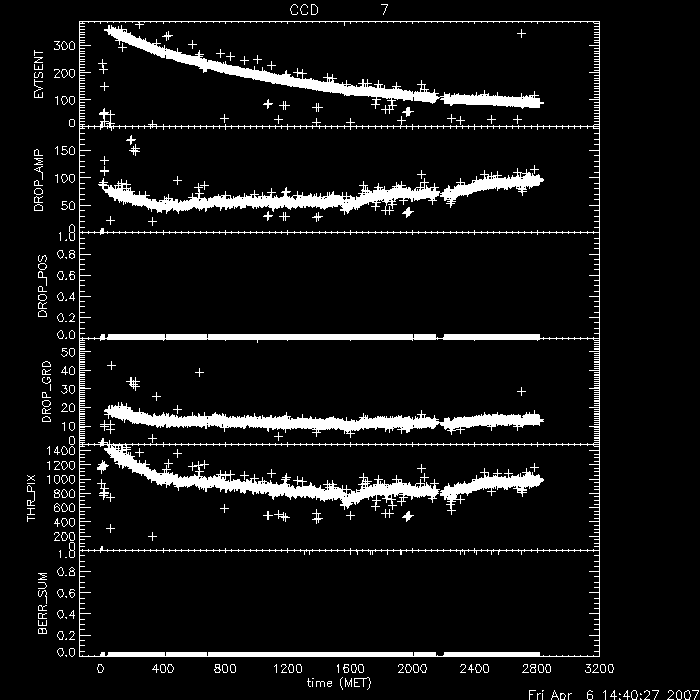
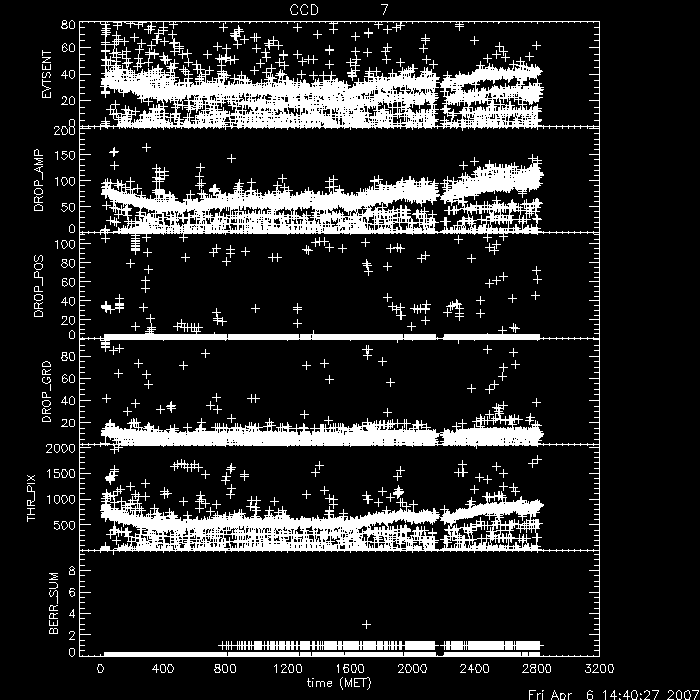
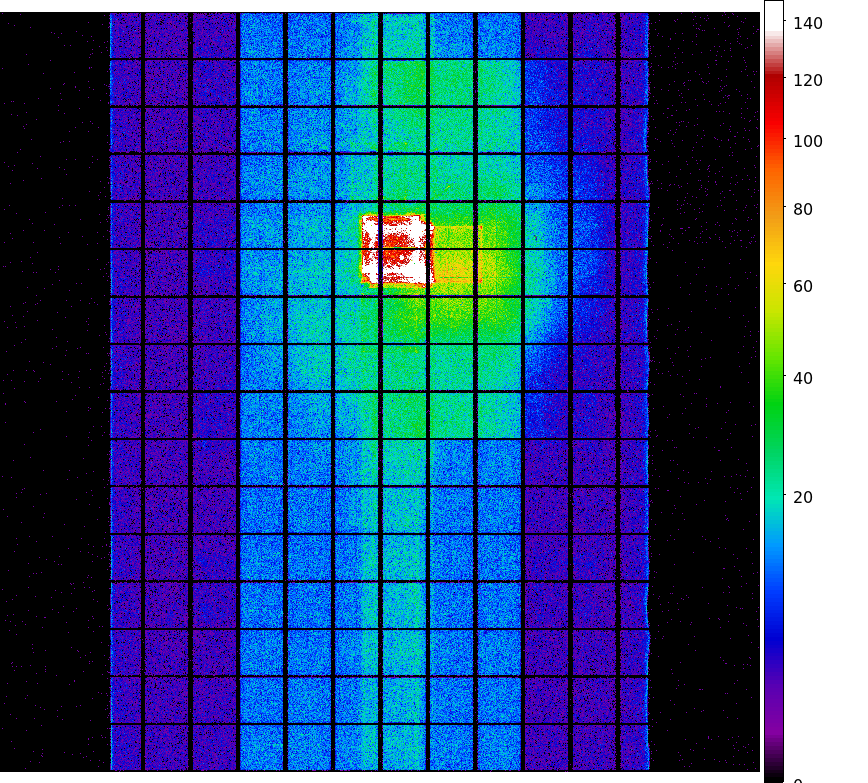
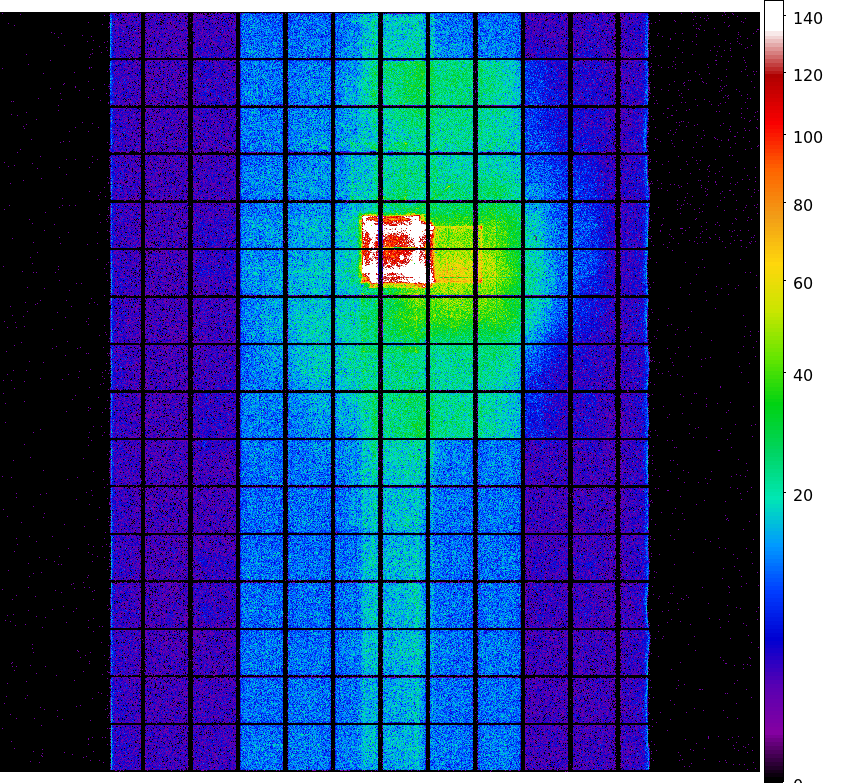
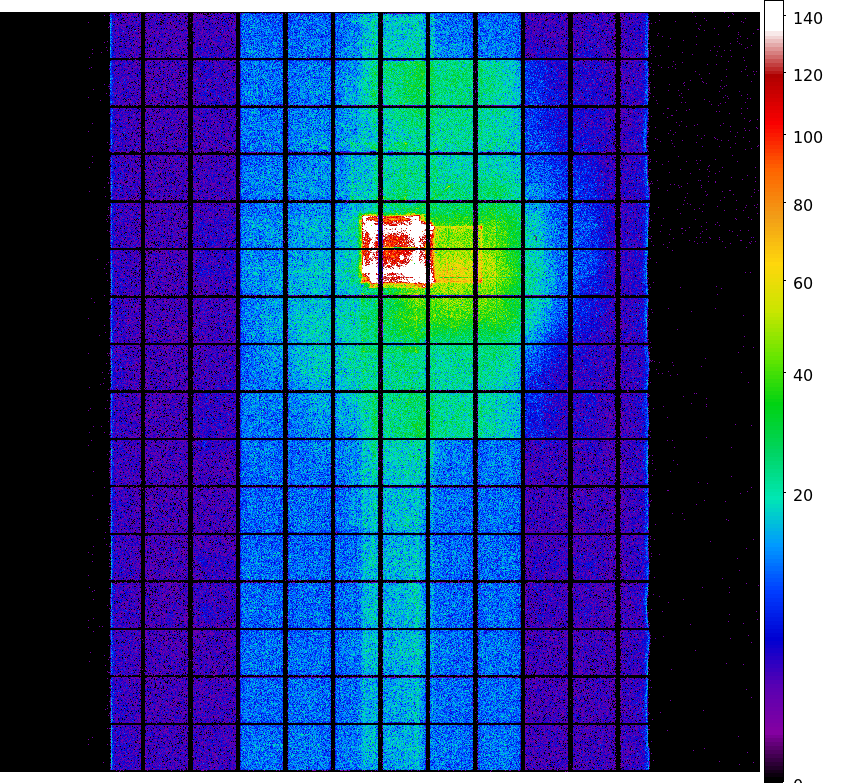
        IMAGE                NPIX      MEAN    STDDEV      MIN       MAX
HRCI_03_2007.fits          16777216   0.040    0.210       0.0       10.0
        IMAGE                NPIX      MEAN    STDDEV      MIN       MAX
HRCI_08_1999_03_2007.fits  16777216   2.319    3.401       0.0       288.0
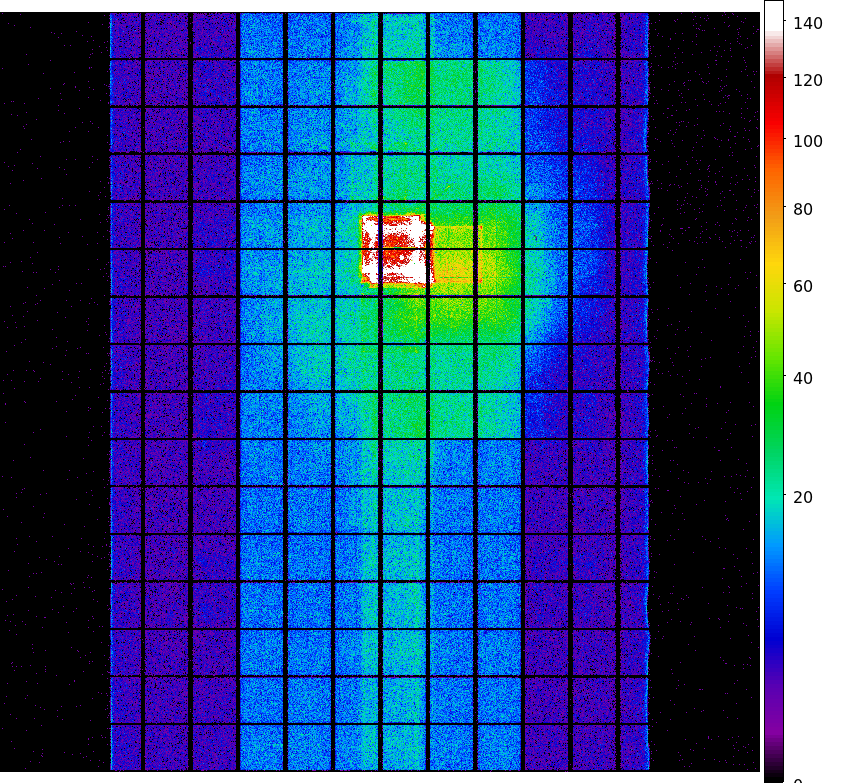
        IMAGE                NPIX      MEAN    STDDEV      MIN       MAX
HRCS_03_2007.fits          16777216   0.020    0.249       0.0       42.0
        IMAGE                NPIX     MEAN      STDDEV      MIN      MAX
HRCS_08_1999_03_2007.fits  16777216  7.765     15.533       0.0      1533.0
We display a max dose trend plot corrected for events that "pile-up" in the center of the taps due to bad position information.

|
|
|
|
| Dec 2006 | Sep 2006 | Jun 2006 | Mar 2006 |
|---|
|
|
|
|
| Dec 2006 | Sep 2006 | Jun 2006 | Mar 2006 |
|---|

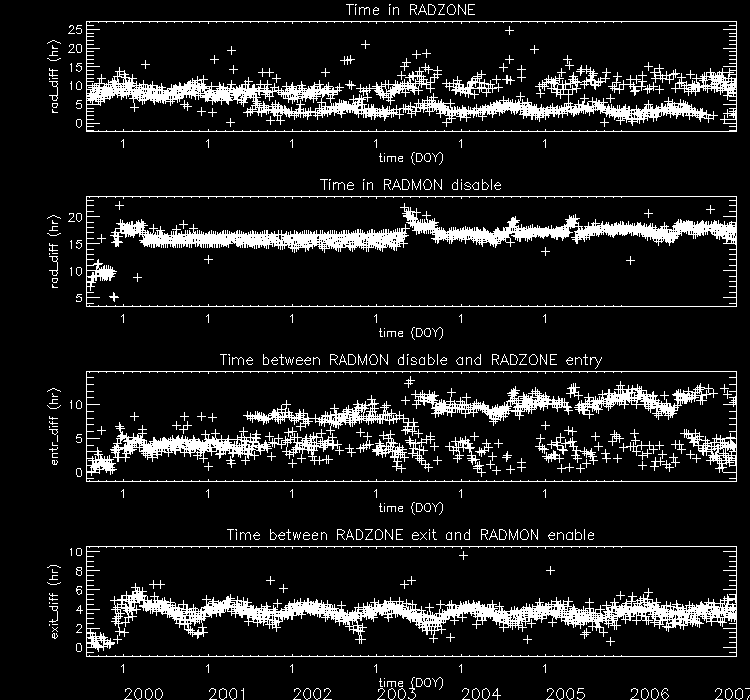
| Previous Quarter | ||||||
| MSID | MEAN | RMS | DELTA/YR | DELTA/YR/YR | UNITS | DESCRIPTION |
| 1CRAT | 146.47 | 1.68 | -2.601e+00 | 8.204e+00 | K | COLD RADIATOR TEMP. A |
| 1CRBT | 147.31 | 1.76 | -1.976e+00 | 7.634e+00 | K | COLD RADIATOR TEMP. B |
| 1DEAMZT | 283.98 | 2.43 | -3.540e+00 | 1.008e+01 | K | DEA -Z PANEL TEMP |
| 1DPAMYT | 285.90 | 3.23 | -1.903e+00 | 2.696e+01 | K | DPA -Y PANEL TEMP |
| 1DPAMZT | 288.90 | 2.98 | -1.753e+00 | 5.756e+00 | K | DPA -Z PANEL TEMP |
| Previous Quarter | ||||||
| MSID | MEAN | RMS | DELTA/YR | DELTA/YR/YR | UNITS | DESCRIPTION |
| 5EIOT | 339.12 | 12.78 | 8.472e+00 | 1.808e+02 | K | EIO TEMP |
| 5EPHINT | 311.89 | 3.67 | -5.319e-01 | 1.678e+02 | K | EPHIN TEMP |
| HKEBOXTEMP | 316.31 | 3.70 | -4.110e-01 | 1.600e+02 | K | EPHIN HOUSEKEEPING EBOX: TEMPERATURE (5EHSE300) |
| HKP27I | 7.52 | 0.38 | 3.280e-01 | 2.171e+01 | AMP | HK 27 Volts Rail - Current |
| HKP27V | 14.26 | 3.80 | -3.120e+00 | -1.768e+02 | V | HK 27 Volts Rail - Voltage |
| TEIO | 310.72 | 14.55 | 8.074e+00 | 1.920e+02 | K | EPHIN ELECTRONICS HOUSING TEMP |
| TEPHIN | 311.69 | 3.88 | -3.048e-02 | 1.467e+02 | K | EPHIN SENSOR HOUSING TEMP |
| Previous Quarter | ||||||
| MSID | MEAN | RMS | DELTA/YR | DELTA/YR/YR | UNITS | DESCRIPTION |
| TFSSBKT1 | 324.37 | 14.34 | 1.174e+00 | 1.476e+02 | K | FSS BRACKET-1 TEMP (+Y) |
| TFSSBKT2 | 317.66 | 19.15 | 1.339e+00 | 2.774e+02 | K | FSS BRACKET-2 TEMP (+Y) |
| TMYHNG | 209.72 | 6.39 | 3.381e+00 | -3.103e+02 | K | SUNSHADE DOOR HINGE BEAM TEMP (-Y SIDE) |
| TSCIUSF1 | 286.77 | 27.50 | 3.801e+01 | -1.090e+03 | K | SC-IUS FITTING-1 TEMP |
| TSCIUSF8 | 281.01 | 29.55 | 4.165e+01 | -1.080e+03 | K | SC-IUS FITTING-8 TEMP |
| Previous Quarter | ||||||
| MSID | MEAN | RMS | DELTA/YR | DELTA/YR/YR | UNITS | DESCRIPTION |
| OOBTHR36 | 283.22 | 1.341e-02 | 7.794e-02 | -3.619e-02 | K | RT 58: TFTE CONE |
| OOBTHR42 | 263.51 | 2.286e-02 | -9.381e-02 | 1.703e-01 | K | RT 64: TFTE COVER |
| OOBTHR45 | 289.59 | 0.57 | 1.970e-02 | 5.899e+01 | K | RT 67: TFTE COVER |
| Previous Quarter | ||||||
| MSID | MEAN | RMS | DELTA/YR | DELTA/YR/YR | UNITS | DESCRIPTION |
| OHRTHR05 | 294.71 | 1.776e-03 | -1.092e-02 | 9.032e-04 | K | RT 13: HRMA AFT HEATER PLATE |
| OHRTHR21 | 295.28 | 1.588e-03 | 1.033e-02 | 2.886e-03 | K | RT 3: HRMA FOWARD APERTURE PLATE |
| OHRTHR24 | 294.73 | 1.415e-03 | 1.156e-02 | 8.492e-02 | K | RT 12: HRMA AFT HEATER PLATE |
| OHRTHR34 | 294.26 | 4.082e-03 | 2.979e-02 | 7.101e-02 | K | RT 109: HRMA P1 FLEXURE |
| OHRTHR49 | 294.73 | 1.292e-03 | 1.021e-02 | 6.852e-02 | K | RT 11: HRMA AFT HEATER PLATE |
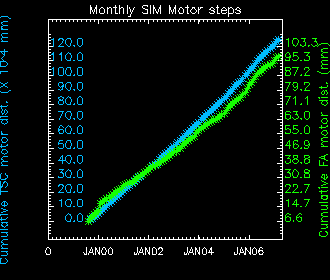
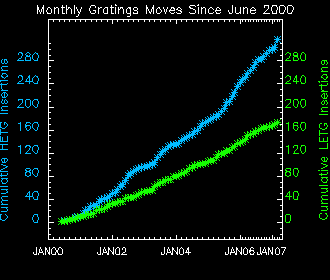
| 
|
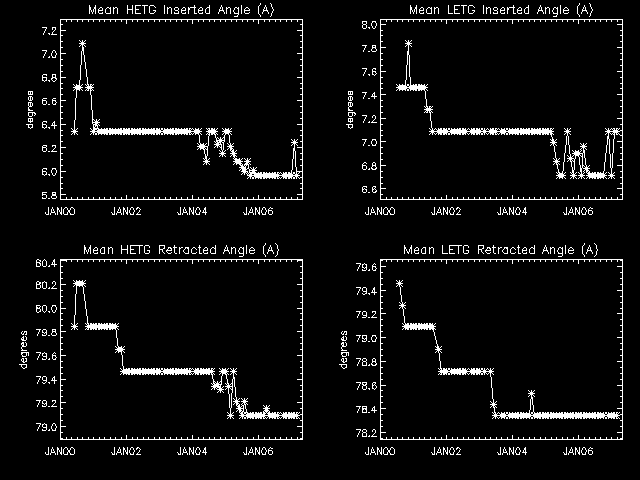

| Year | Month | |||||||||||
|---|---|---|---|---|---|---|---|---|---|---|---|---|
| 1999 | Jul | Aug | Sep | Oct | Nov | Dec | ||||||
| 2000 | Jan | Feb | Mar | Apr | May | Jun | Jul | Aug | Sep | Oct | Nov | Dec |
| 2001 | Jan | Feb | Mar | Apr | May | Jun | Jul | Aug | Sep | Oct | Nov | Dec |
| 2002 | Jan | Feb | Mar | Apr | May | Jun | Jul | Aug | Sep | Oct | Nov | Dec |
| 2003 | Jan | Feb | Mar | Apr | May | Jun | Jul | Aug | Sep | Oct | Nov | Dec |
| 2004 | Jan | Feb | Mar | Apr | May | Jun | Jul | Aug | Sep | Oct | Nov | Dec |
| 2005 | Jan | Feb | Mar | Apr | May | Jun | Jul | Aug | Sep | Oct | Nov | Dec |
| 2006 | Jan | Feb | Mar | Apr | May | Jun | Jul | Aug | Sep | Oct | Nov | Dec |
| 2007 | Jan | Feb | ||||||||||