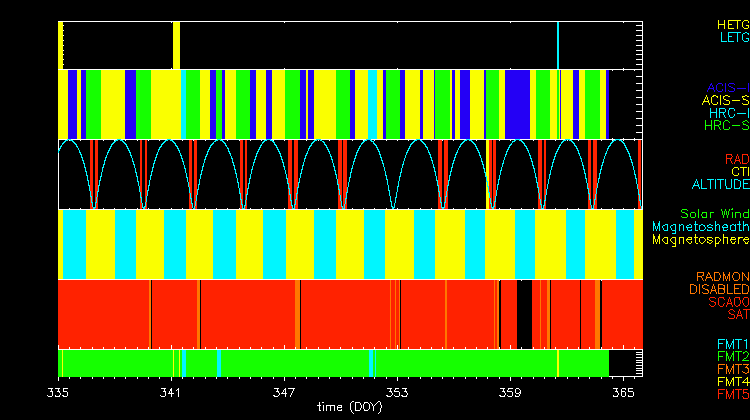

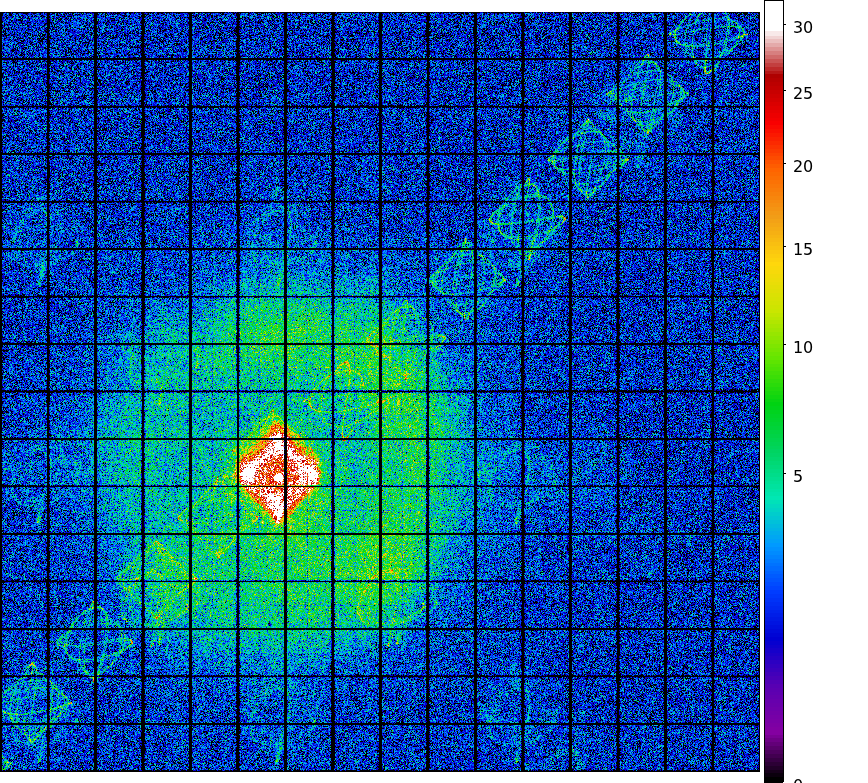
The steps we took to compute the dose map are;
Please check more detail plots at Telemetered Photon Dose Trend page.
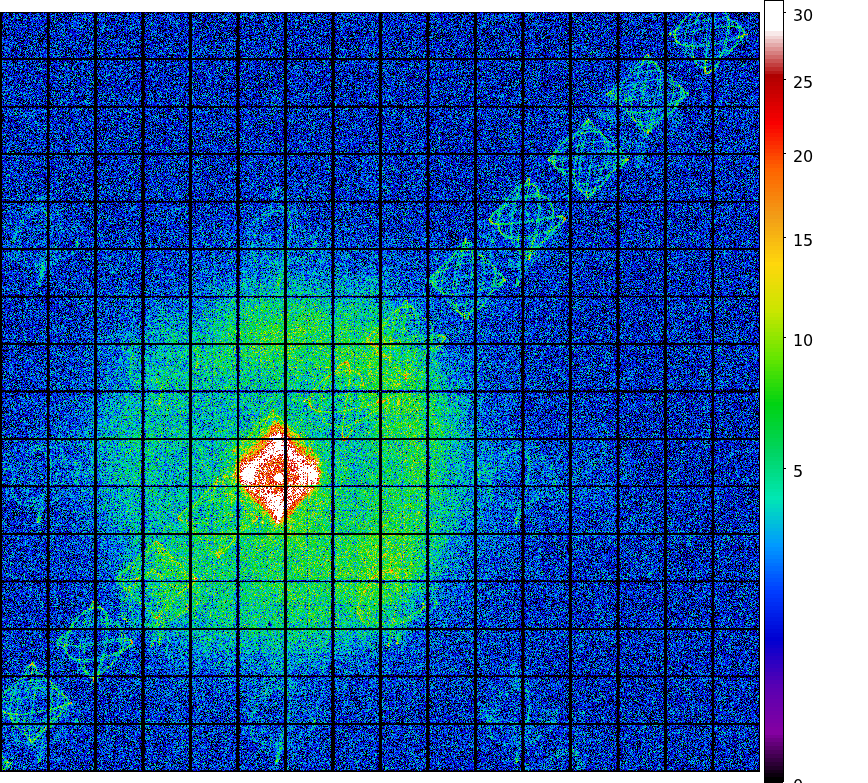
Statistics:
# IMAGE     NPIX        MEAN           RMS              MIN     MAX
ACIS_dec07 6004901      12.6417        21.8462          0.0     876.0

 I2 node 0  262654      11.175213       4.168342        0.0      62.0
 I2 node 1  262654      11.769632       4.810436        0.0     626.0
 I2 node 2  262654      11.710331       4.244708        0.0     153.0
 I2 node 3  262654      11.750616       4.626230        0.0      65.0

 I3 node 0  262654      11.483728       4.258476        0.0      61.0
 I3 node 1  262654      12.258259       12.191776       0.0     281.0
 I3 node 2  262654      11.142369       4.055214        0.0      94.0
 I3 node 3  262654      11.154667       4.164986        0.0     229.0

 S2 node 0  262654      14.061370       4.883097        0.0     580.0
 S2 node 1  262654      14.479326       5.541446        0.0      97.0
 S2 node 2  262654      14.945772       5.122466        0.0     144.0
 S2 node 3  262654      14.379291       4.609726        1.0     516.0

 S3 node 0  262654      17.538695       9.521156        1.0     141.0
 S3 node 1  262654      46.413344       37.162242       0.0     293.0
 S3 node 2  262654      40.553864       39.368495       1.0     270.0
 S3 node 3  262654      14.802945       4.301149        1.0      87.0
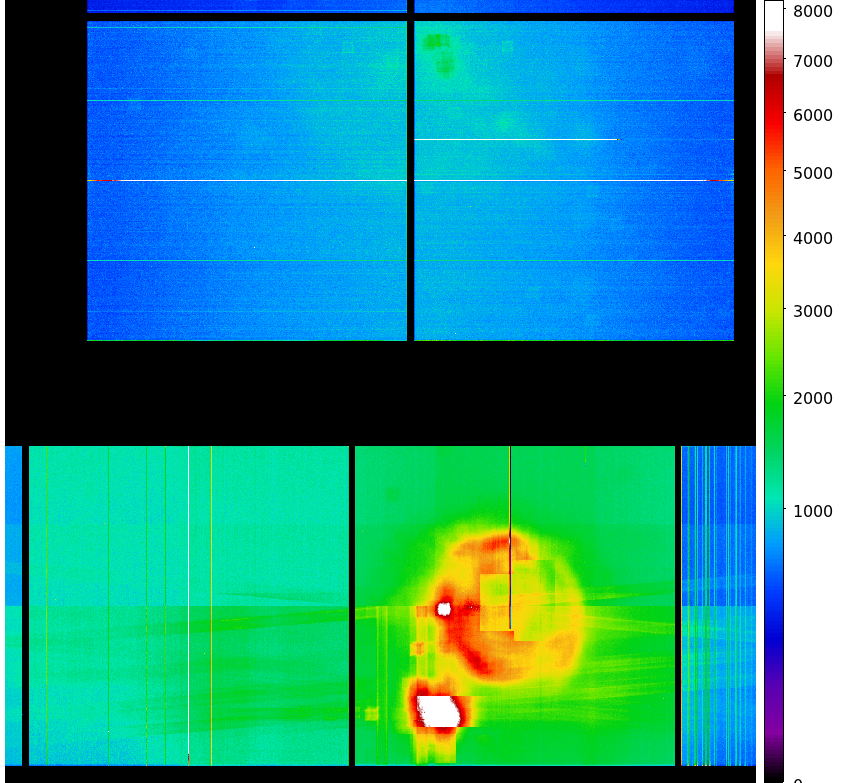
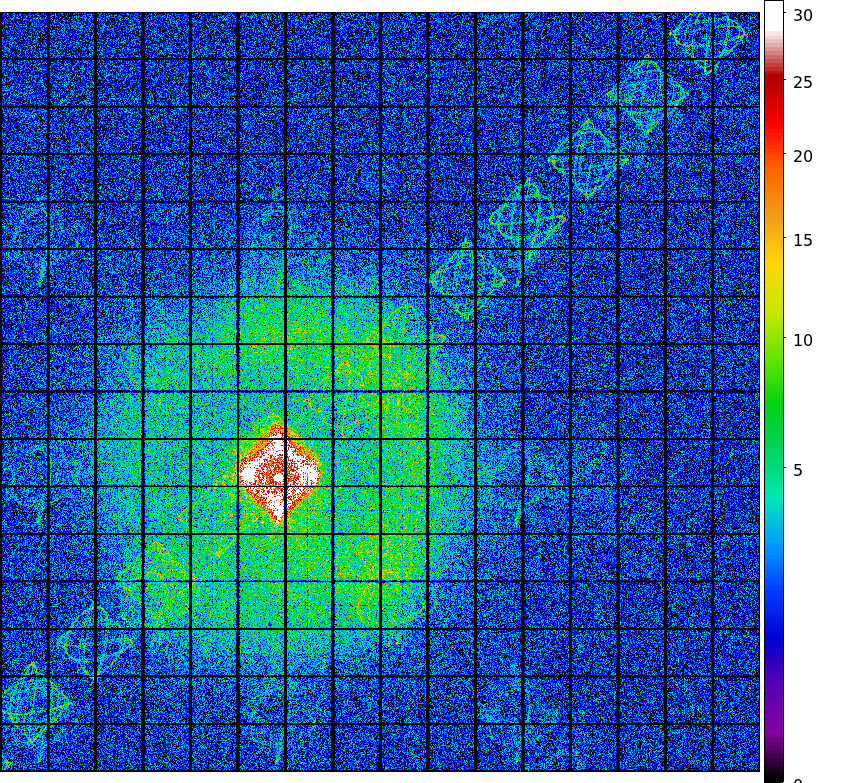
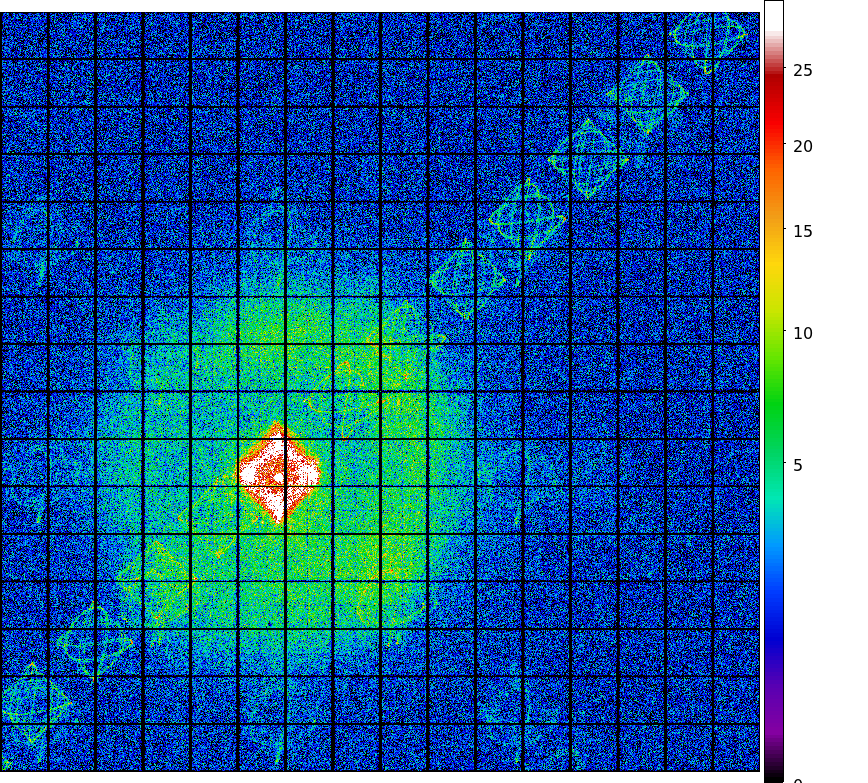
Statistics:
 IMAGE        NPIX      MEAN          RMS              MIN    MAX
ACIS_total  6004901   1094.082      1505.062           0.0   65451.0

 I2 node 0  262654      812.804901      144.272350      0.0     3523.0
 I2 node 1  262654      858.996501      197.520556      0.0     12388.0
 I2 node 2  262654      875.308697      169.089845      0.0     3456.0
 I2 node 3  262654      878.483135      210.984183      0.0     4100.0

 I3 node 0  262654      927.539462      230.272057      0.0     5275.0
 I3 node 1  262654      959.708988      669.699376      0.0     17891.0
 I3 node 2  262654      849.687574      142.761079      0.0     3547.0
 I3 node 3  262654      839.767639      154.357397      0.0     15597.0

 S2 node 0  262654      1284.548434     160.901736      620.0   12760.0
 S2 node 1  262654      1366.565799     278.397617      652.0   6912.0
 S2 node 2  262654      1534.990529     298.244513      861.0   9962.0
 S2 node 3  262654      1486.171506     232.771445      847.0   16800.0

 S3 node 0  262654      2371.473667     1258.965959     936.0   10732.0
 S3 node 1  262654      3573.425552     1771.510782     0.0     11670.0
 S3 node 2  262654      2577.434340     798.536453      808.0   5609.0
 S3 node 3  262654      1907.574786     318.387091      992.0   7794.0
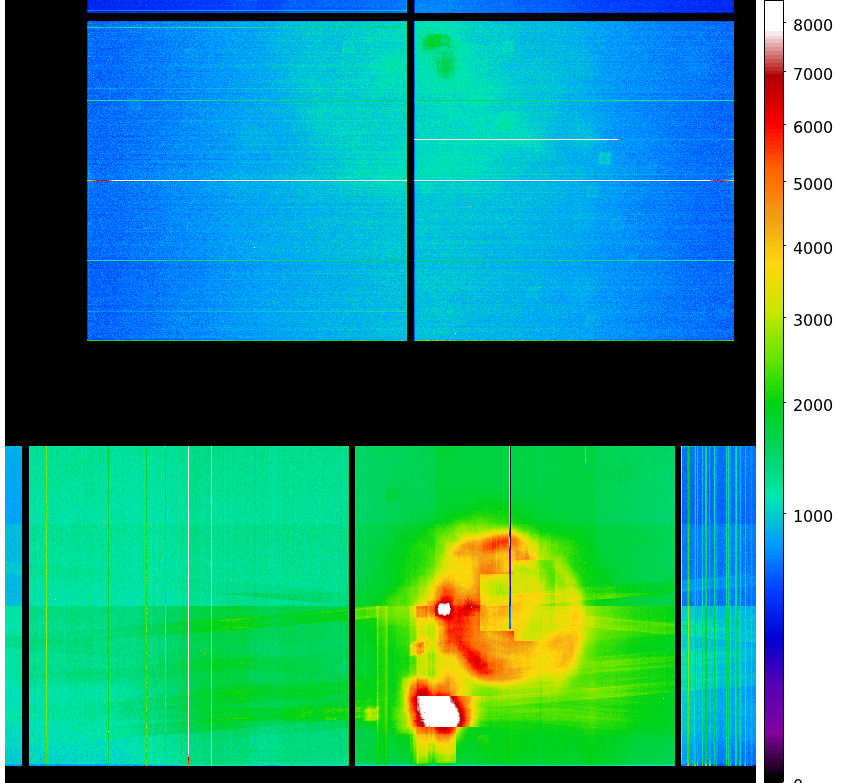
|
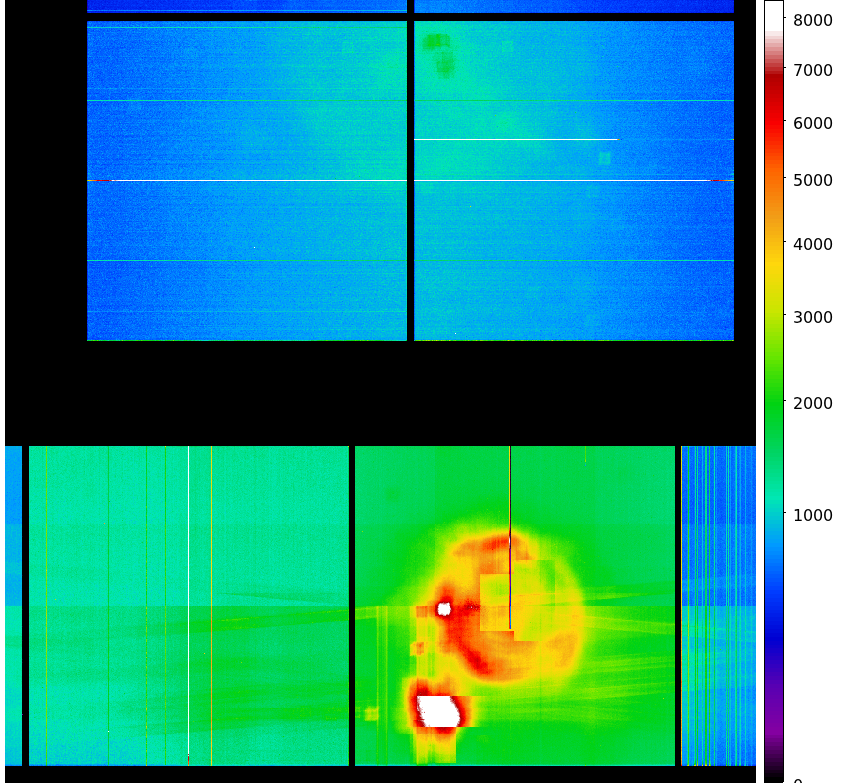
|
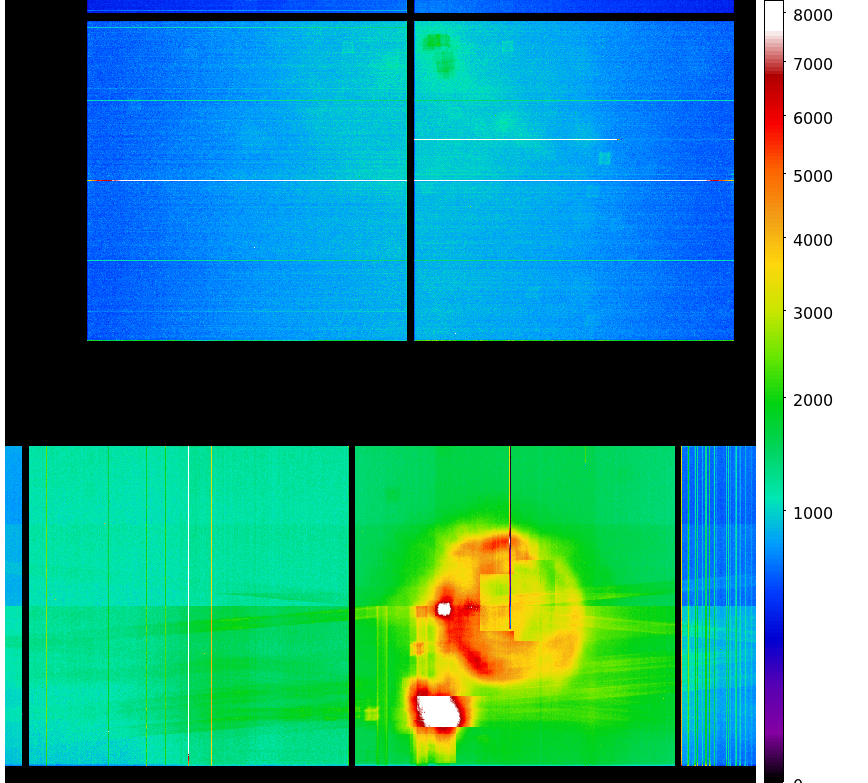
|
|
| Sep 2007 | Jun 2007 | Mar 2007 | Dec 2006 |
|---|
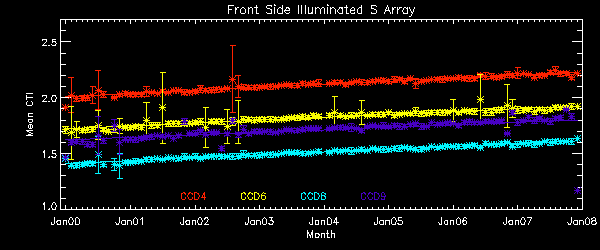
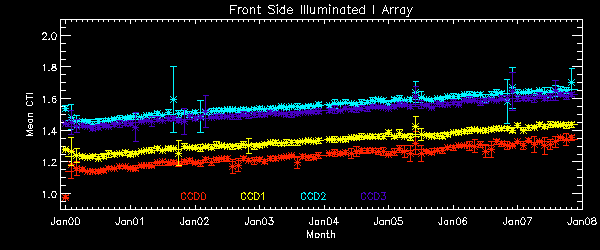
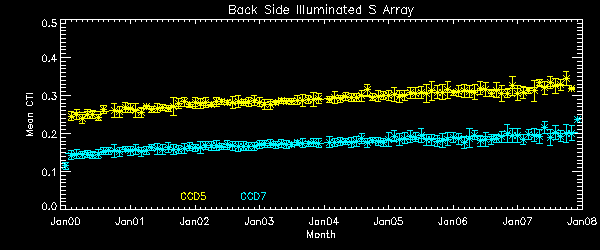
We report CTIs with a refined data definition. CTIs were computed for the temperature
dependency corrected data.
Please see
CTI page
for detailed explanation.
CTI's are computed for Mn K alpha, and defined as slope/intercept x10^4 of row # vs ADU.
Data file here
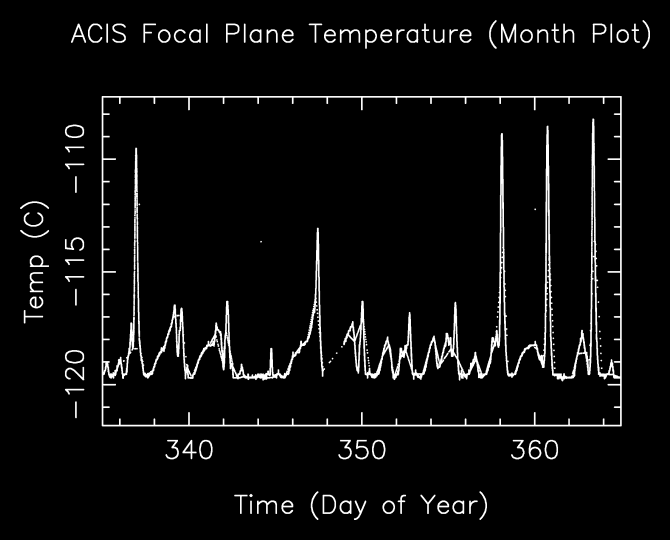
       The Mean (max) FPT: -116.07 C    std dev: 3.52
               mean width:    0.84 days std dev: 0.58

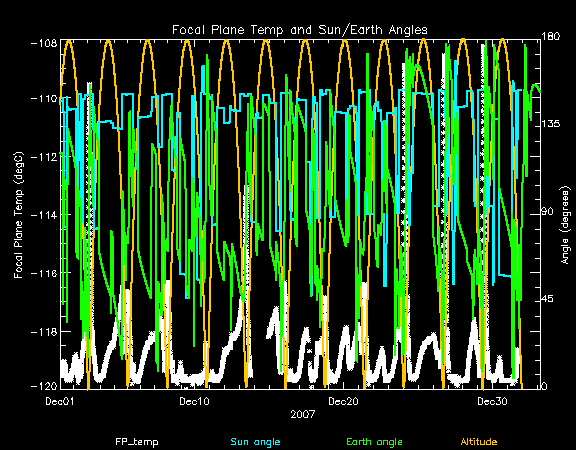
The following is a plot of focal plane temperature and sun angle, earth angle, and altitude.
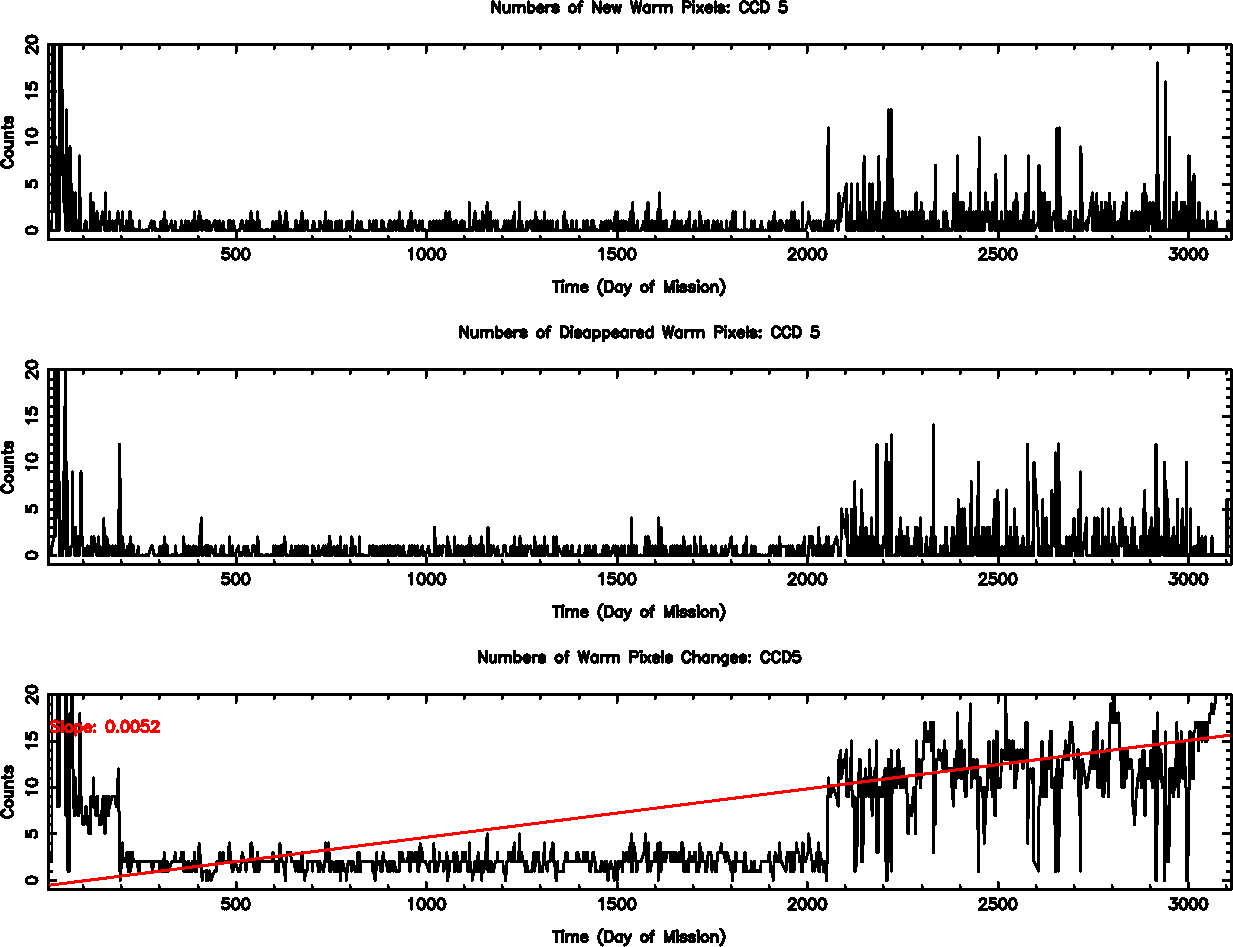
The plots below were generated with a new warm pixel finding script. Please see Acis Bad Pixel Page for details.
Front Side CCDs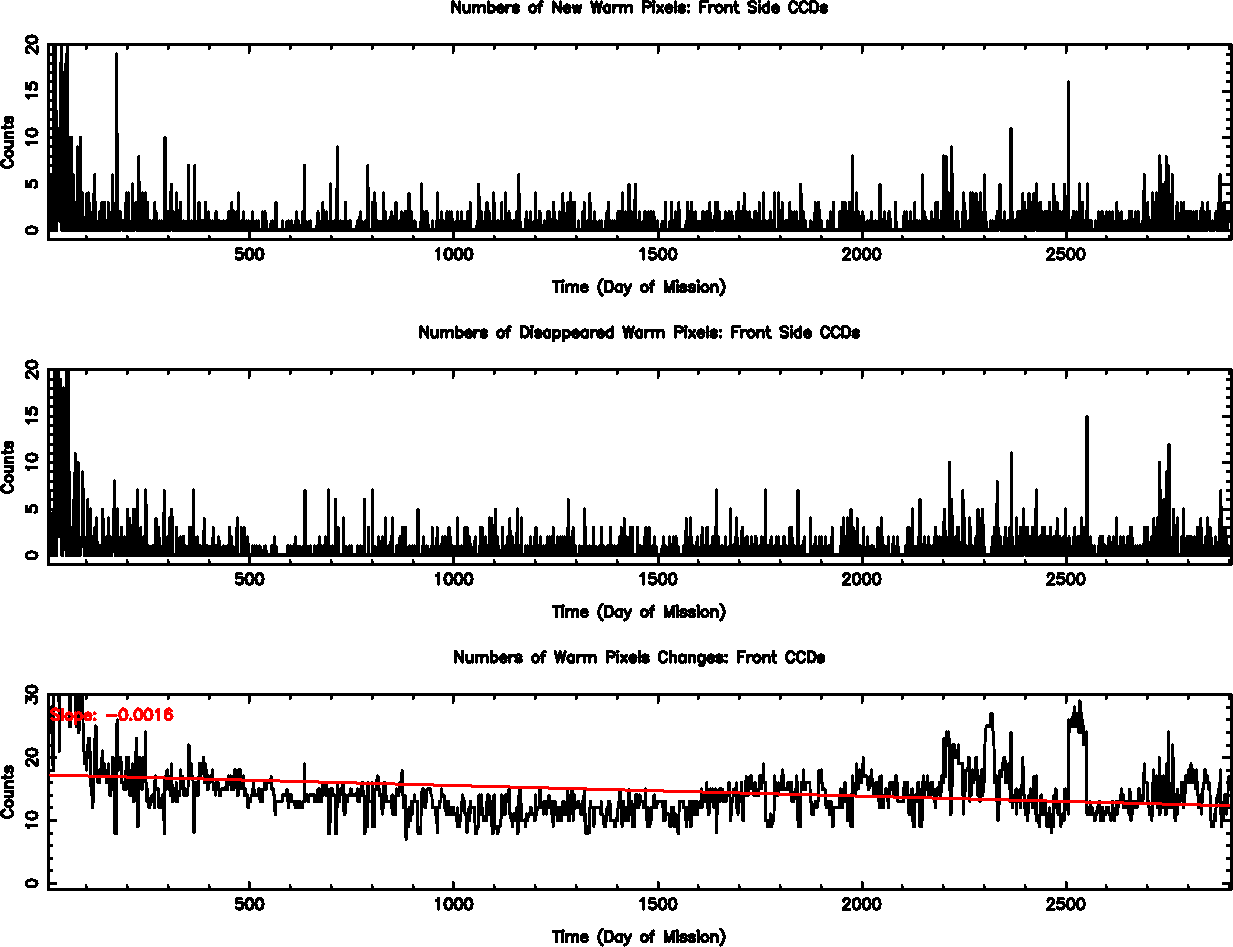
Back Side CCD (CCD5)
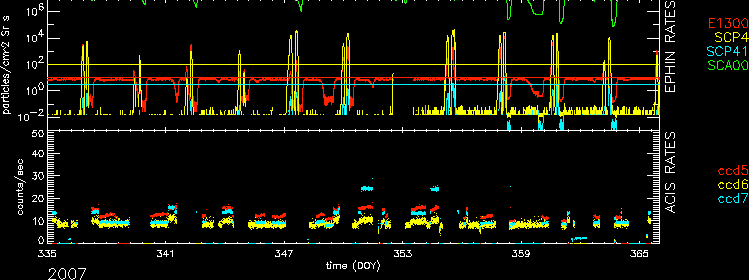
| Name | Low (keV) | High(KeV) | Description |
|---|---|---|---|
| SSoft | 0.00 | 0.50 | Super soft photons |
| Soft | 0.50 | 1.00 | Soft photons |
| Med | 1.00 | 3.00 | Moderate energy photons |
| Hard | 3.00 | 5.00 | Hard Photons |
| Harder | 5.00 | 10.00 | Very Hard photons |
| Hardest | 10.00 | Beyond 10 keV |
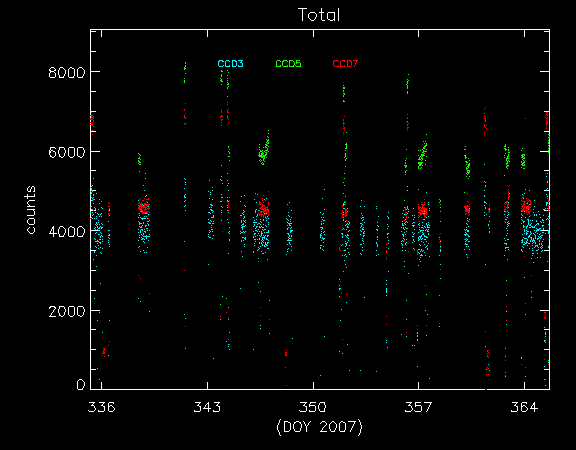
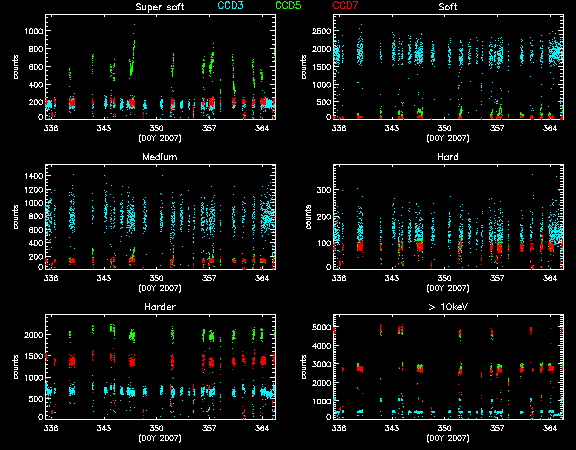
The following three plots show trends of SIB from year 2000. CCDs shown here are CCD3, CCD5, and CCD7. Fitted lines are linear fit after eliminating extreme outliers. For >10 keV plots, 2 lines are fit. One is with a 13 keV filter, and another without.
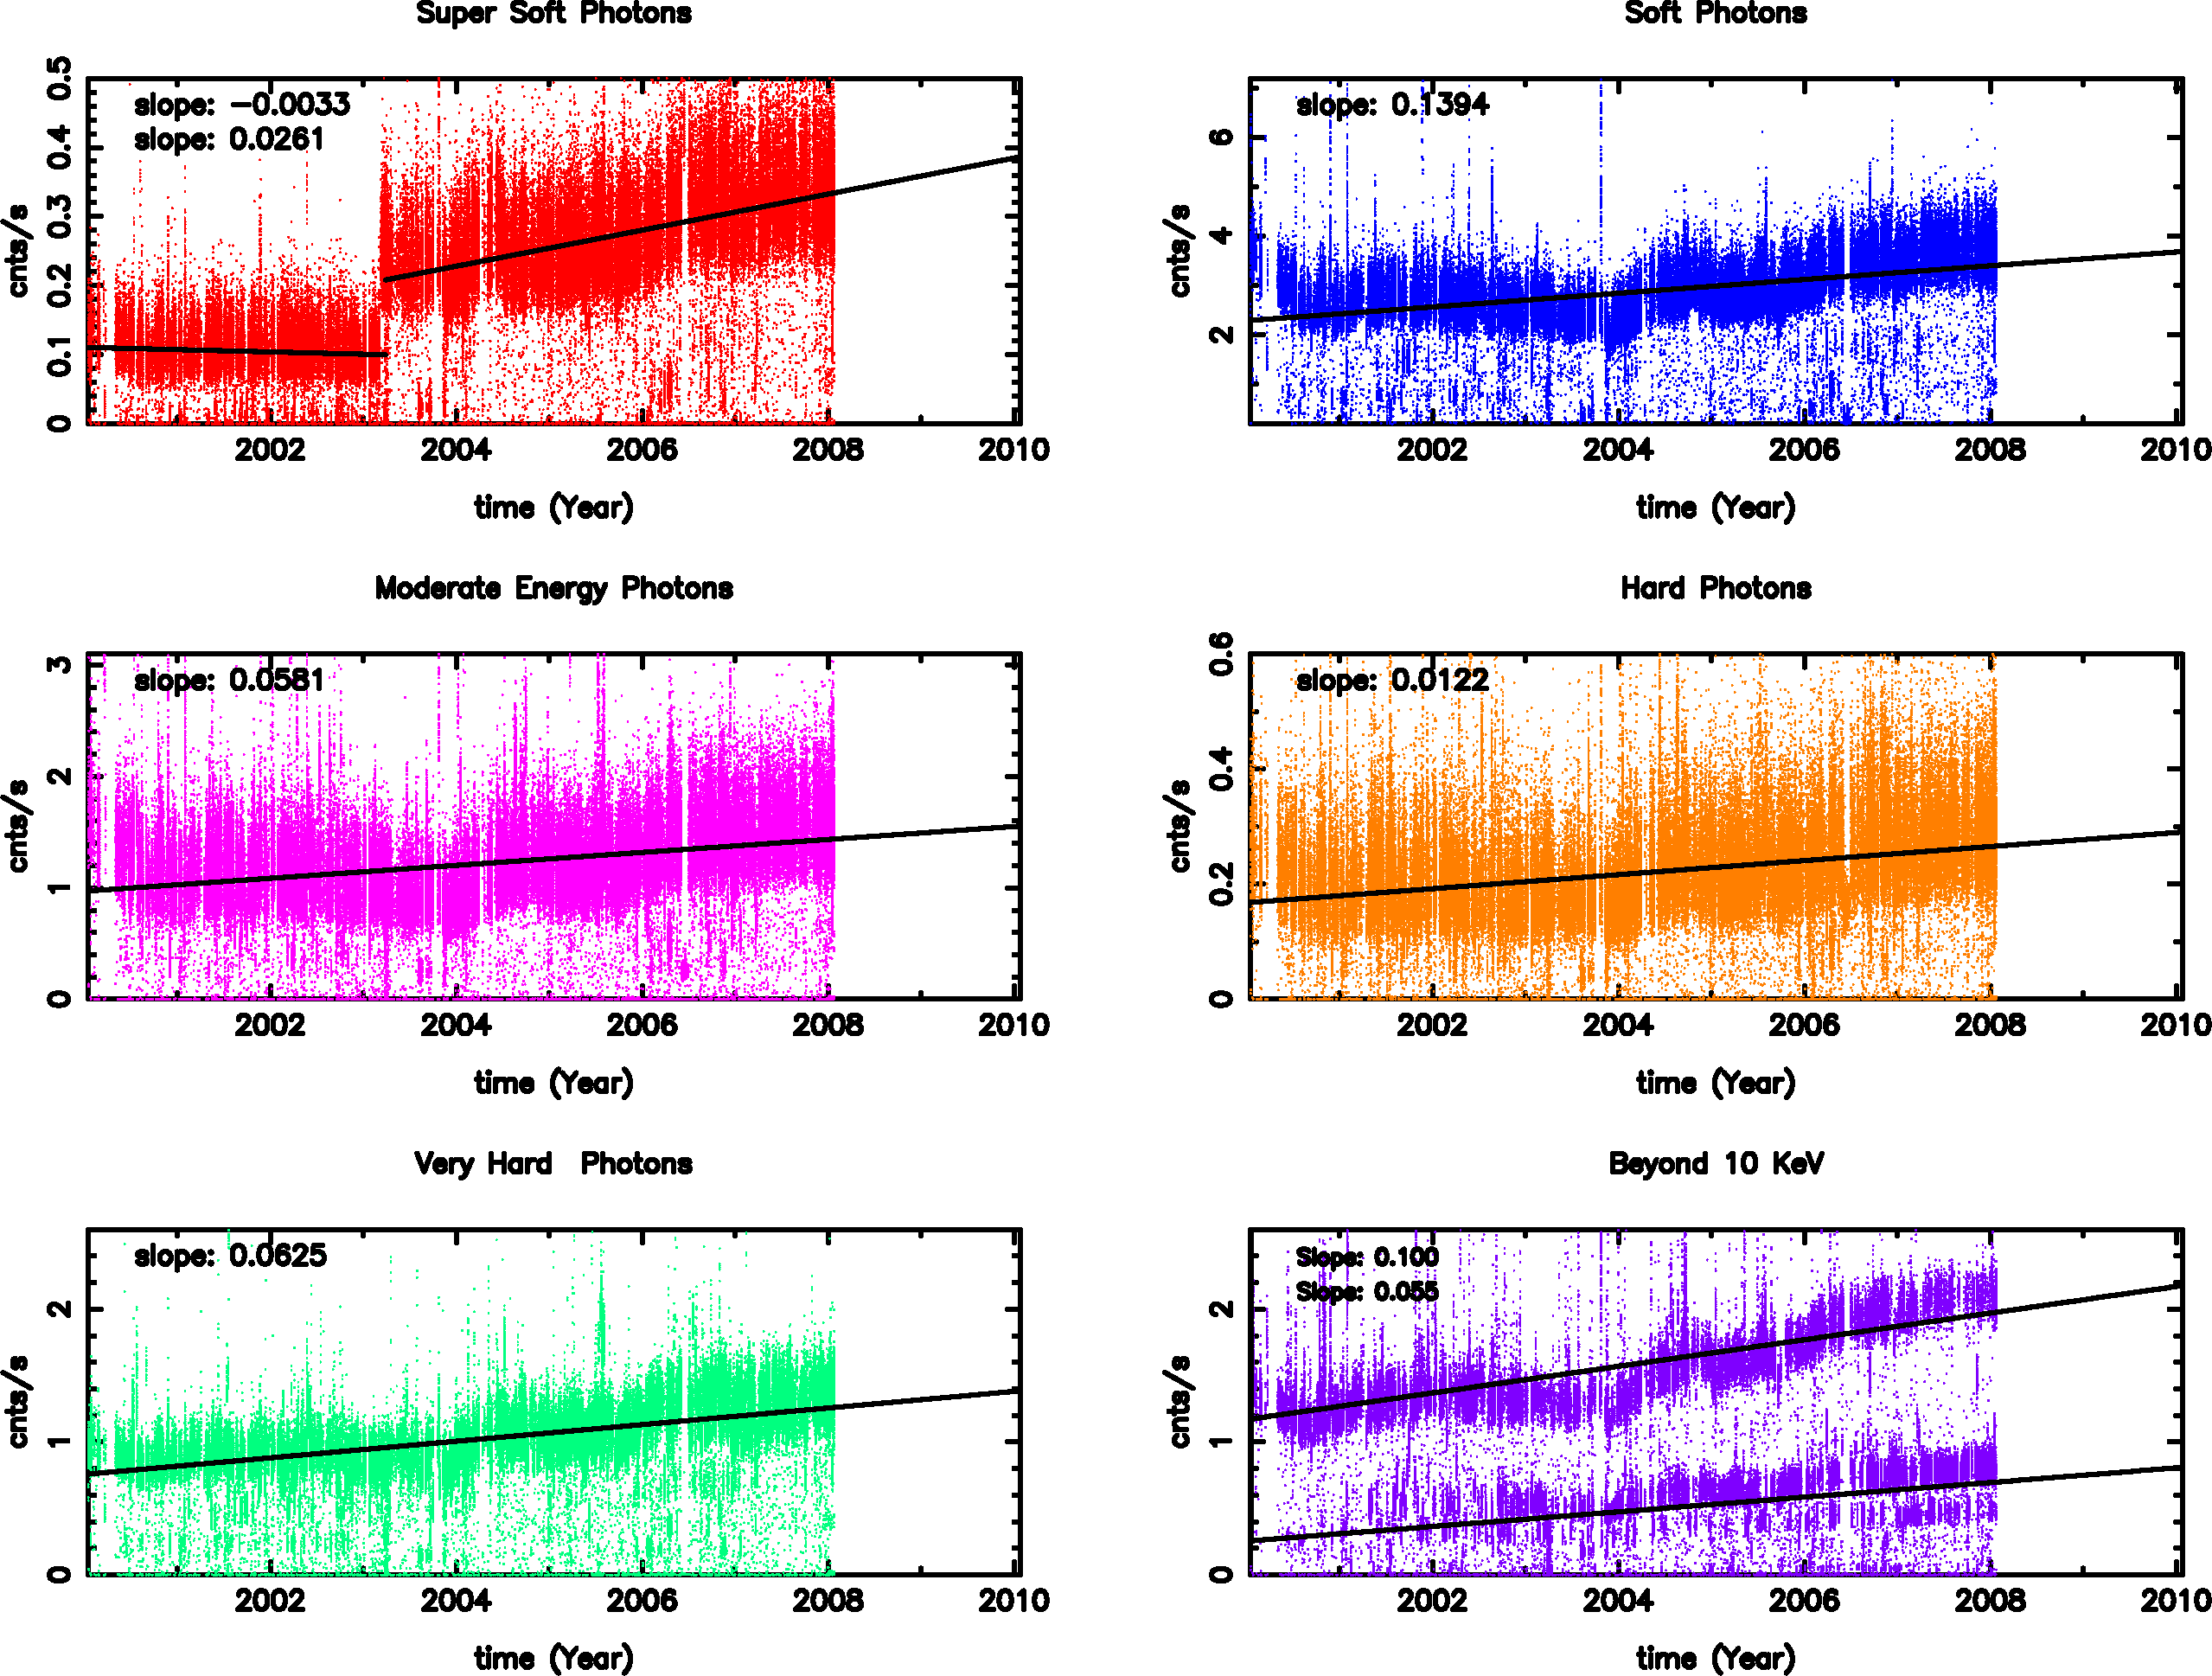
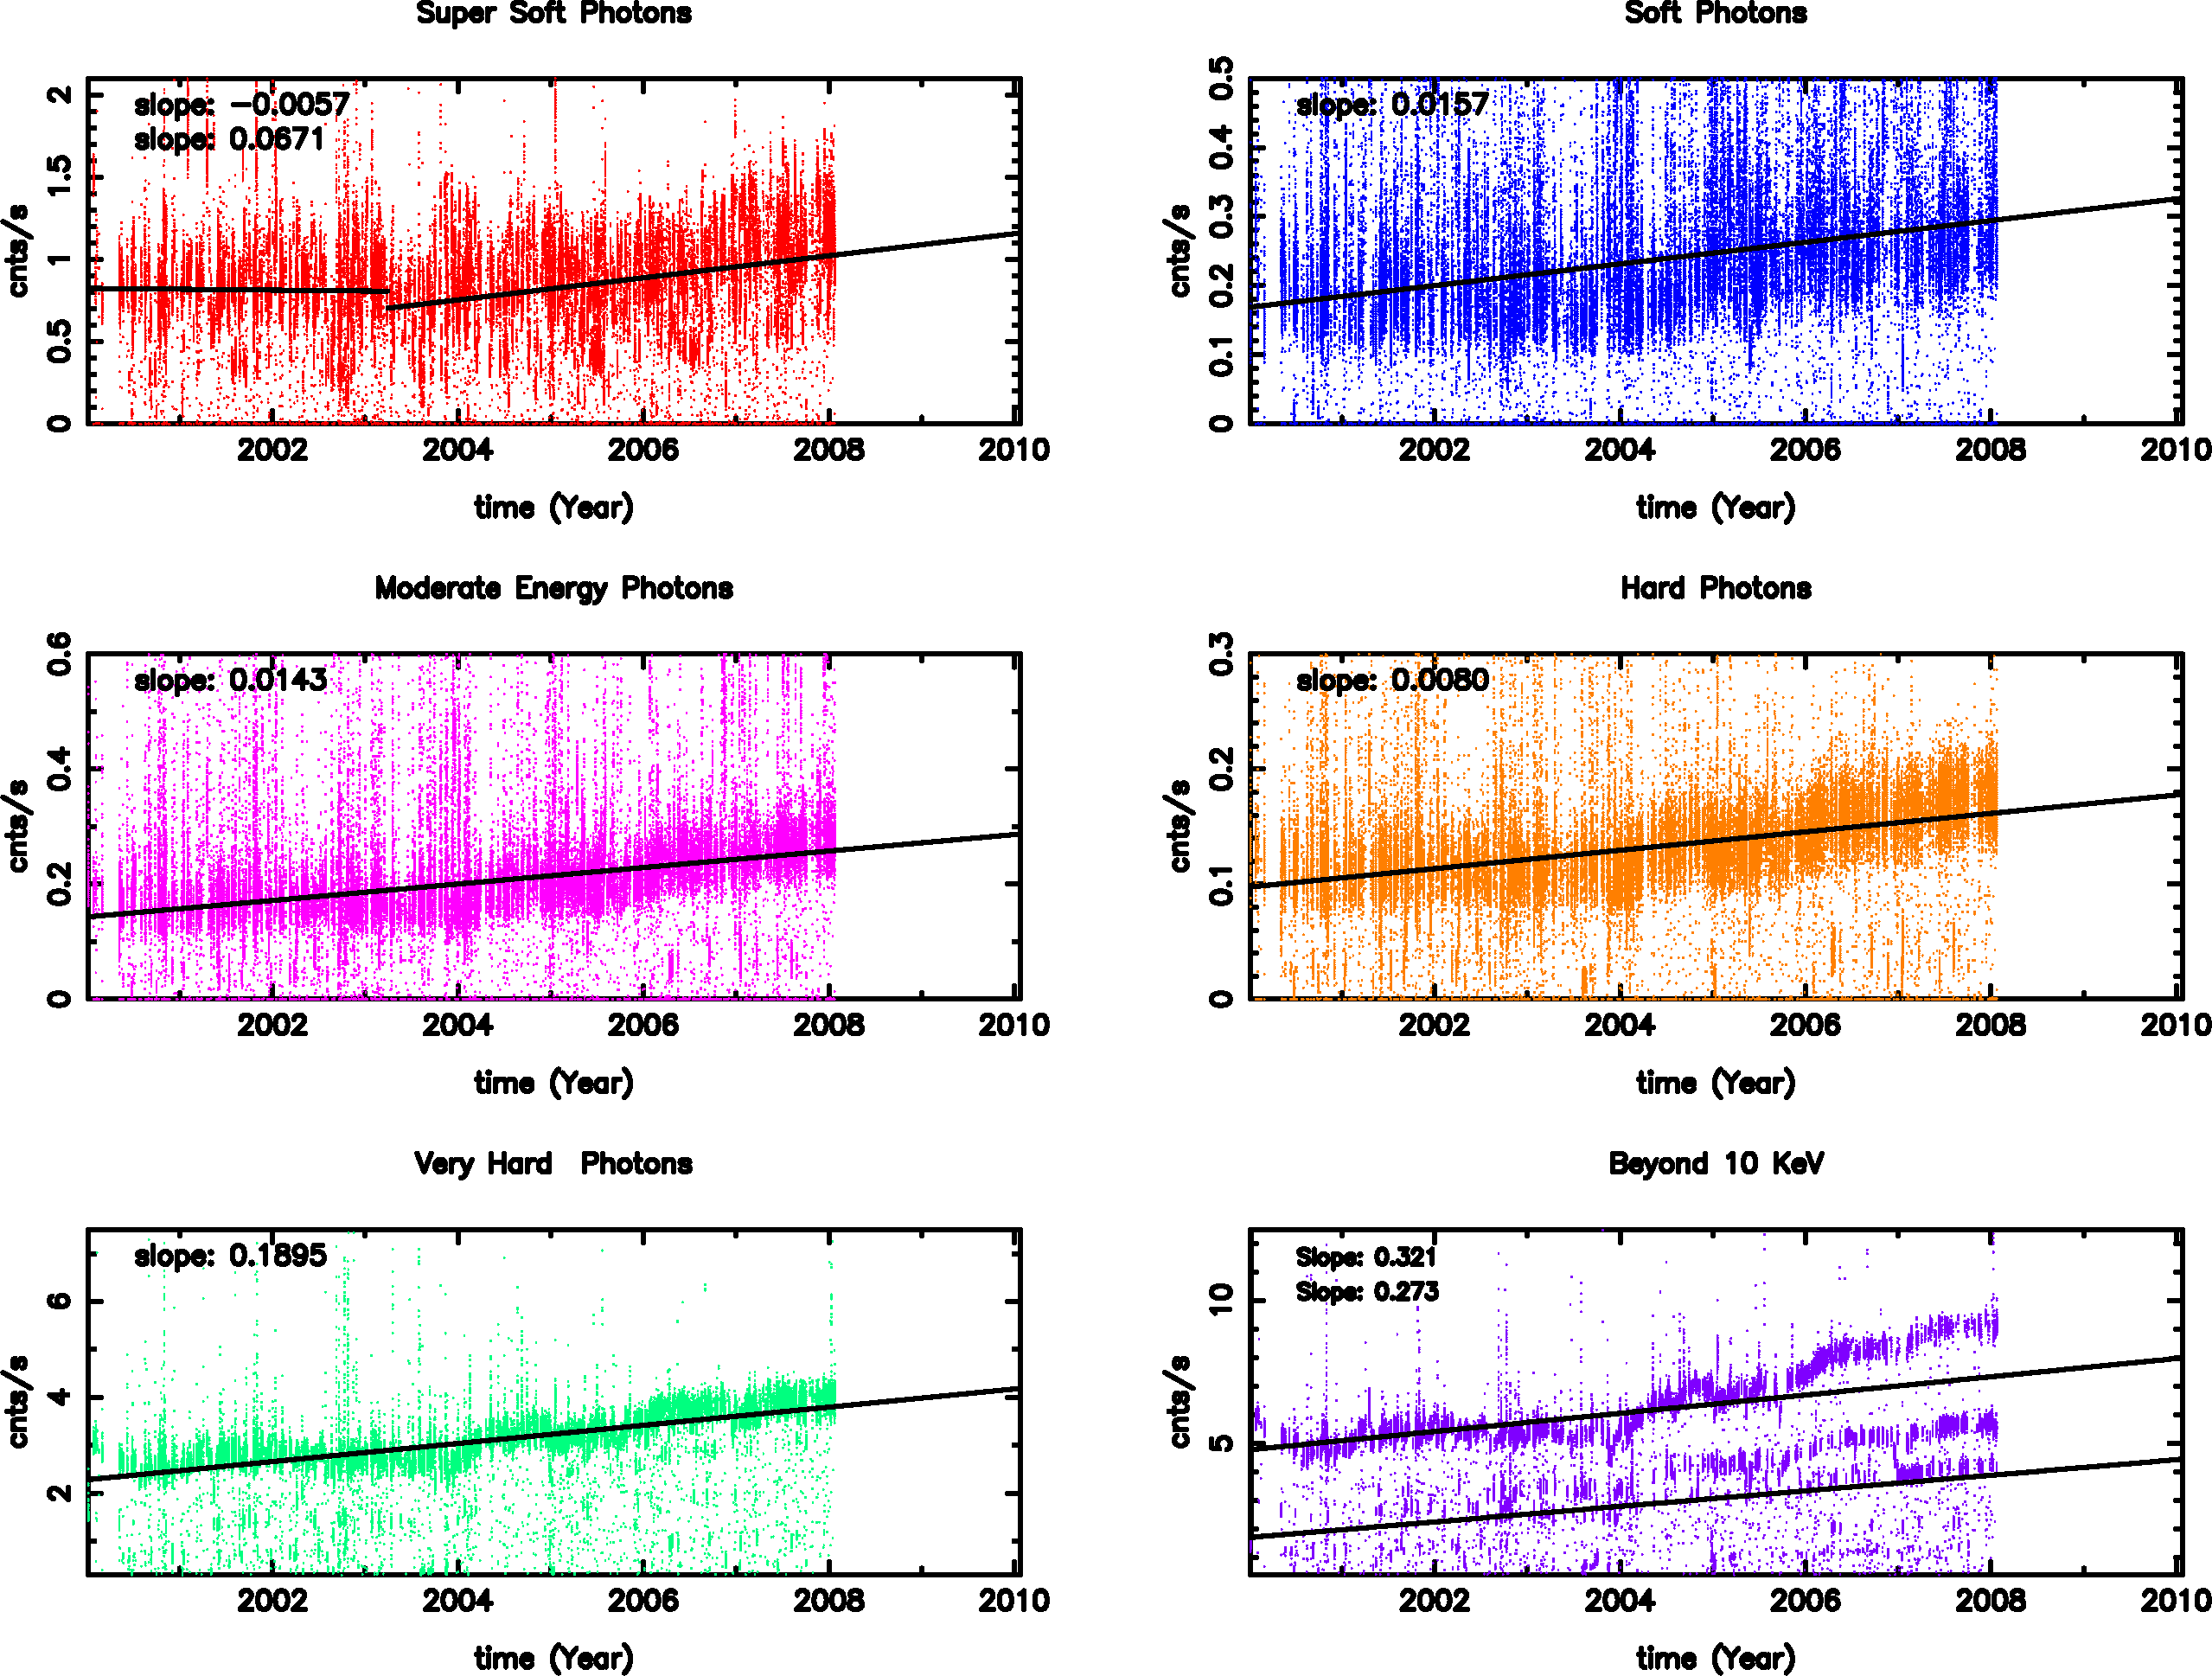
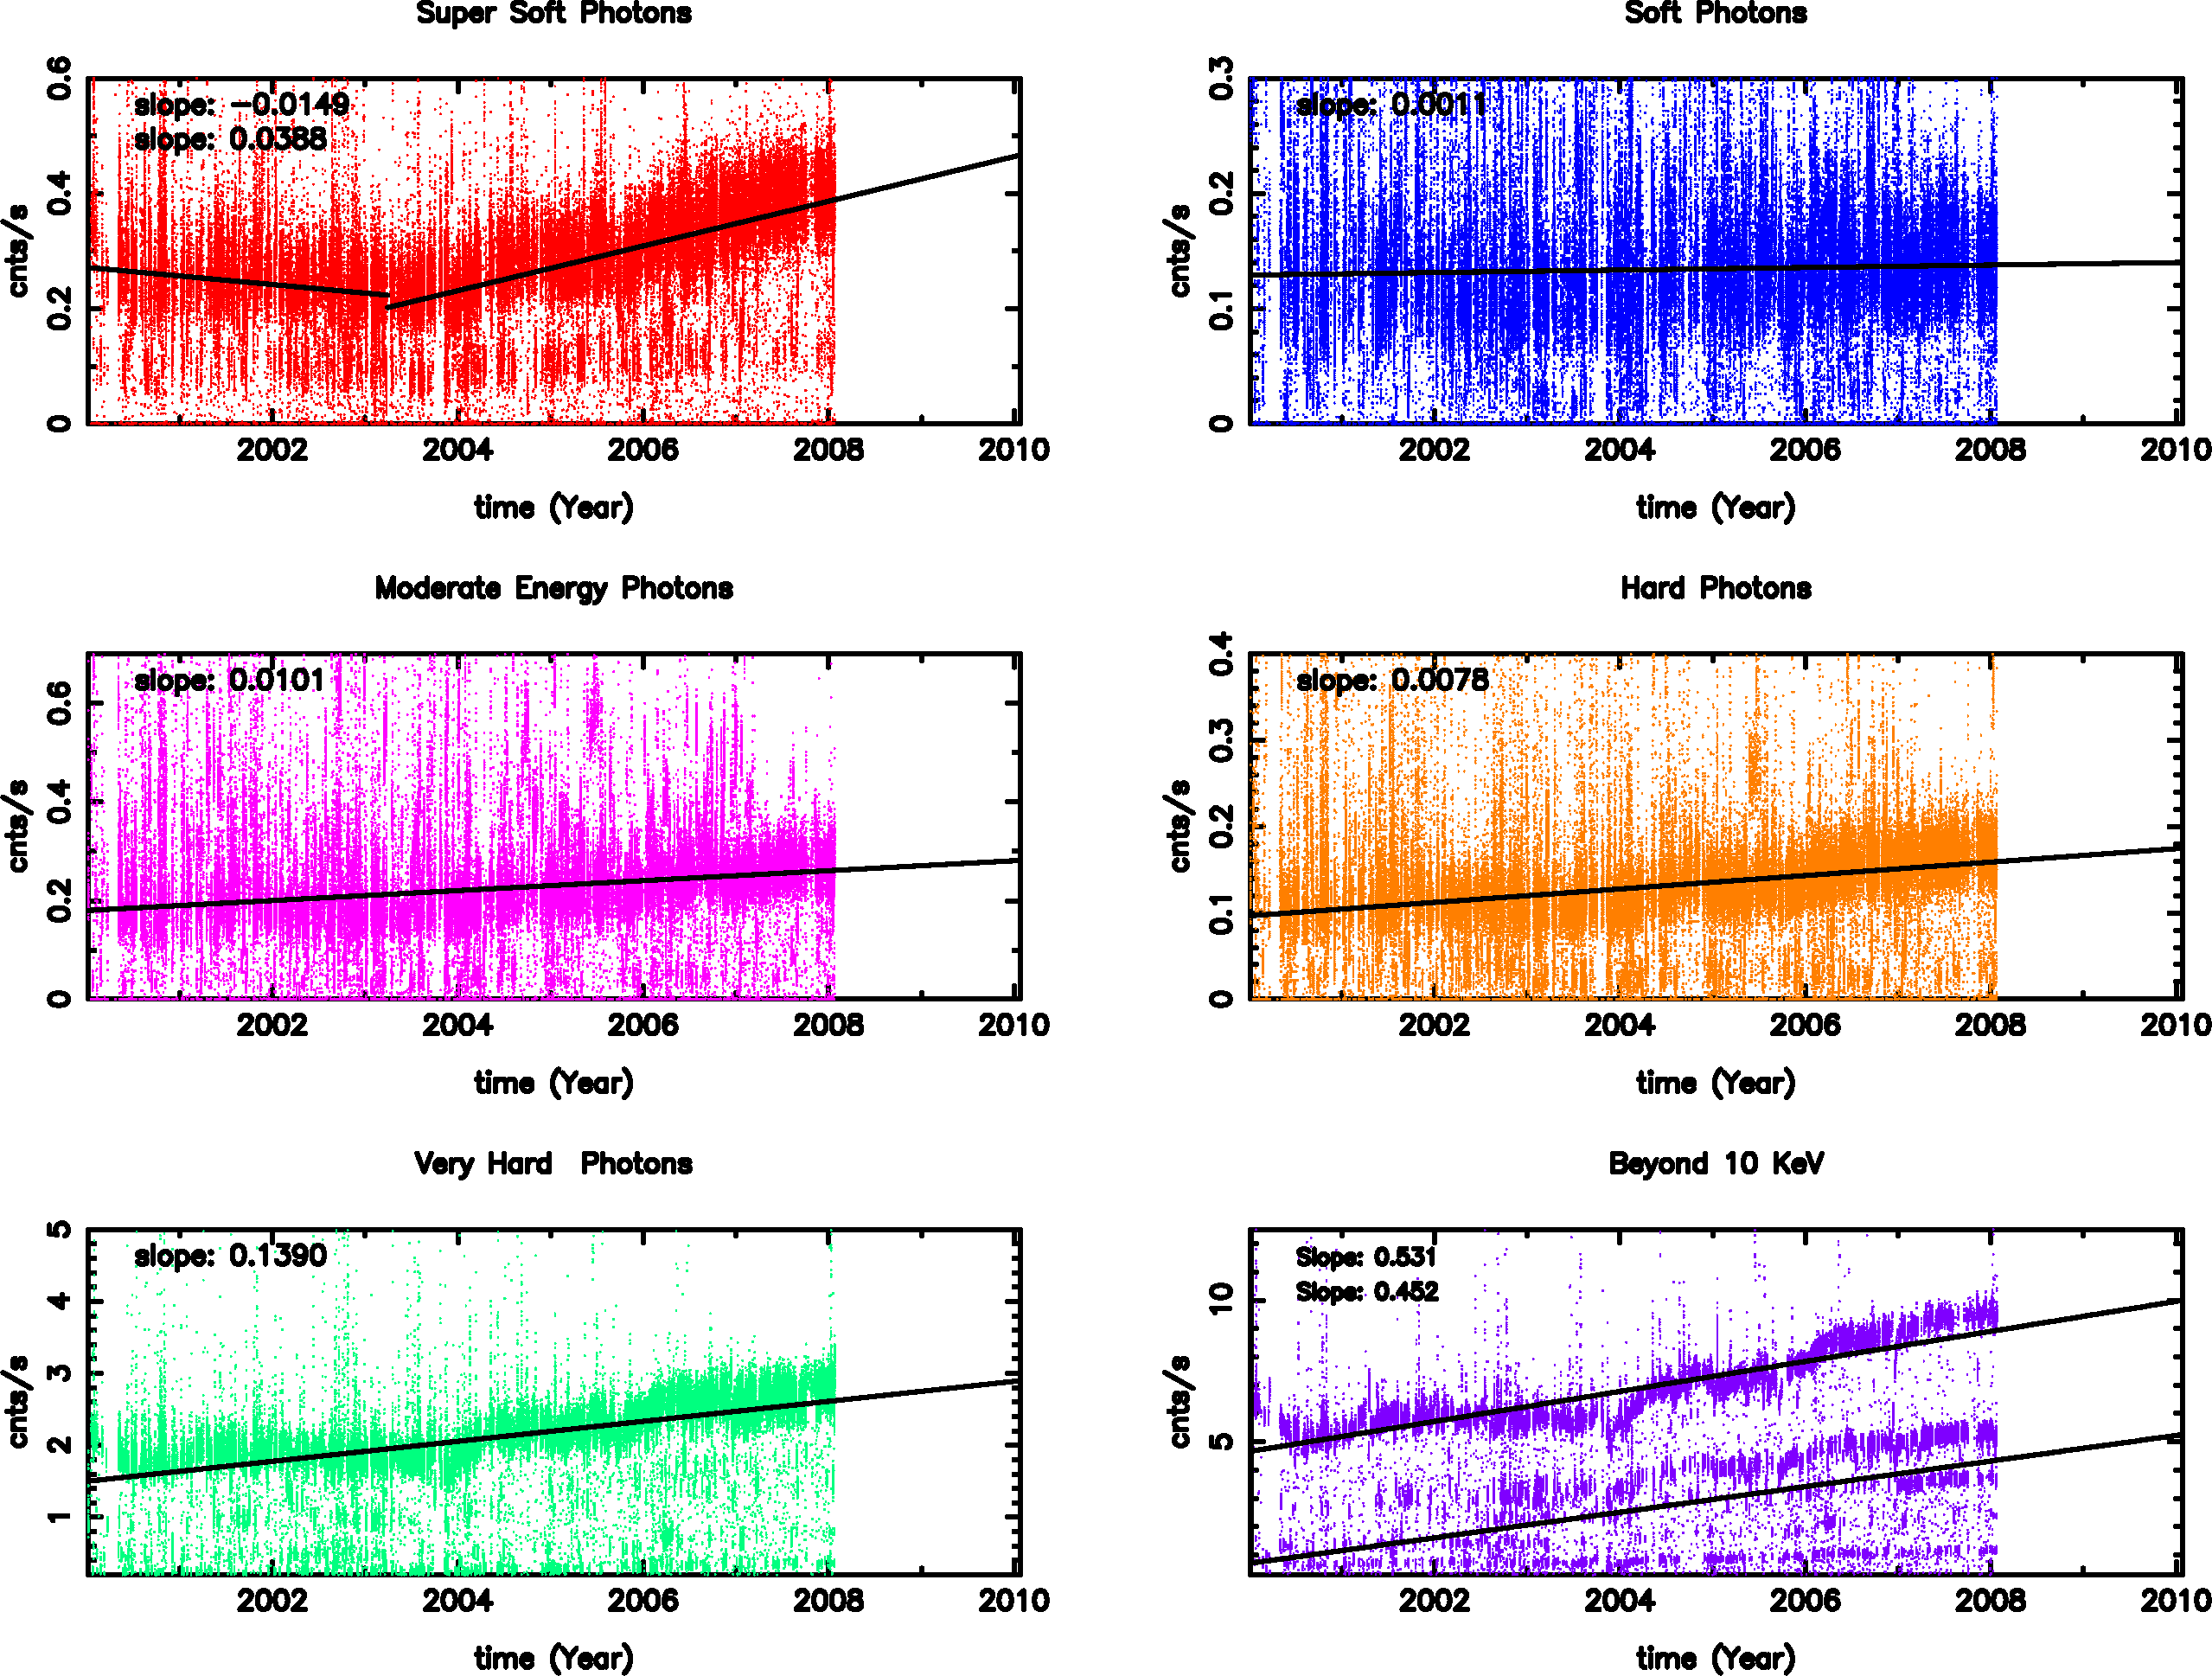
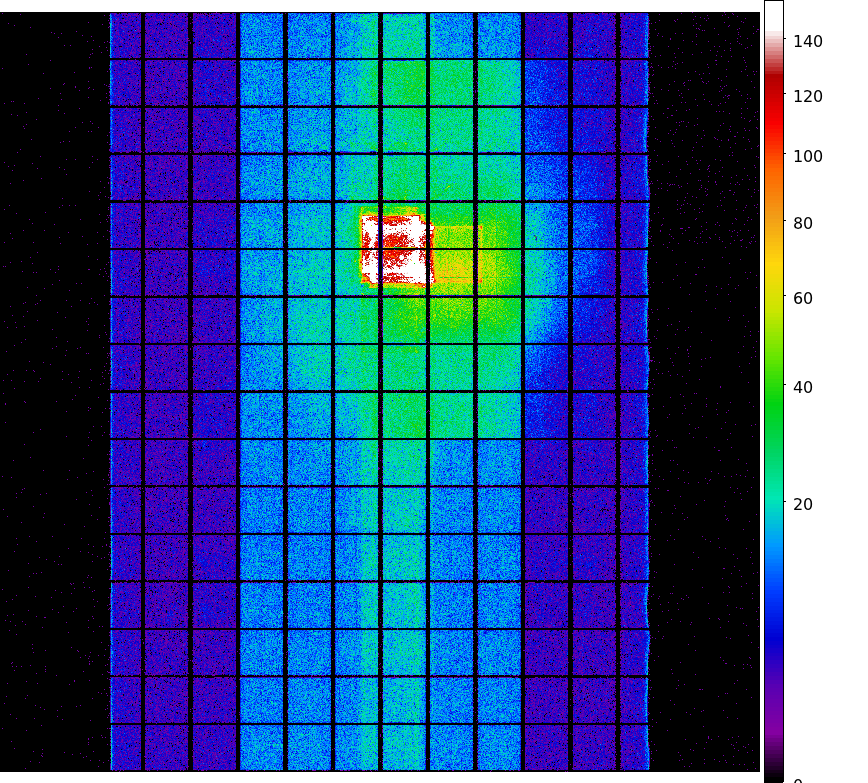
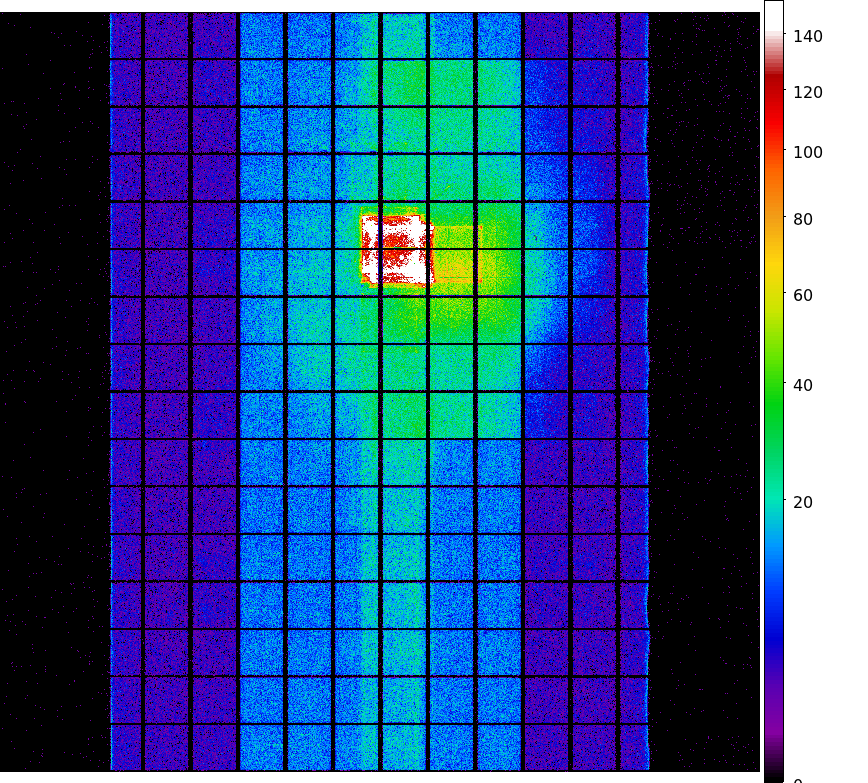
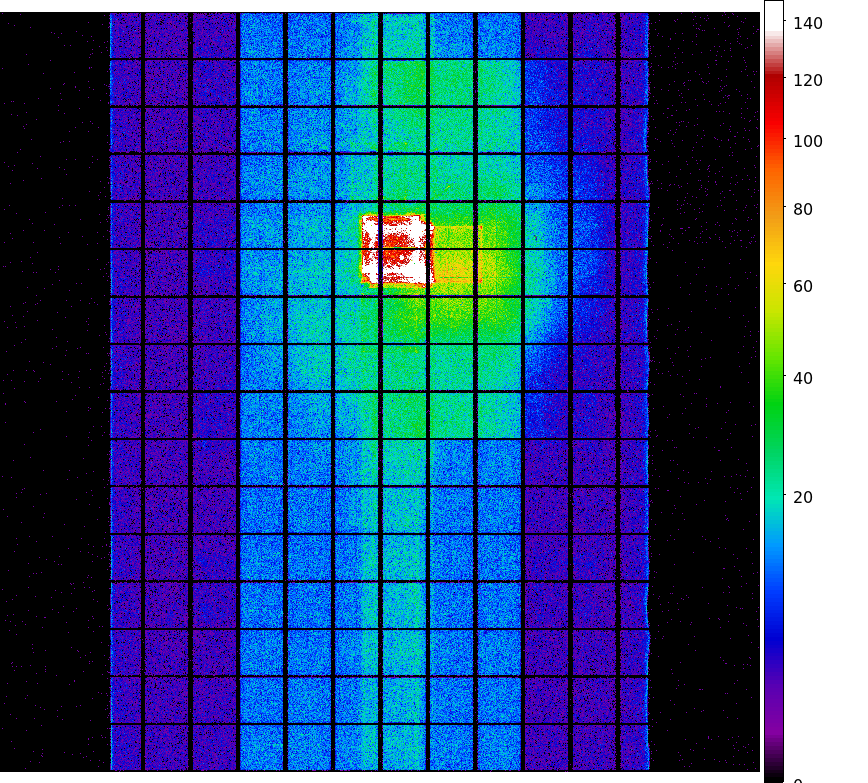
        IMAGE                NPIX      MEAN    STDDEV      MIN       MAX
HRCI_12_2007.fits          16777216   0.024    0.154       0.0       6.0
        IMAGE                NPIX      MEAN    STDDEV      MIN       MAX
HRCI_08_1999_12_2007.fits  16777216   2.460    3.473       0.0       289.0
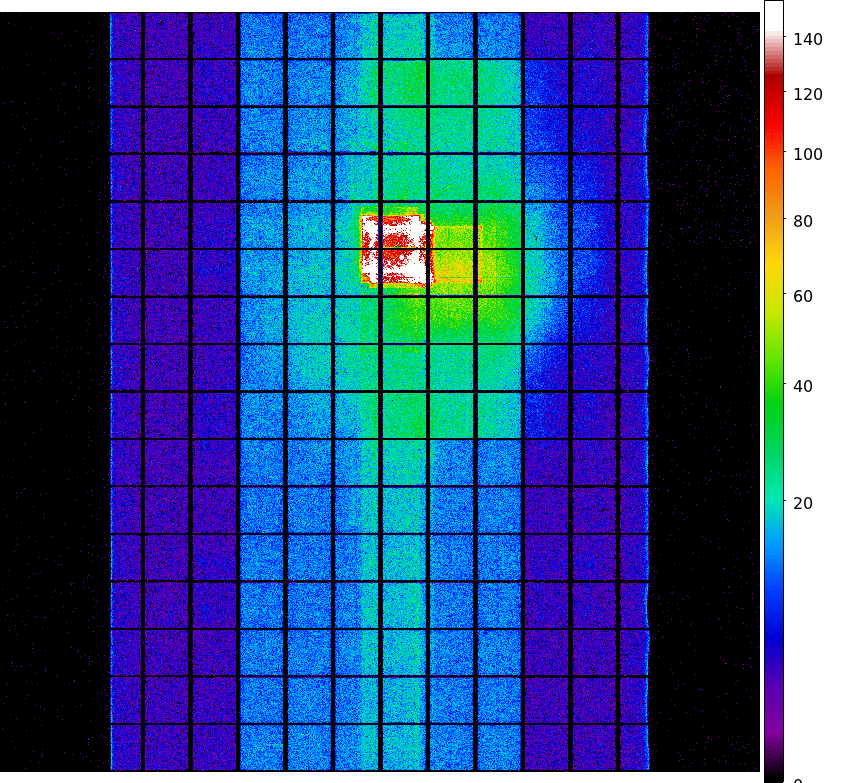
        IMAGE                NPIX      MEAN    STDDEV      MIN       MAX
HRCS_12_2007.fits          16777216   0.040    0.209       0.0       7.0
        IMAGE                NPIX     MEAN      STDDEV      MIN      MAX
HRCS_08_1999_12_2007.fits  16777216  8.380     16.088       0.0      1535.0
We display a max dose trend plot corrected for events that "pile-up" in the center of the taps due to bad position information.

|
|
|
|
| Sep 2007 | Jun 2007 | Mar 2007 | Dec 2006 |
|---|
|
|
|
|
| Mar 2007 | Jun 2007 | Mar 2007 | Dec 2006 |
|---|

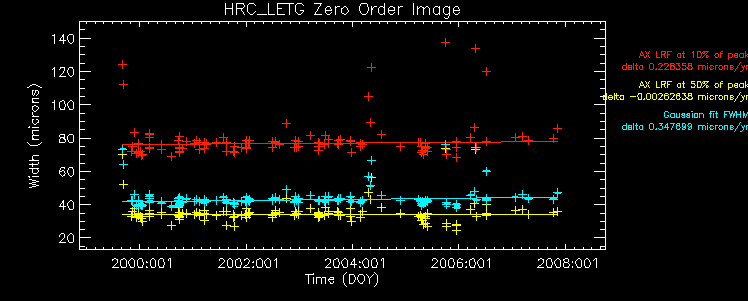
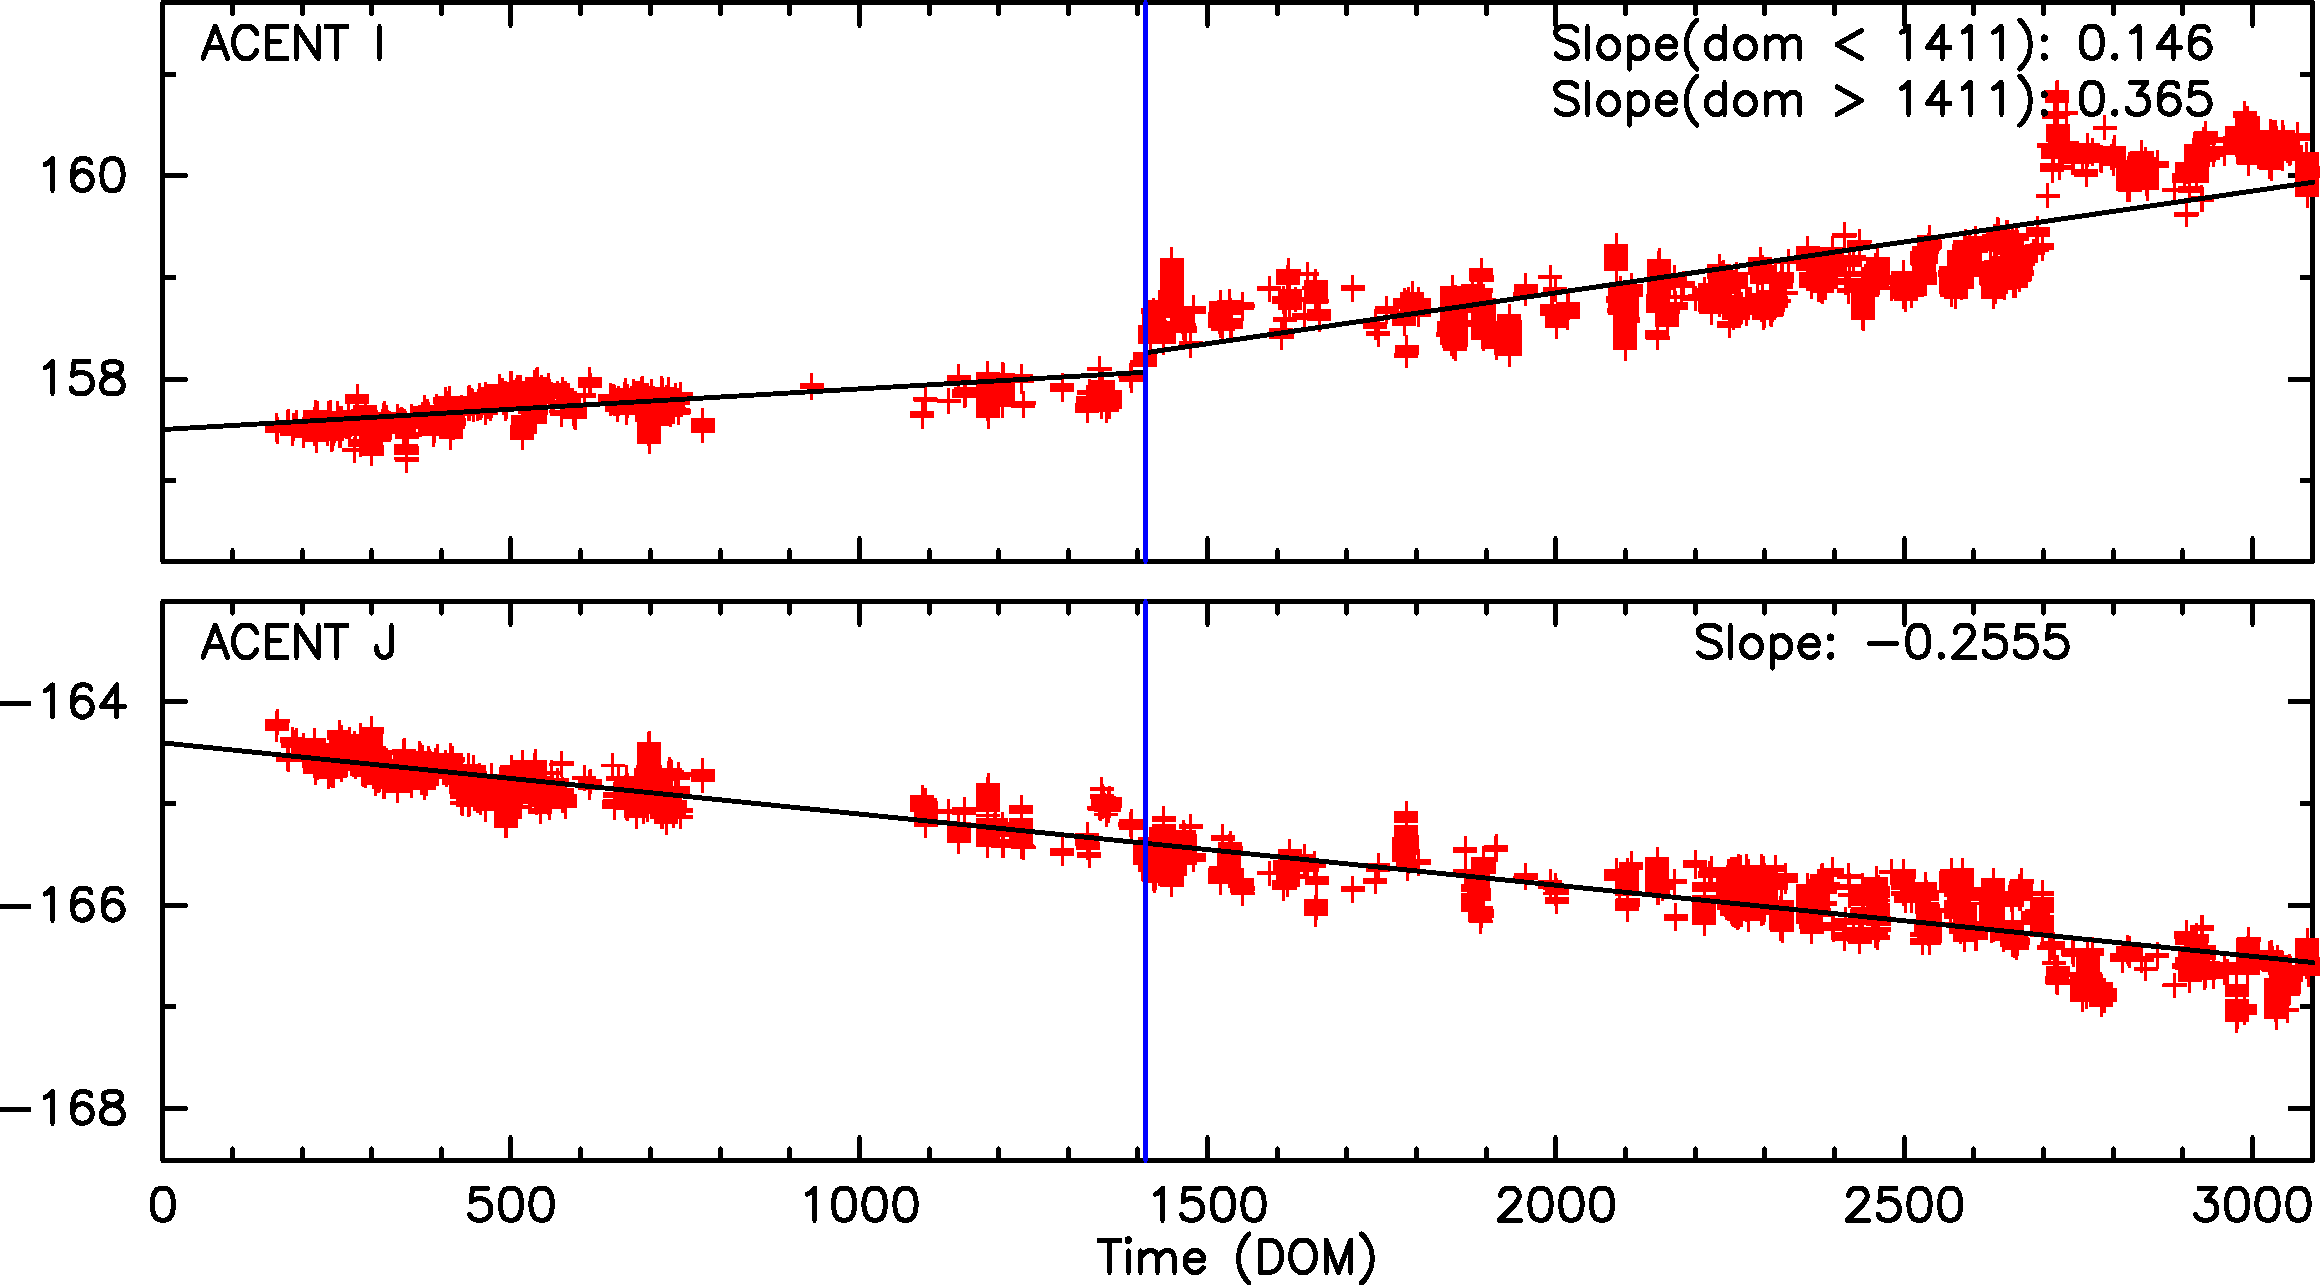
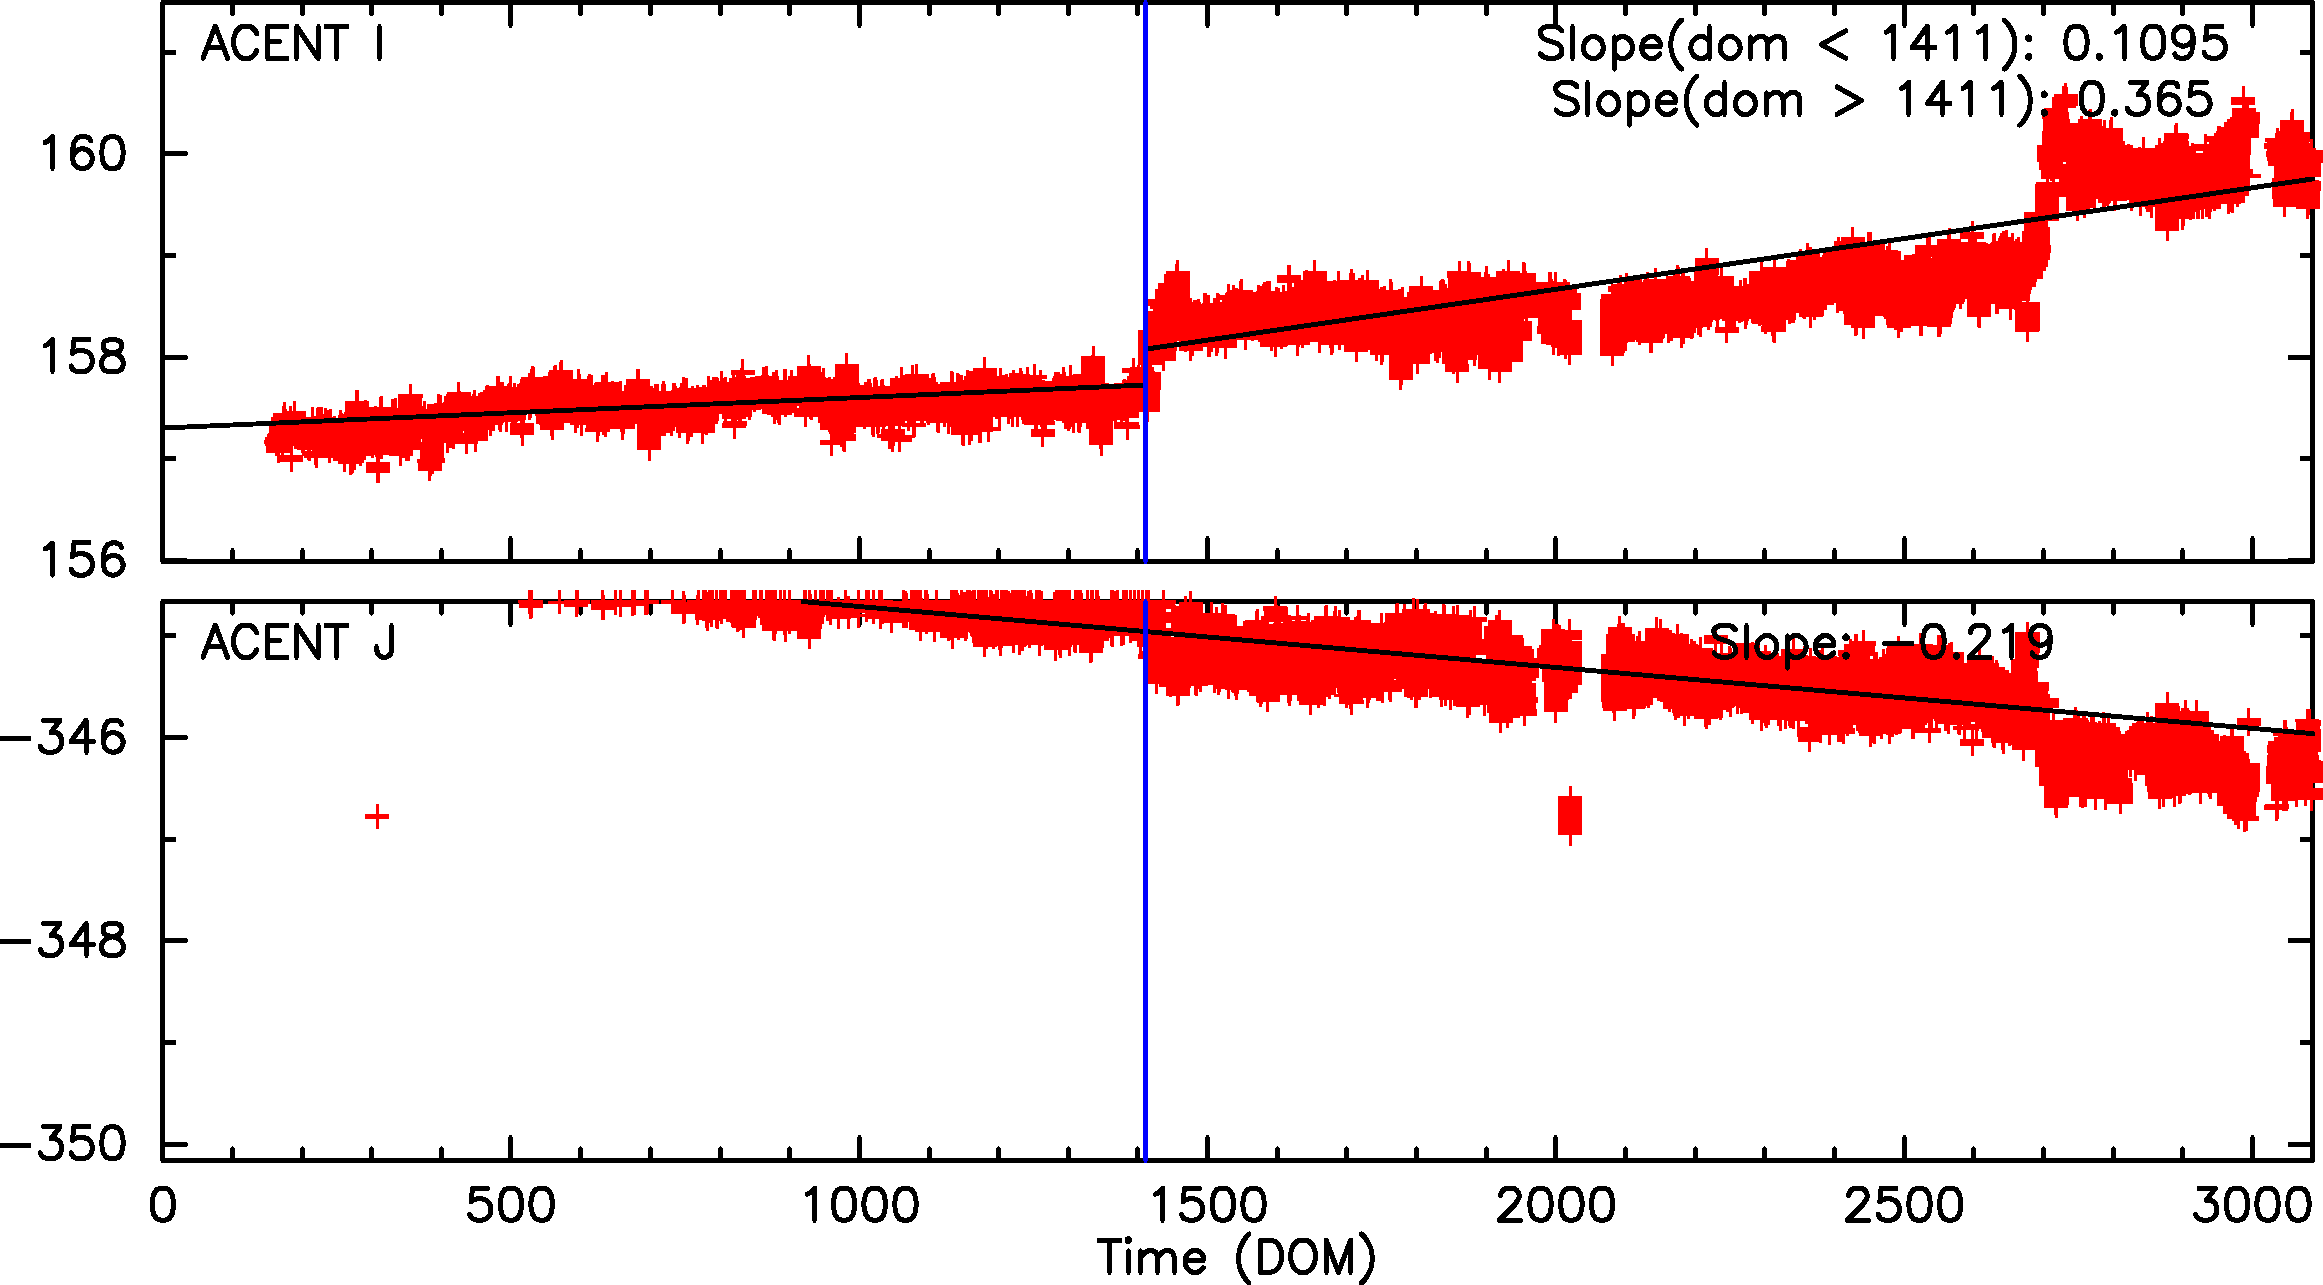
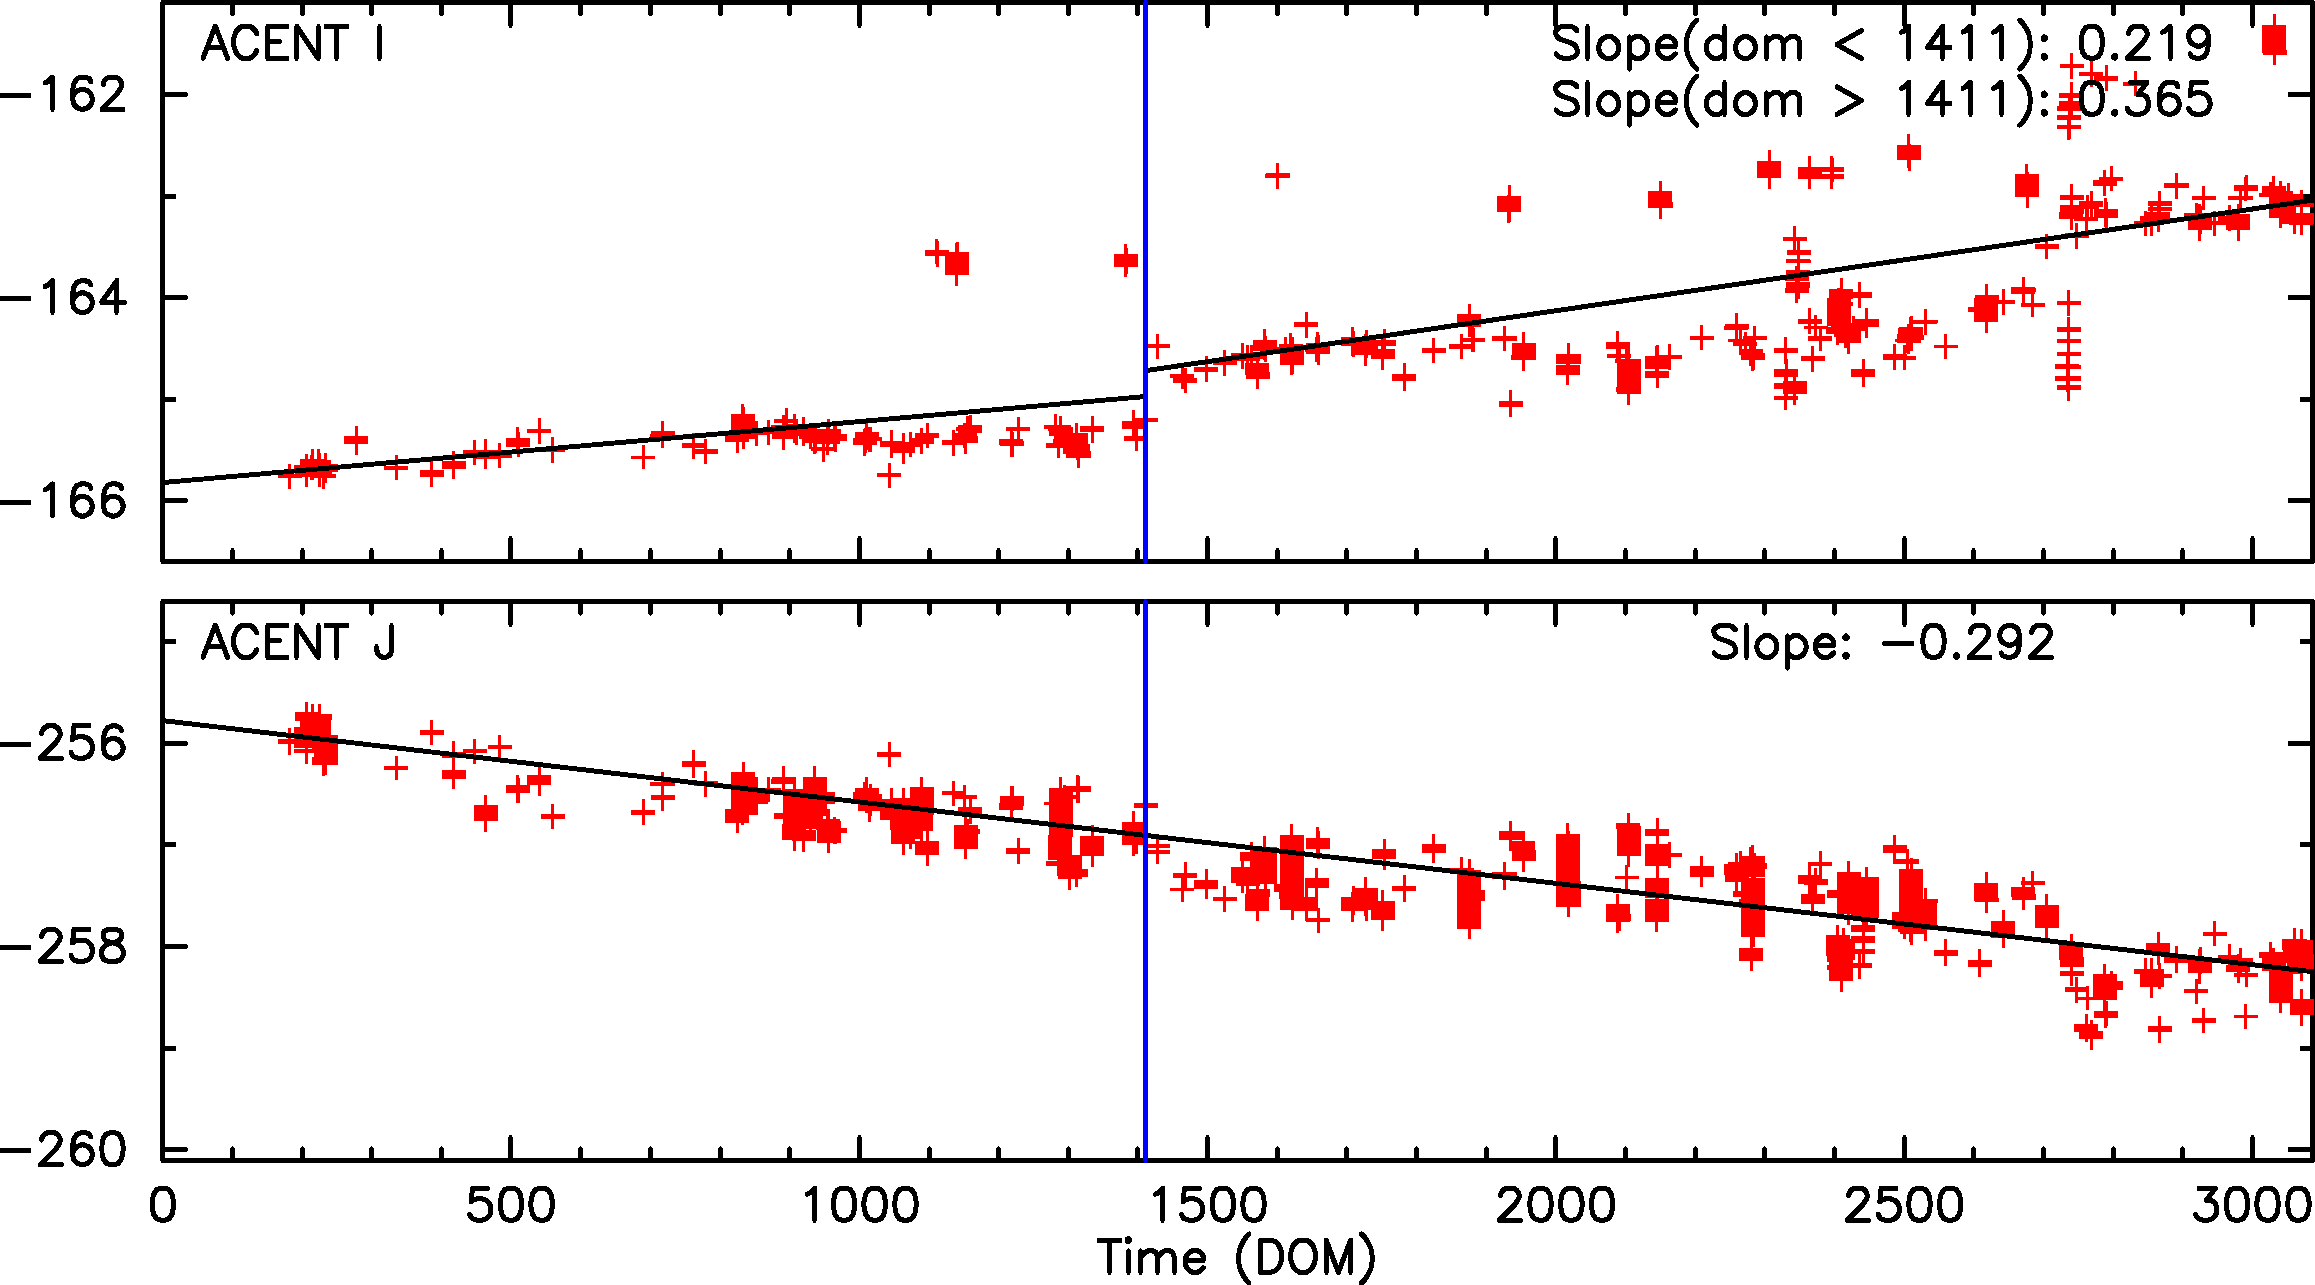
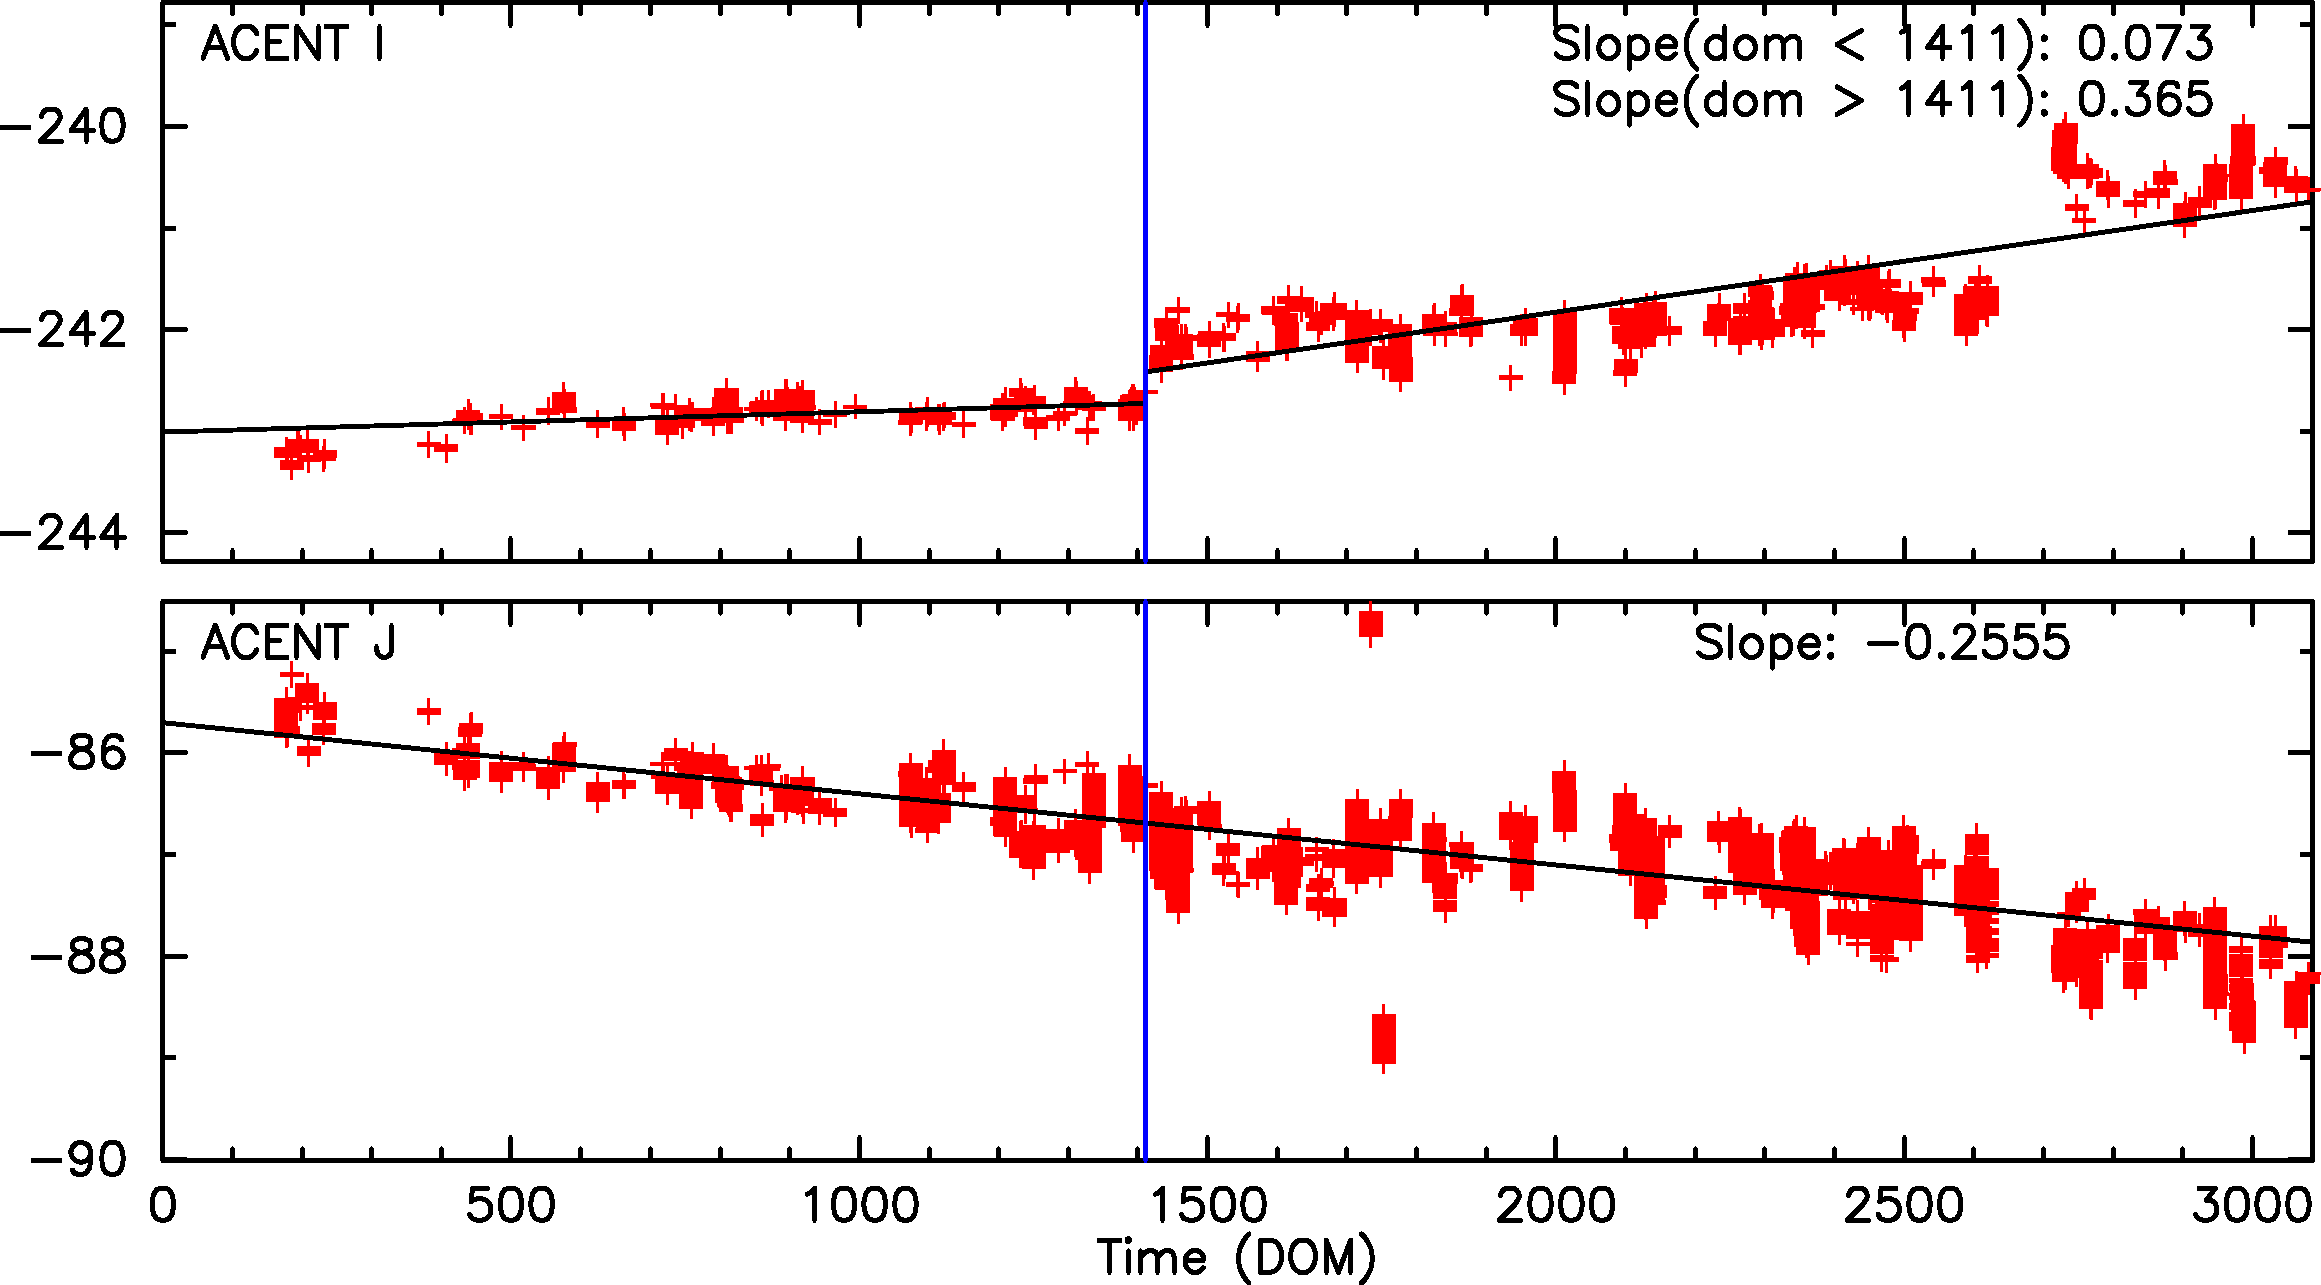
Fid light positions on ACA drift with time. The drift trends of Fid light 2 with ACIS-I and ACIS-S configurations are shown below.
The top panel shows Fid light 2 drift in ACENT I (app. along with -Y axis), and the
bottom panel shows that in ACENT J (app. along with Z axis). The unit is a pixel, and
one pixel is approximately 0.5 arcsec. The slope listed at the top right corner is
the change in a position per year (arcsec/yr). The vertical line on DOM = 1411 (September 1, 2003)
indicates a transition date of use of IRU-1 to IRU-2.
See also Tom Aldcroft's updated page: https://cxc.cfa.harvard.edu/mta/ASPECT/fid_drift

| Previous Quarter | ||||||
| MSID | MEAN | RMS | DELTA/YR | DELTA/YR/YR | UNITS | DESCRIPTION |
| DEAHK1 | 16.46 | 2.92 | 1.719e+00 | 2.160e+01 | C | DPA Thermistor 1 - BEP PC Board |
| DEAHK2 | 14.71 | 3.04 | 1.817e+00 | 2.501e+01 | C | DPA Thermistor 2 - BEP Oscillator |
| DEAHK3 | 16.89 | 5.87 | -6.226e+00 | -7.372e+01 | C | DPA Thermistor 3 - FEP 0 Mongoose |
| DEAHK4 | 15.28 | 4.59 | -3.370e+00 | -3.010e+01 | C | DPA Thermistor 4 - FEP 0 PC Board |
| DEAHK5 | 17.21 | 5.33 | -4.839e+00 | -5.396e+01 | C | DPA Thermistor 5 - FEP 0 ACTEL |
| DEAHK6 | 16.93 | 4.83 | -3.574e+00 | -4.336e+01 | C | DPA Thermistor 6 - FEP 0 RAM |
| DEAHK7 | 13.66 | 4.01 | -1.336e+00 | -1.341e+01 | C | DPA Thermistor 7 - FEP 0 Frame Buf. |
| DEAHK8 | 21.39 | 3.69 | -2.566e-01 | 2.797e+01 | C | DPA Thermistor 8 - FEP 1 Mongoose |
| DEAHK9 | 18.30 | 3.60 | -1.619e-02 | 2.933e+01 | C | DPA Thermistor 9 - FEP 1 PC Board |
| DEAHK10 | 21.03 | 3.68 | -1.647e-01 | 2.265e+01 | C | DPA Thermistor 10- FEP 1 ACTEL |
| DEAHK11 | 20.20 | 3.70 | -3.651e-01 | 2.263e+01 | C | DPA Thermistor 11- FEP 1 RAM |
| DEAHK12 | 15.00 | 3.60 | 2.883e-01 | 2.986e+01 | C | DPA Thermistor 12- FEP 1 Frame Buf. |
| DEAHK16 | -119.01 | 0.87 | 1.922e+00 | -2.155e+01 | C | Focal Plane Temp. Board 11 |
| Previous Quarter | ||||||
| MSID | MEAN | RMS | DELTA/YR | DELTA/YR/YR | UNITS | DESCRIPTION |
| HKP27I | 7.44 | 0.40 | -2.915e+00 | -1.255e+01 | AMP | HK 27 Volts Rail - Current |
| HKP27V | 17.66 | 6.73 | 7.397e+01 | 4.875e+02 | V | HK 27 Volts Rail - Voltage |
| TEIO | 311.05 | 15.59 | -3.660e+01 | 1.992e+02 | K | EPHIN ELECTRONICS HOUSING TEMP |
| TEPHIN | 313.19 | 3.63 | -2.752e+00 | -2.475e+01 | K | EPHIN SENSOR HOUSING TEMP |
| 
|

| Year | Month | |||||||||||
|---|---|---|---|---|---|---|---|---|---|---|---|---|
| 1999 | Jul | Aug | Sep | Oct | Nov | Dec | ||||||
| 2000 | Jan | Feb | Mar | Apr | May | Jun | Jul | Aug | Sep | Oct | Nov | Dec |
| 2001 | Jan | Feb | Mar | Apr | May | Jun | Jul | Aug | Sep | Oct | Nov | Dec |
| 2002 | Jan | Feb | Mar | Apr | May | Jun | Jul | Aug | Sep | Oct | Nov | Dec |
| 2003 | Jan | Feb | Mar | Apr | May | Jun | Jul | Aug | Sep | Oct | Nov | Dec |
| 2004 | Jan | Feb | Mar | Apr | May | Jun | Jul | Aug | Sep | Oct | Nov | Dec |
| 2005 | Jan | Feb | Mar | Apr | May | Jun | Jul | Aug | Sep | Oct | Nov | Dec |
| 2006 | Jan | Feb | Mar | Apr | May | Jun | Jul | Aug | Sep | Oct | Nov | Dec |
| 2007 | Jan | Feb | Mar | Apr | May | Jun | Jul | Aug | Sep | Oct | Nov | |