The steps we took to compute the dose map are;
- Level 1 Event files for a specified month are obtained from archive.
- Image data including I2, I3, S2, S3 CCDs are extracted from all event files.
- All the extracted image data were merged to create a month long exposure map for the month.
- The exposure map is opened with ds9, and check a distribution of count rates against energy.
From this, estimate the upper threshold value. Any events beyond this upper threshold are
assumed erroneous events such as bad pixels.
- Using this upper threshold, the data is filtered, and create a cleaned exposure map for the month.
- The exposure map from each month from the Sep 1999 is added up to create a cumulative exposure
map for each month.
- Using fimgstatistic, we compute count rate statistics for each CCDs.
- For observations with high data drop rates (e.g., Crab nebula, Cas A), we corrected the
observations by adding events.
Note: Counts and RMS's of Cumulative maps are lower than the previous months. This is because we excluded
extreme outliers.
Please check more detail plots at Telemetered Photon Dose Trend page.
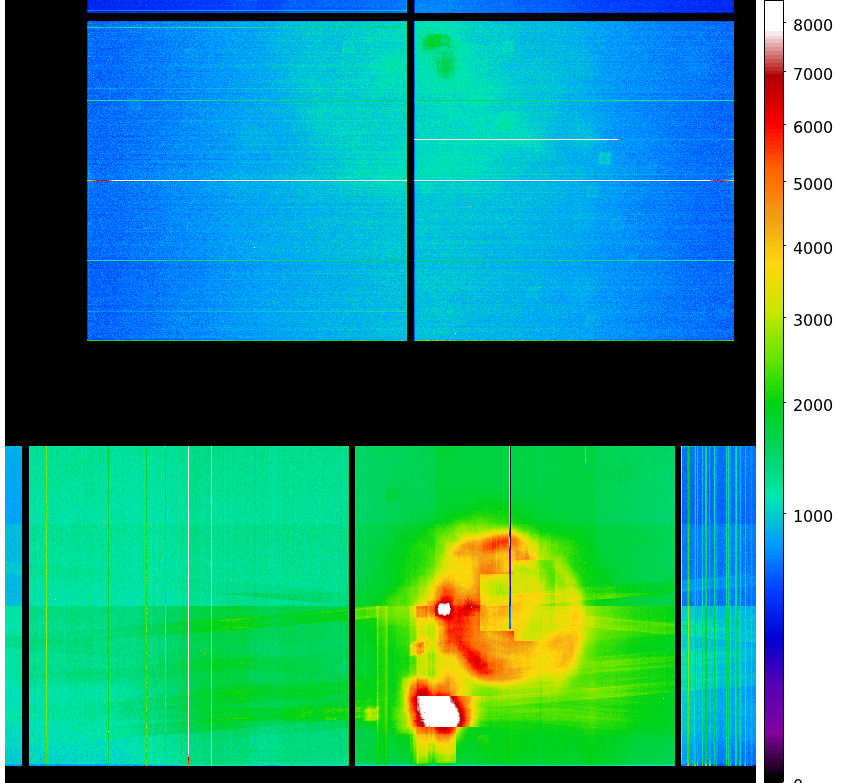
- MAR registered-photon-map in fits
Statistics:
# IMAGE NPIX MEAN RMS MIN MAX
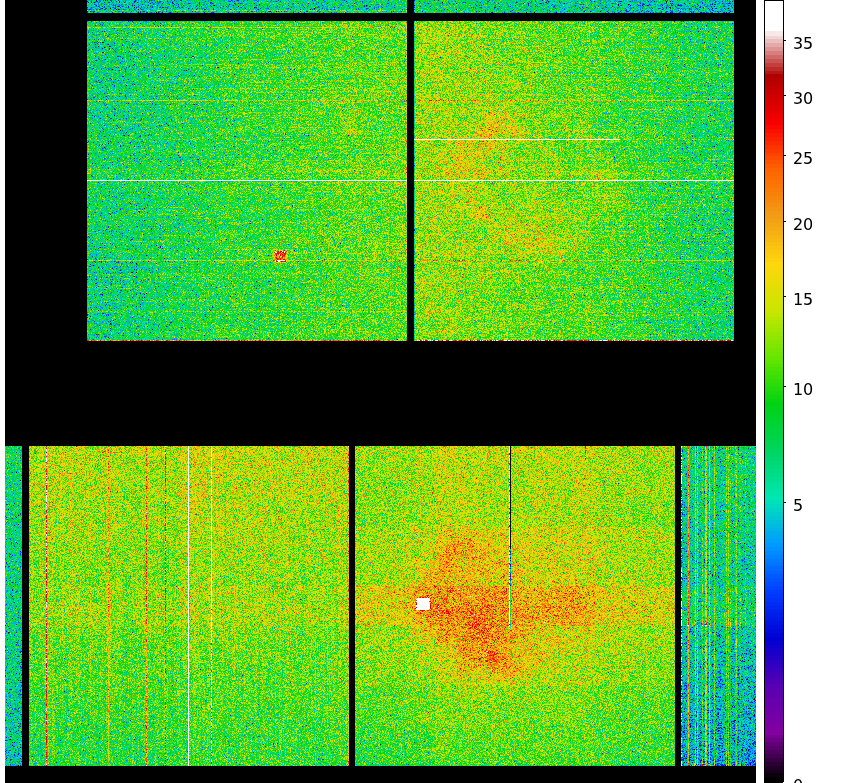
ACIS_mar08 6004901 9.11664 13.8470 0.0 748.0
I2 node 0 262654 9.106190 3.637892 0.0 60.0
I2 node 1 262654 9.751488 4.172524 0.0 318.0
I2 node 2 262654 9.569290 3.679762 0.0 115.0
I2 node 3 262654 9.473602 3.871092 0.0 51.0
I3 node 0 262654 11.016567 4.050848 0.0 56.0
I3 node 1 262654 12.447517 11.030034 0.0 274.0
I3 node 2 262654 11.498349 4.231673 0.0 85.0
I3 node 3 262654 10.713703 3.982495 0.0 193.0
I2 node 0 262654 12.142482 4.415640 0.0 584.0
I2 node 1 262654 12.378050 4.862955 0.0 83.0
I2 node 2 262654 12.884773 4.564273 0.0 104.0
I2 node 3 262654 12.367842 4.091962 0.0 351.0
I3 node 0 262654 13.846431 10.162478 0.0 433.0
I3 node 1 262654 16.080100 5.682849 0.0 81.0
I3 node 2 262654 14.738193 4.571630 1.0 68.0
I3 node 3 262654 13.032341 4.032328 0.0 82.0
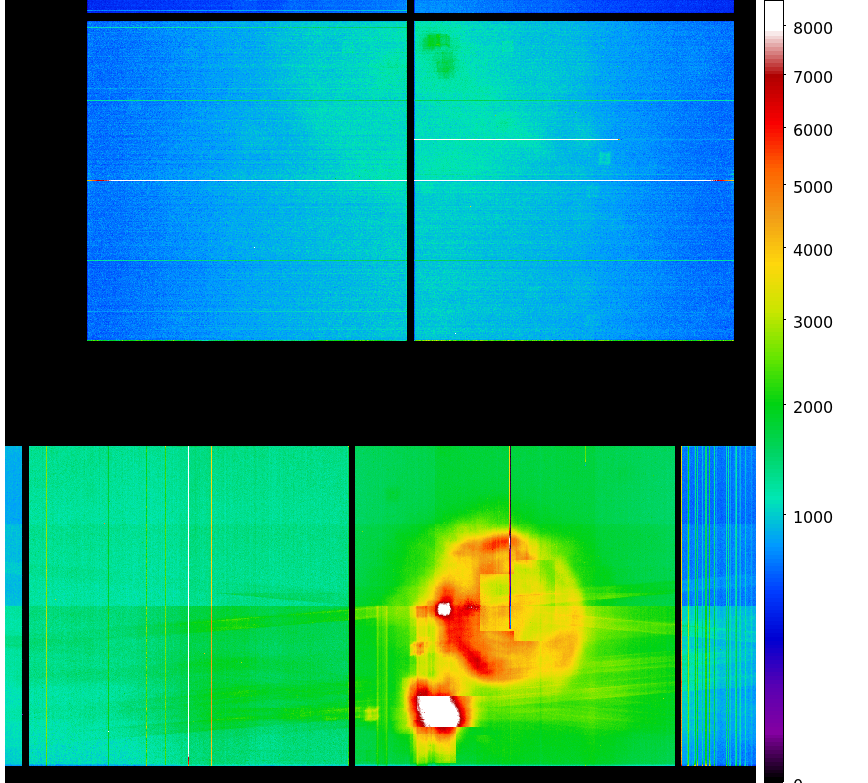
- Jul 1999 - Mar 2008 registered-photon-map in fits
Statistics:
IMAGE NPIX MEAN RMS MIN MAX
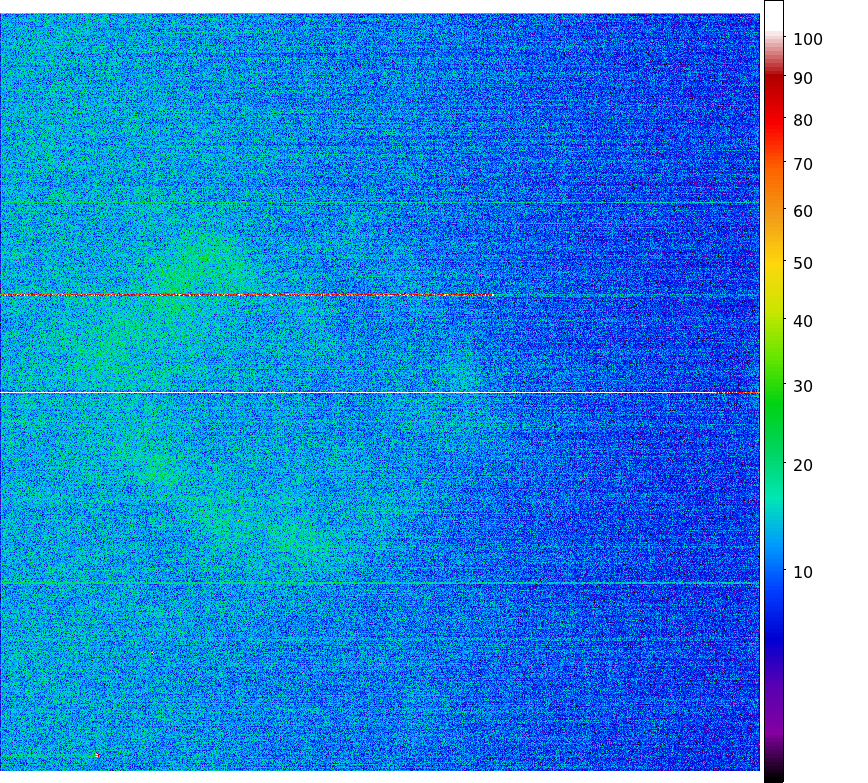
ACIS_total 6004901 1124.988 1544.517 0.0 67736.0
I2 node 0 262654 844.725391 150.407198 0.0 3723.0
I2 node 1 262654 893.186225 205.699687 0.0 13174.0
I2 node 2 262654 909.140224 175.332953 0.0 3602.0
I2 node 3 262654 911.612433 218.579365 0.0 4266.0
I3 node 0 262654 964.253829 237.578268 0.0 5353.0
I3 node 1 262654 999.318096 703.752880 0.0 18733.0
I3 node 2 262654 886.630514 150.671487 0.0 3718.0
I3 node 3 262654 874.941116 161.307122 0.0 16238.0
I2 node 0 262654 1326.323905 166.710203 643.0 12821.0
I2 node 1 262654 1409.129174 286.636748 683.0 7188.0
I2 node 2 262654 1579.426310 300.910806 881.0 10256.0
I2 node 3 262654 1528.340653 231.714729 871.0 18058.0
I3 node 0 262654 2417.931537 1263.135614 962.0 10787.0
I3 node 1 262654 3624.683329 1775.079595 0.0 11724.0
I3 node 2 262654 2626.187420 801.136017 848.0 5810.0
I3 node 3 262654 1951.337986 318.893251 1022.0 7903.0
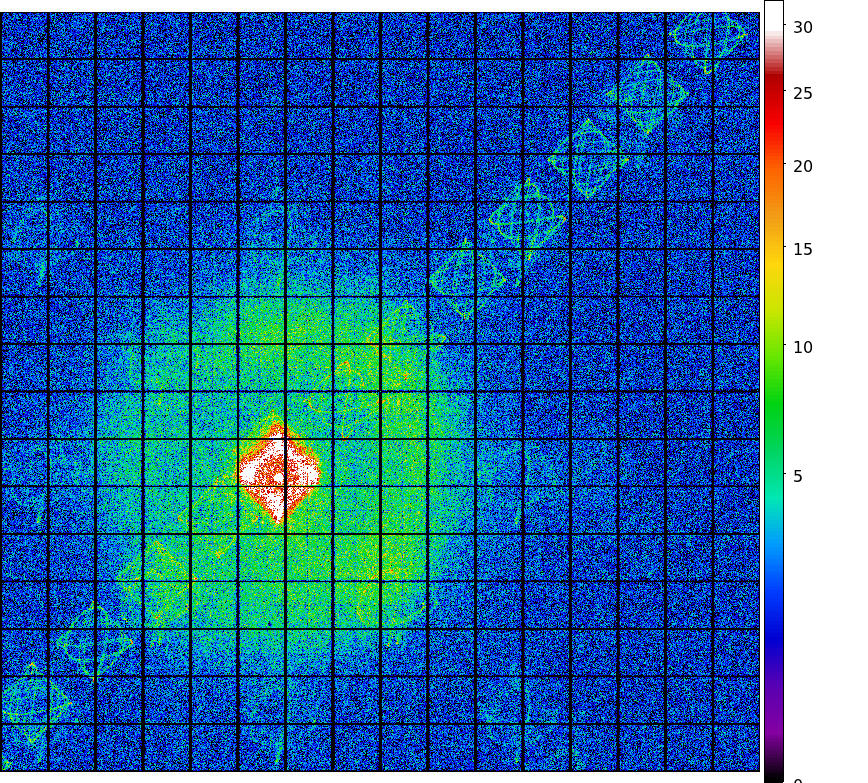
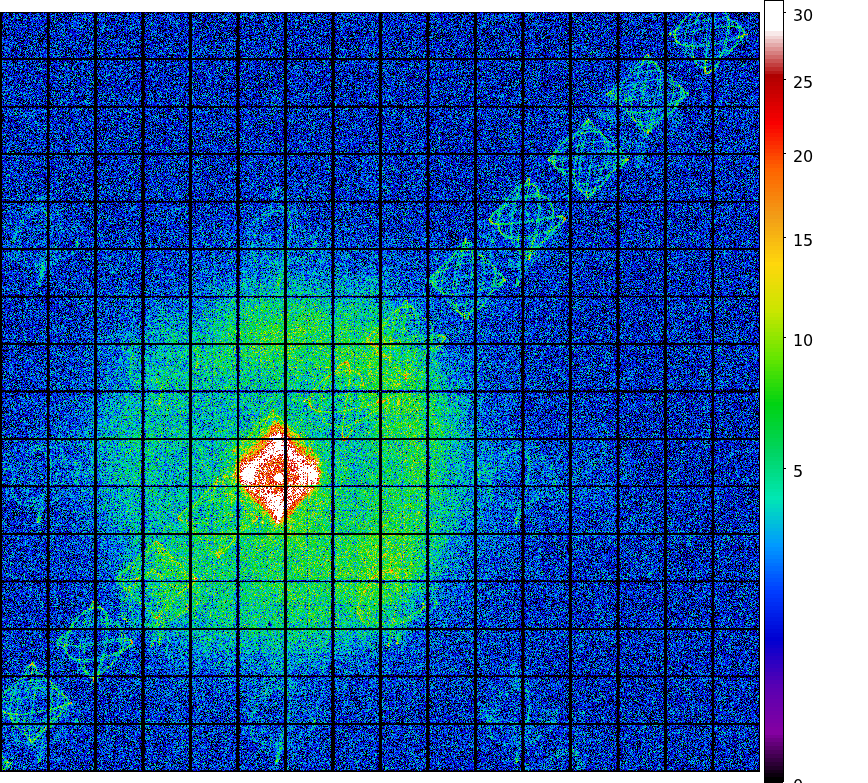
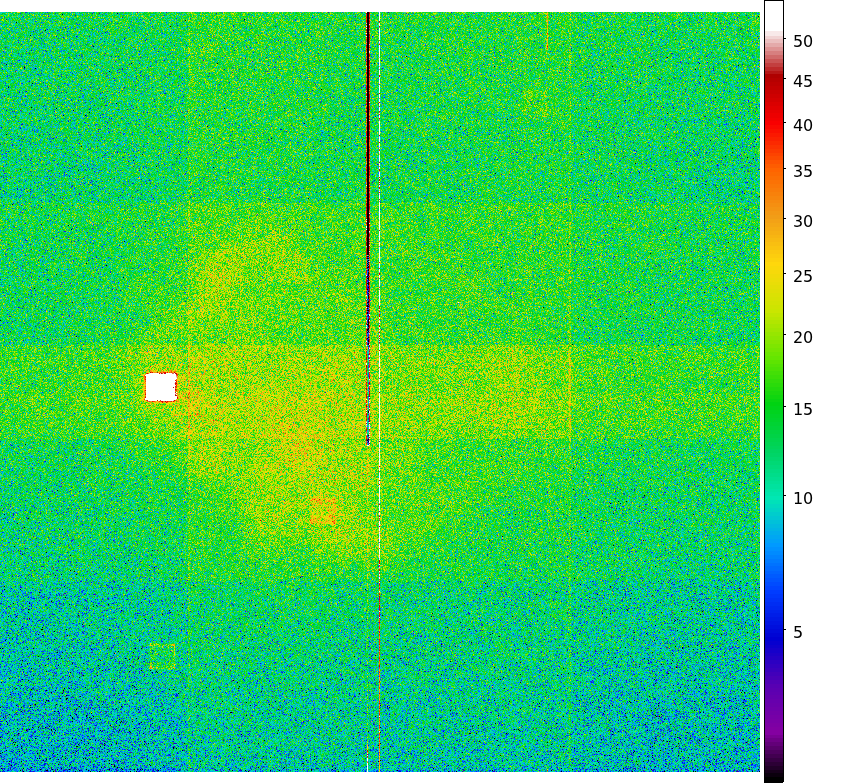
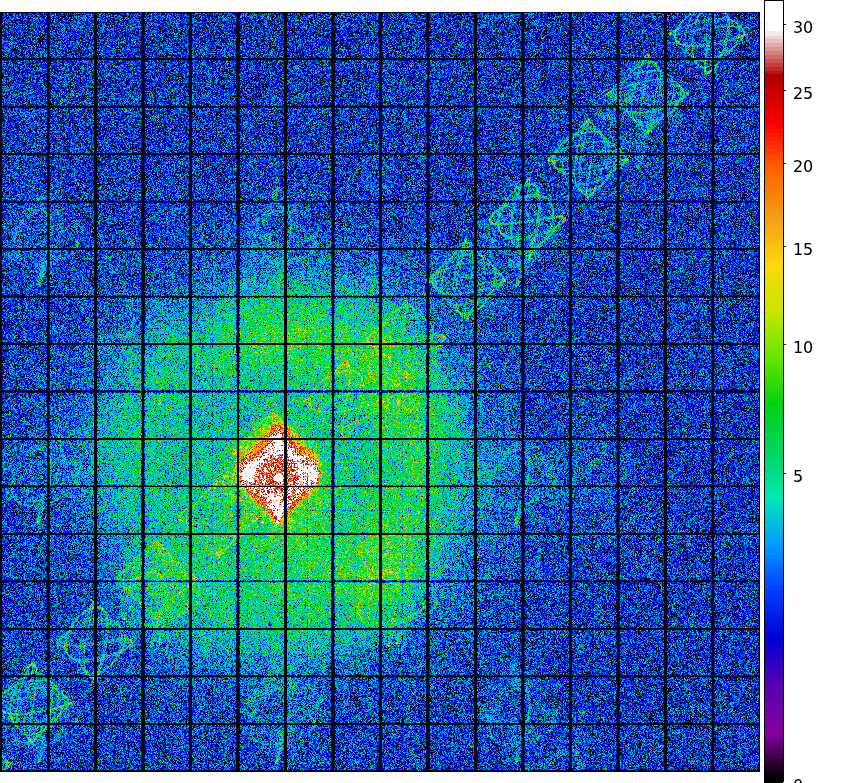
- MAR 2008 dose PNG image
- MAR I3 dose PNG image
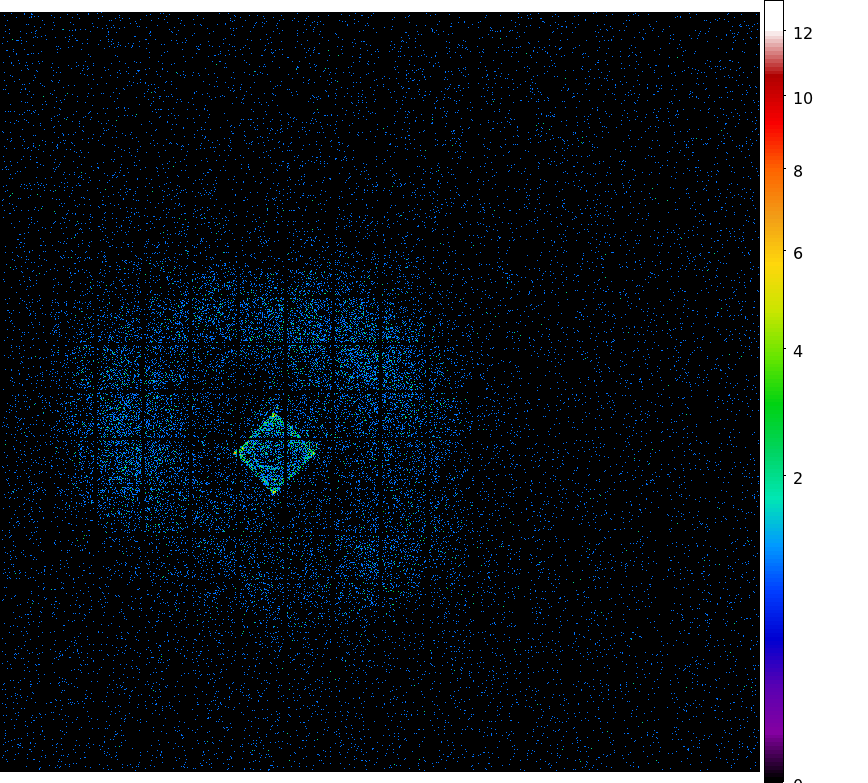
- MAR S3 dose PNG image
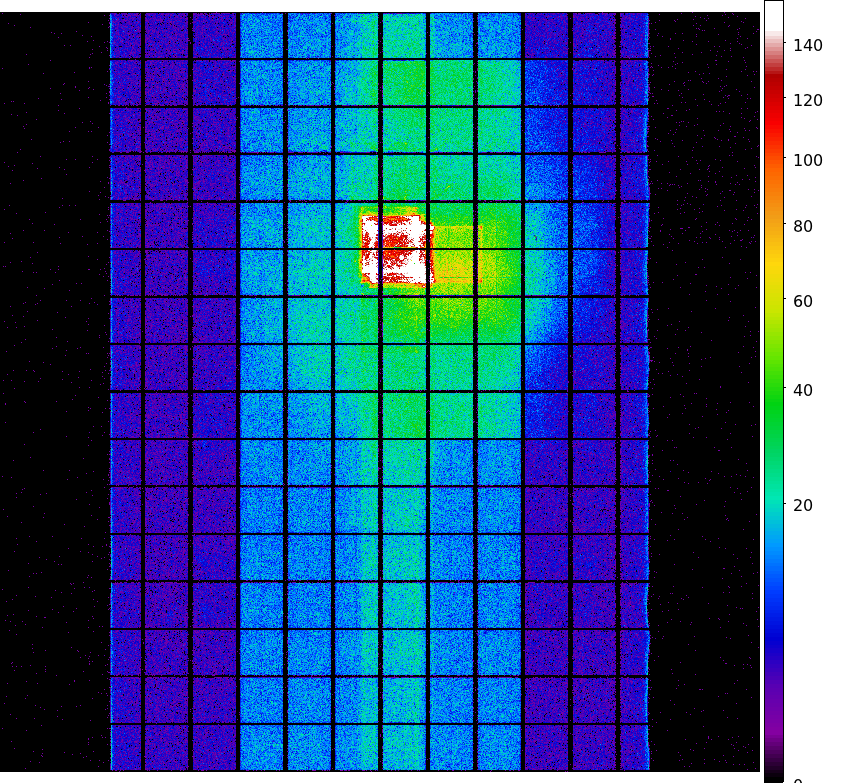
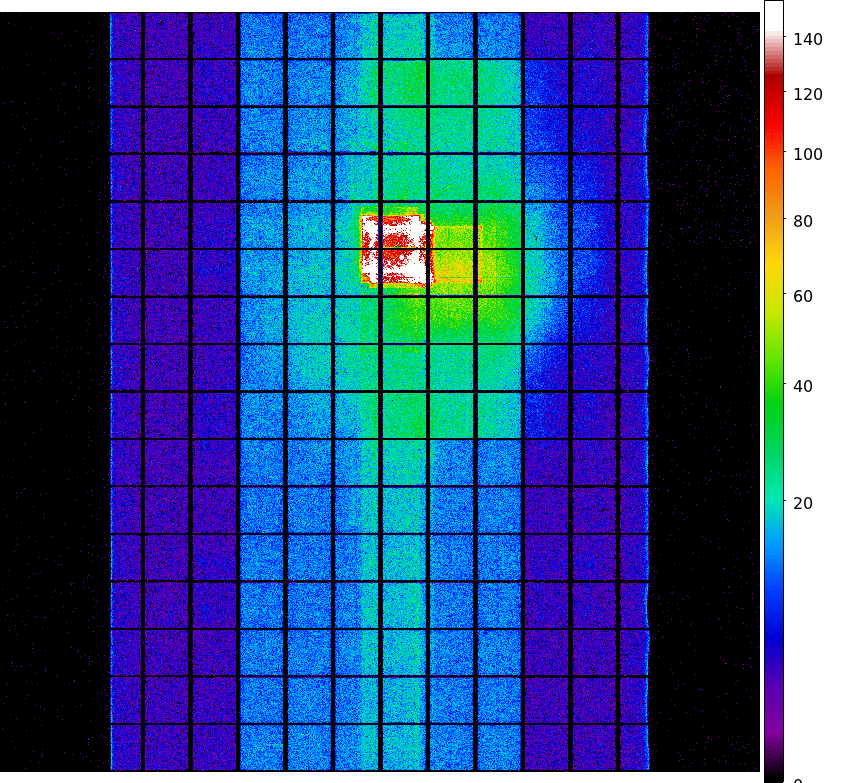
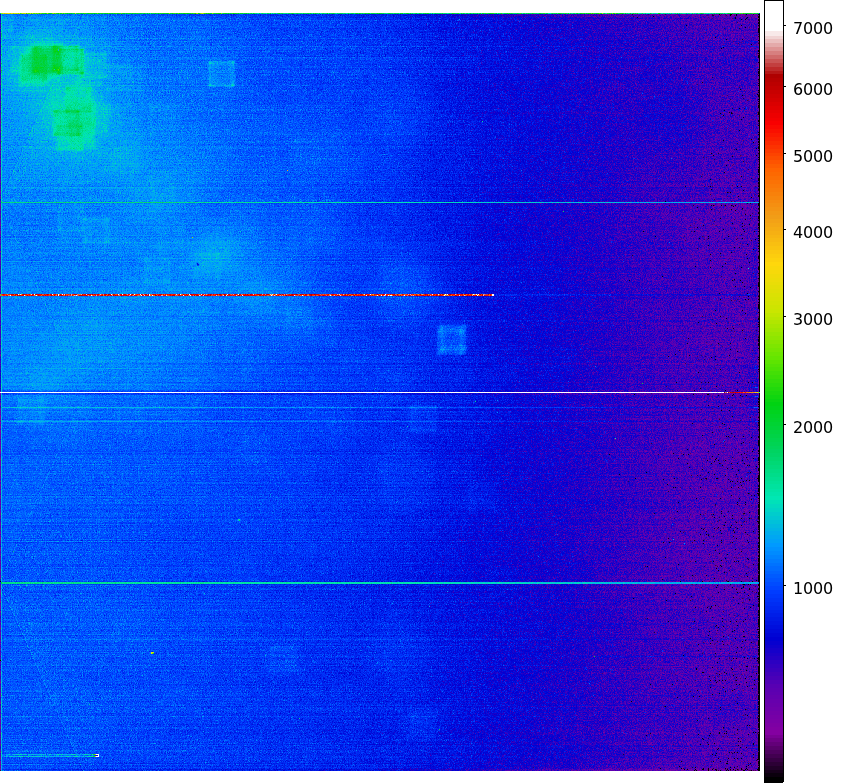
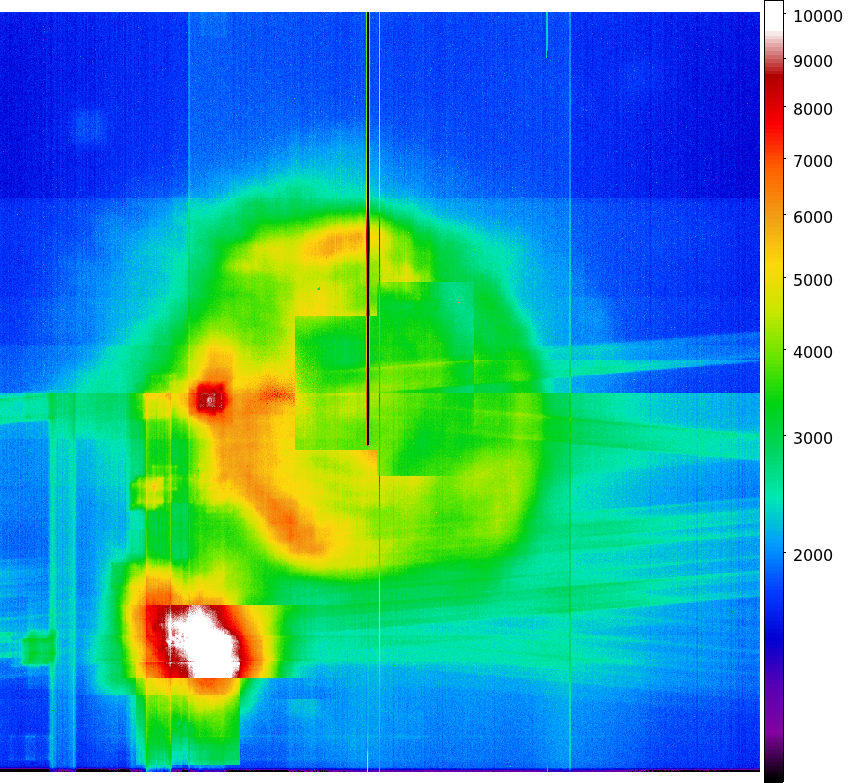
- TOTAL JUL 1999 - MAR 2008 dose PNG image
- TOTAL I3 dose PNG image
- TOTAL S3 dose PNG image


)
)
)
)
)
)
)
)
)
)
)
)
)
)
)
)
)
)
)
)
)