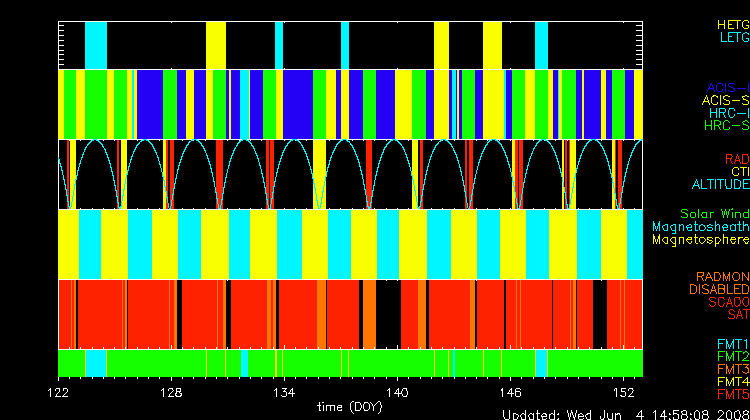

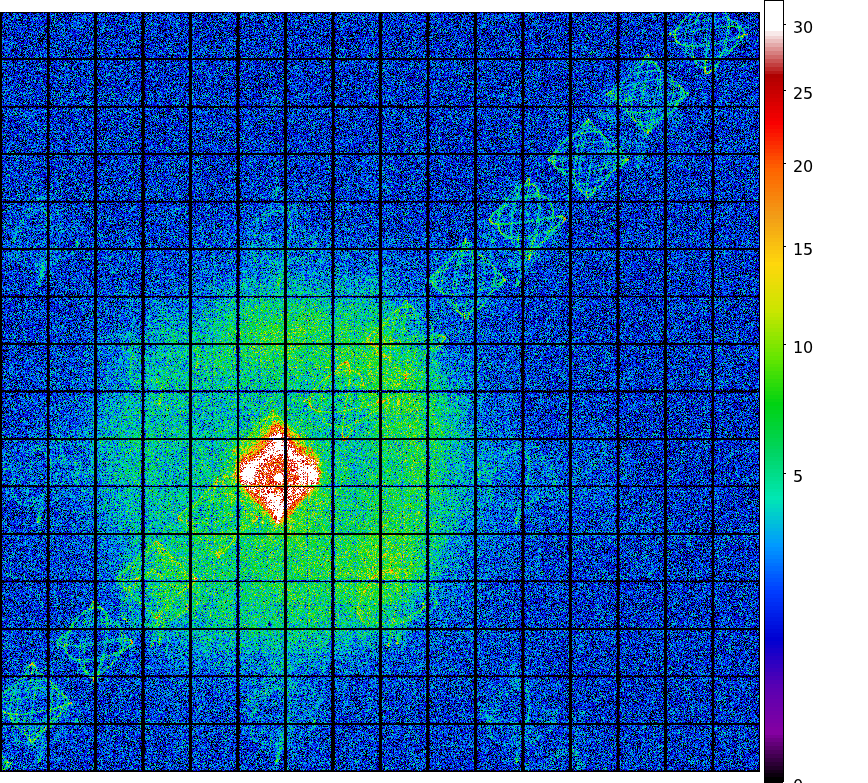
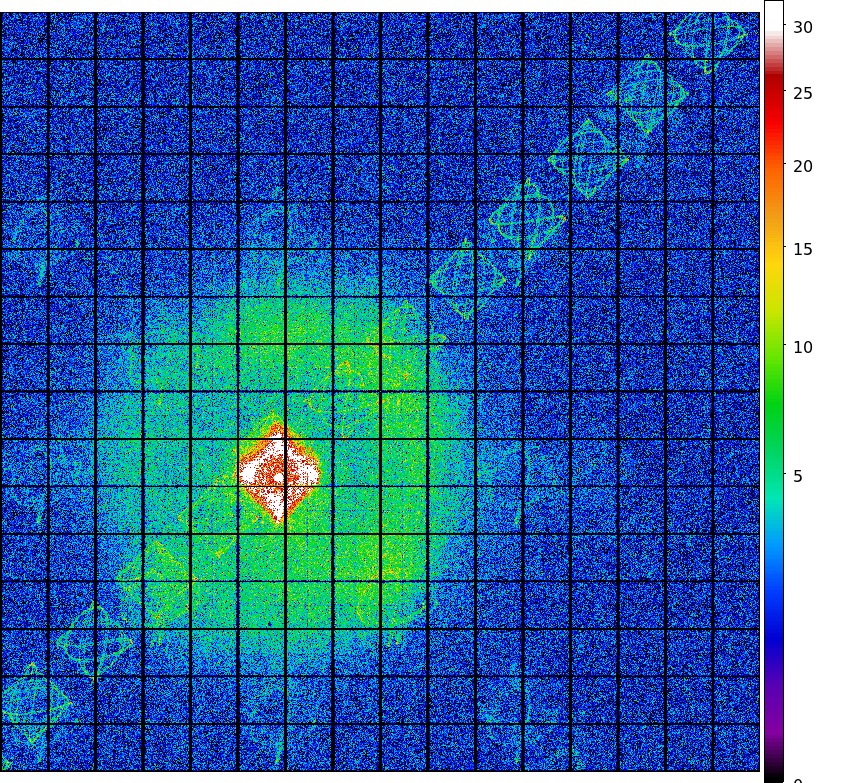
The steps we took to compute the dose map are;
Please check more detail plots at Telemetered Photon Dose Trend page.
Statistics:
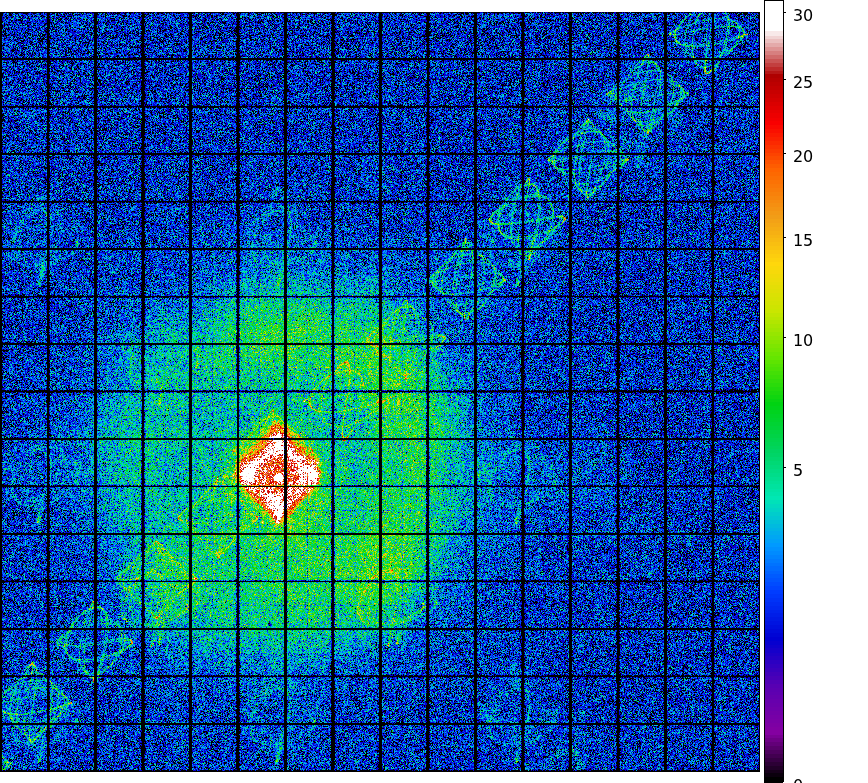
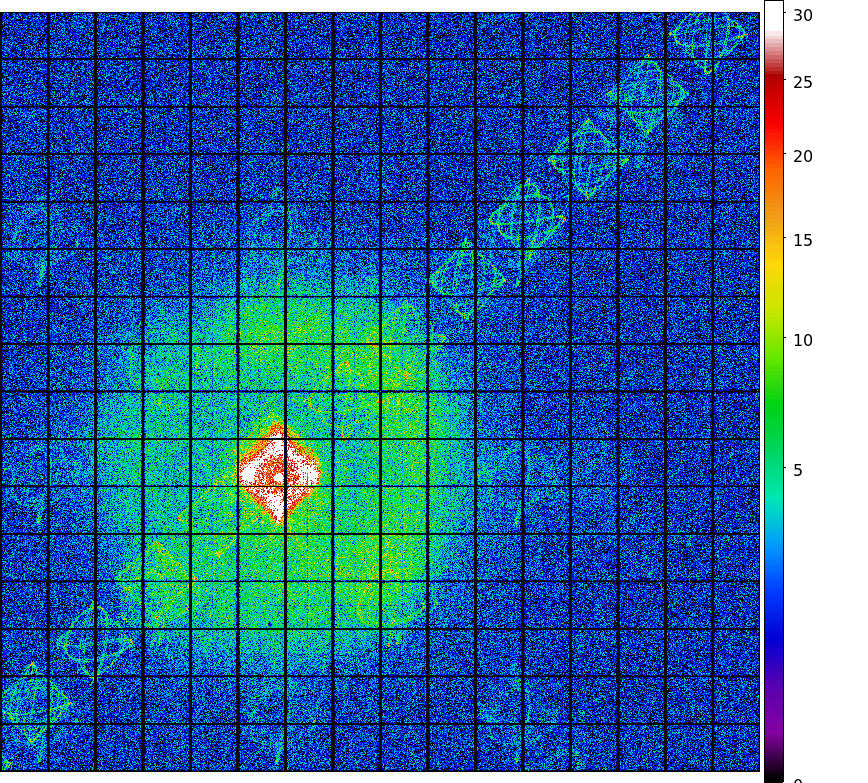
# IMAGE     NPIX        MEAN           RMS              MIN     MAX
ACIS_may08 6004901      9.313          14.48            0.0     779.0

 I2 node 0  262654      11.416515       4.448501        0.0      60.0
 I2 node 1  262654      11.941771       4.719554        0.0     311.0
 I2 node 2  262654      11.750523       4.245479        0.0      86.0
 I2 node 3  262654      11.633235       4.542643        0.0      67.0

 I3 node 0  262654      11.491982       4.722857        0.0      90.0
 I3 node 1  262654      11.724796       11.391458       0.0     248.0
 I3 node 2  262654      10.884781       3.923622        0.0      88.0
 I3 node 3  262654      10.930210       4.029226        0.0     193.0

 I2 node 0  262654      10.313840       3.836398        0.0     422.0
 I2 node 1  262654      10.717775       4.332111        0.0      74.0
 I2 node 2  262654      11.544409       4.683869        0.0      82.0
 I2 node 3  262654      11.226557       4.369981        0.0     323.0

 I3 node 0  262654      15.017360       7.349174        0.0     196.0
 I3 node 1  262654      15.970129       6.080284        0.0     139.0
 I3 node 2  262654      15.398901       4.796085        0.0      58.0
 I3 node 3  262654      14.273475       4.645990        1.0     123.0
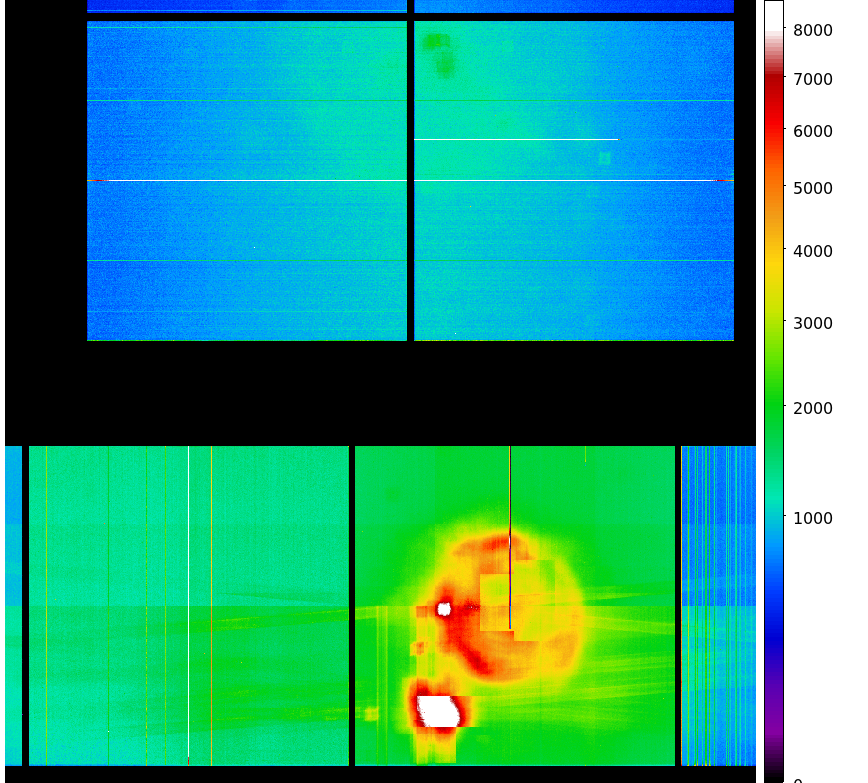
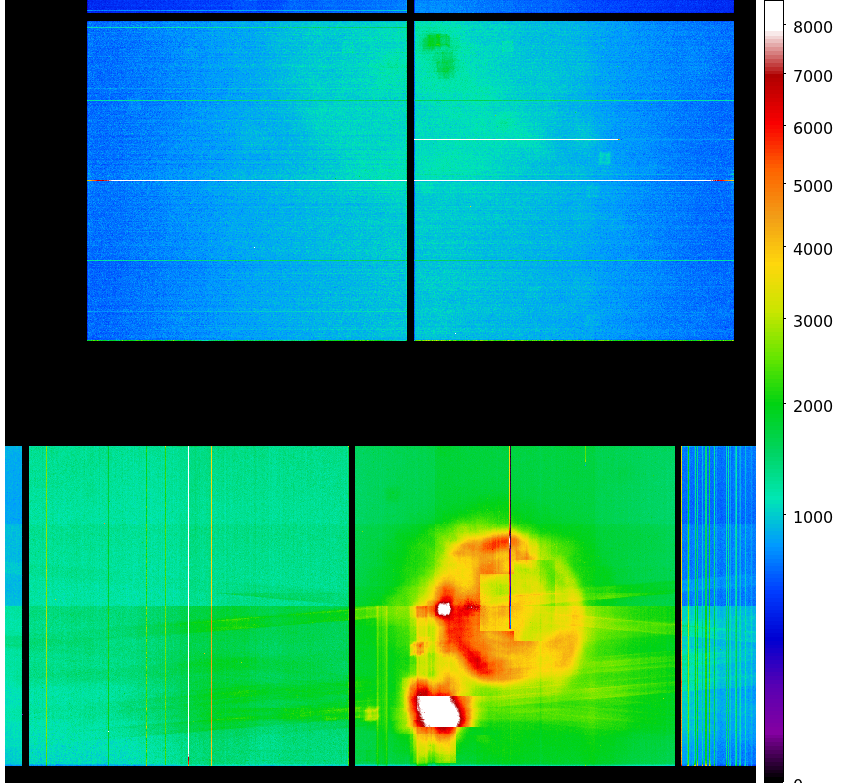
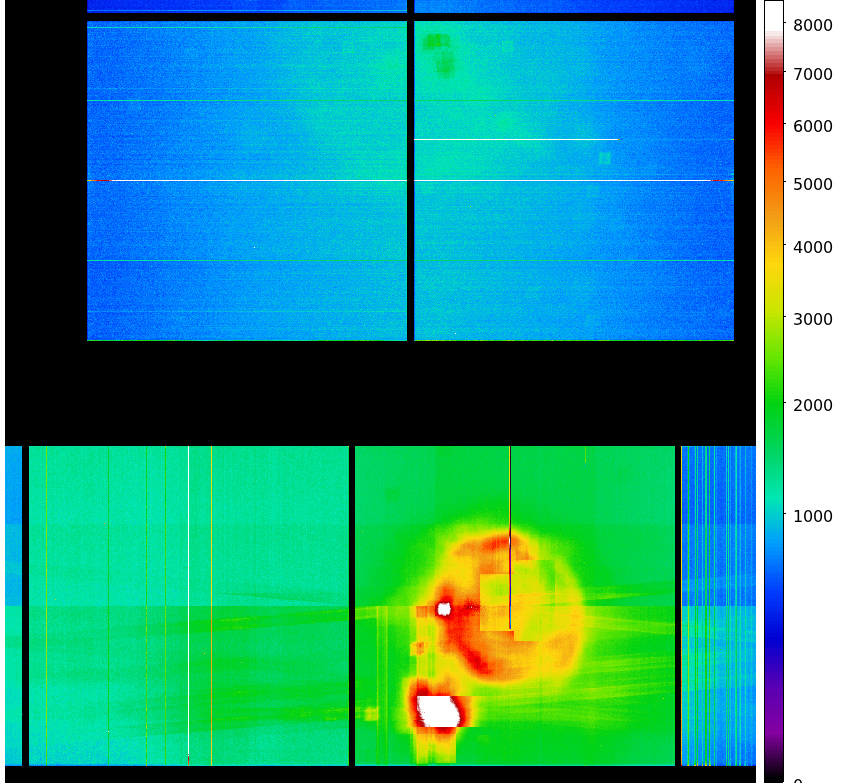
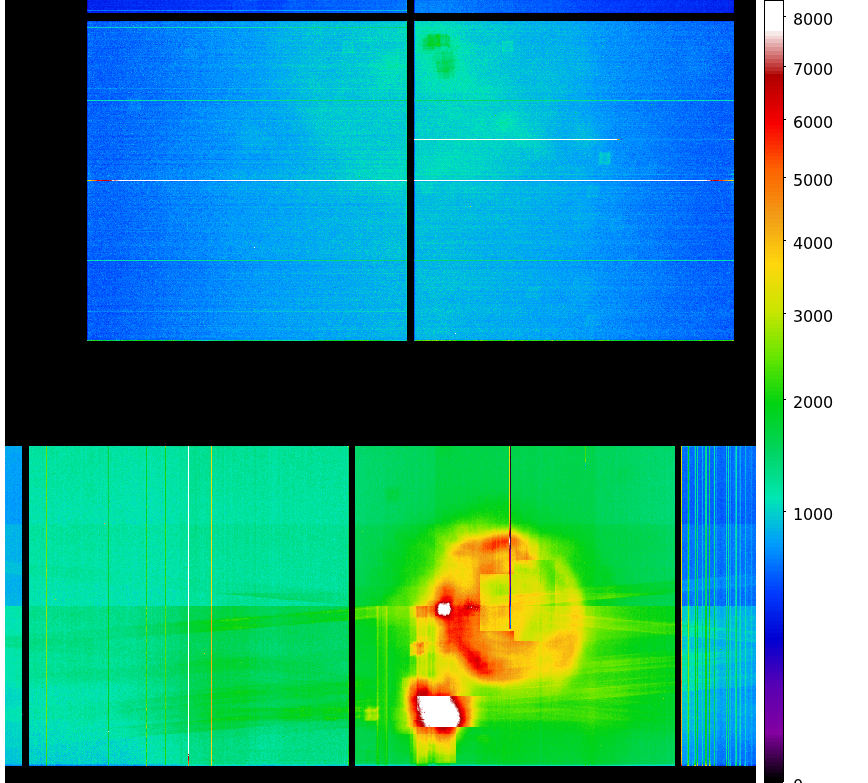
Statistics:
 IMAGE        NPIX      MEAN          RMS              MIN    MAX
ACIS_total  6004901    1144.791         1569.92         0.0    69084.0

 I2 node 0  262654      864.577568      154.260753      0.0     3835.0
 I2 node 1  262654      914.056765      211.000625      0.0     13900.0
 I2 node 2  262654      929.670448      179.267123      0.0     3713.0
 I2 node 3  262654      931.917116      223.413694      0.0     4367.0

 I3 node 0  262654      984.750155      241.716087      0.0     5398.0
 I3 node 1  262654      1020.677528     723.012826      0.0     19211.0
 I3 node 2  262654      906.225636      154.188553      0.0     3809.0
 I3 node 3  262654      894.498753      165.149385      0.0     16610.0

 I2 node 0  262654      1352.217961     170.720061      663.0   12850.0
 I2 node 1  262654      1436.142947     293.105197      694.0   7353.0
 I2 node 2  262654      1609.209988     307.197284      905.0   10485.0
 I2 node 3  262654      1556.824029     236.201548      890.0   18881.0

 I3 node 0  262654      2451.401873     1266.606398     979.0   10831.0
 I3 node 1  262654      3660.924977     1778.574629     0.0     11753.0
 I3 node 2  262654      2661.881564     804.073011      880.0   5942.0
 I3 node 3  262654      1984.912943     323.906359      1037.0  7981.0
|
|
|
|
| Feb 2008 | Nov 2007 | Aug 2007 | May 2007 |
|---|
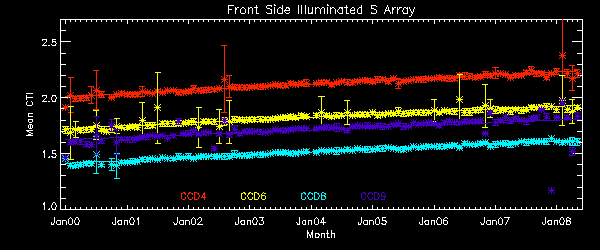
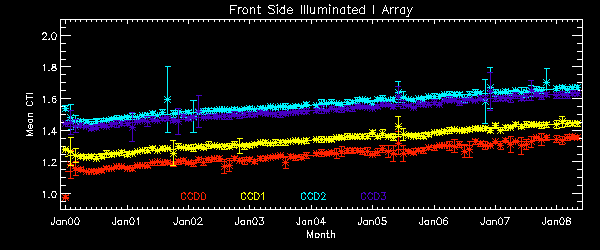
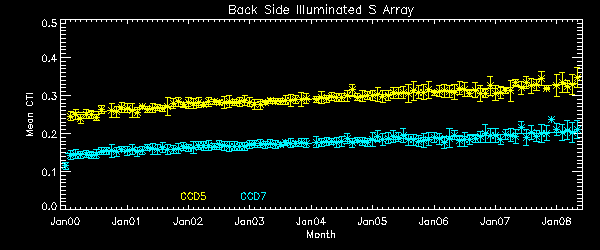
We report CTIs with a refined data definition. CTIs were computed for the temperature
dependency corrected data.
Please see
CTI page
for detailed explanation.
CTI's are computed for Mn K alpha, and defined as slope/intercept x10^4 of row # vs ADU.
Data file here
       The Mean (max) FPT: -115.72 C    std dev: 2.13
               mean width:    0.29 days std dev: 0.79
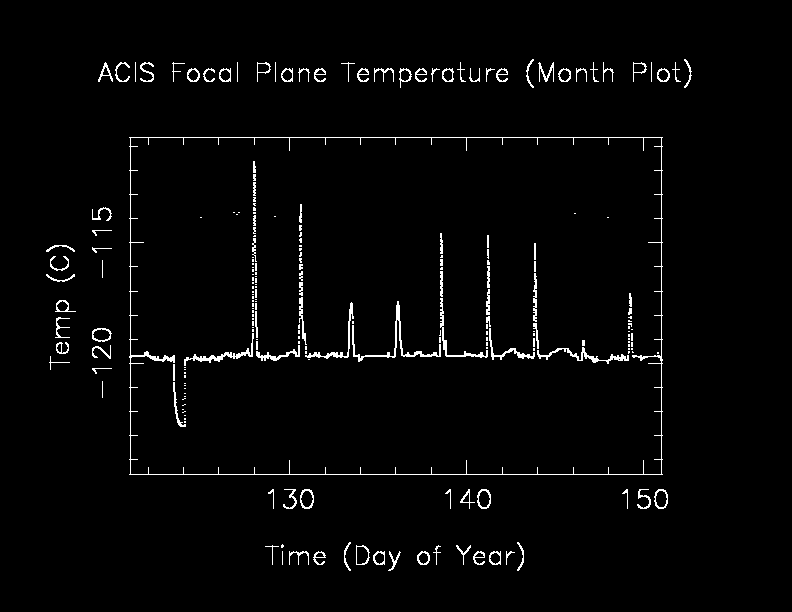

The following is a plot of focal plane temperature and sun angle, earth angle, and altitude.

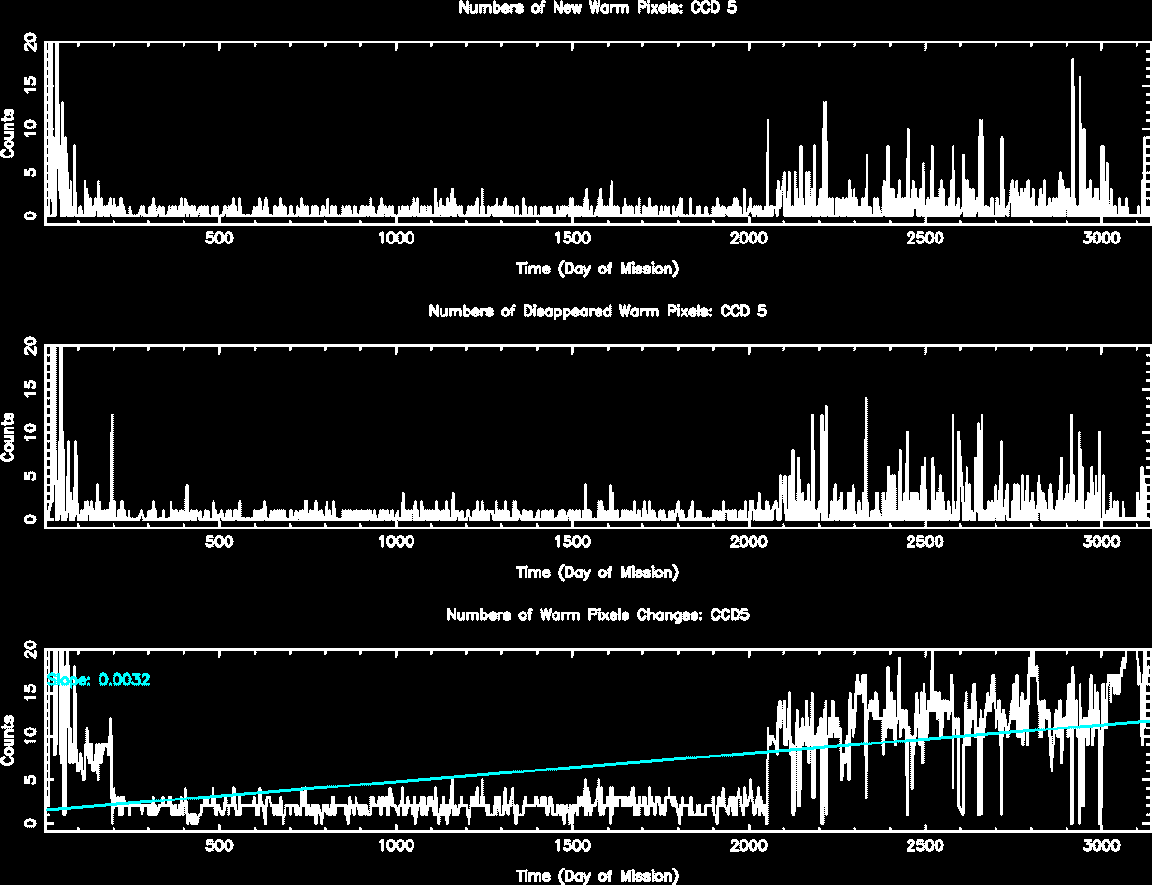
The plots below were generated with a new warm pixel finding script. Please see Acis Bad Pixel Page for details.
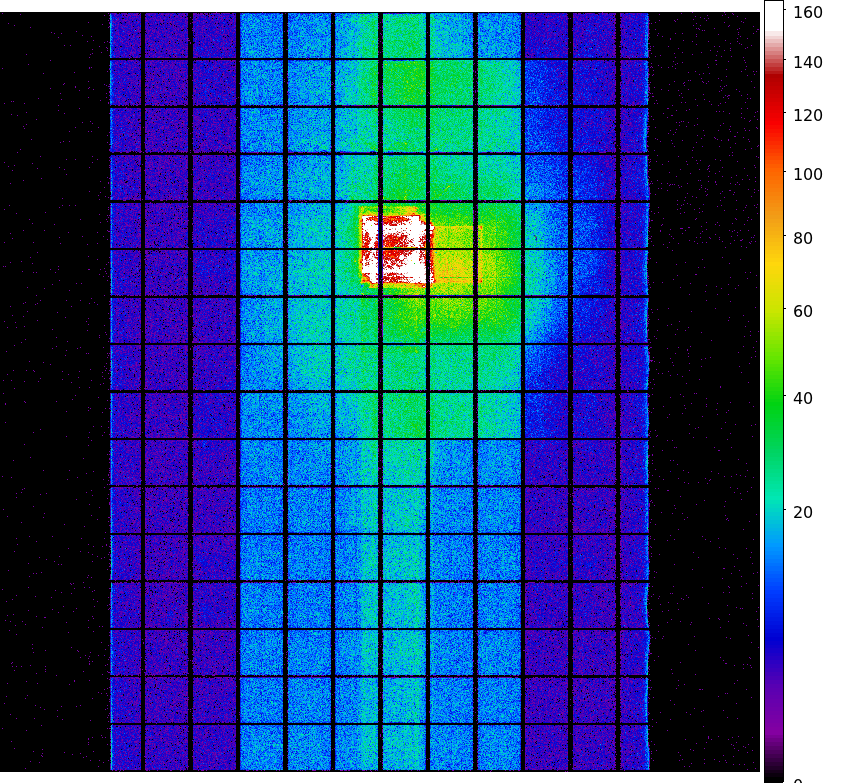
Front Side CCDs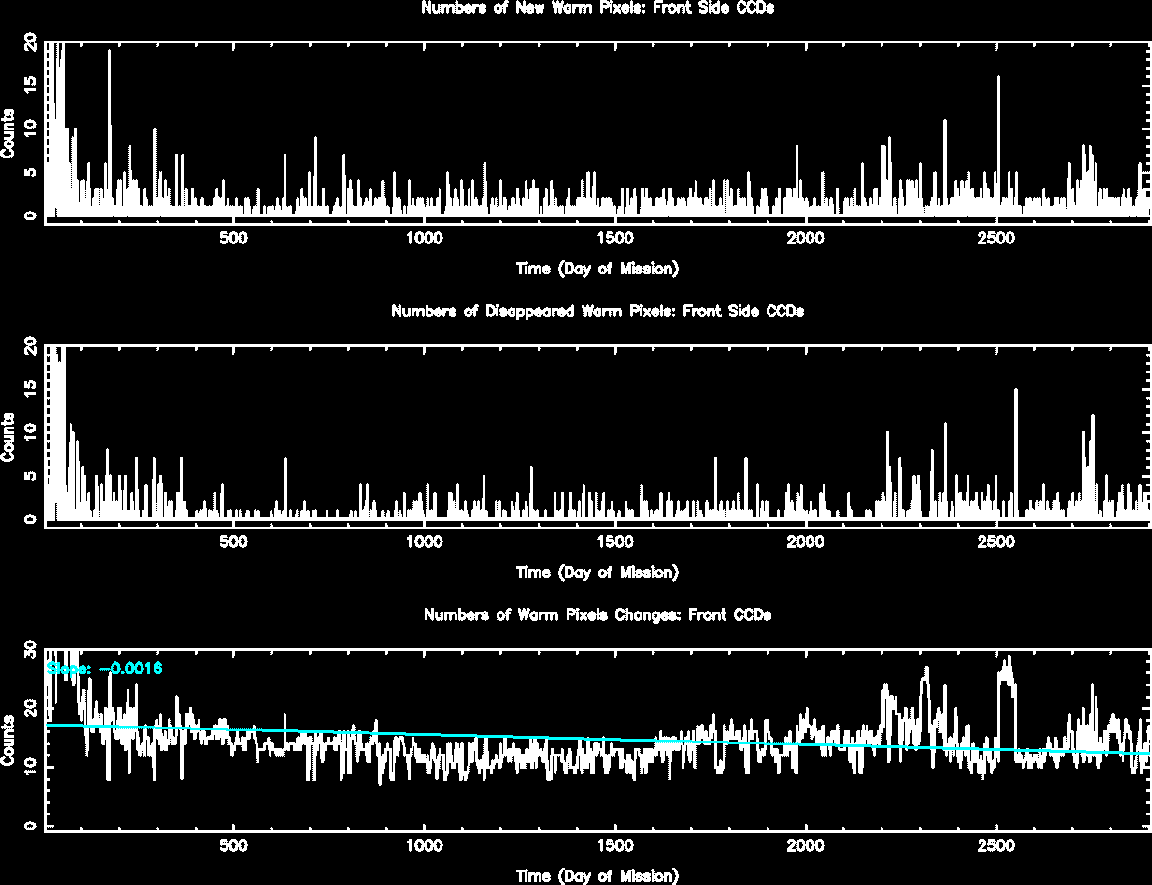
Back Side CCD (CCD5)

| Name | Low (keV) | High(KeV) | Description |
|---|---|---|---|
| SSoft | 0.00 | 0.50 | Super soft photons |
| Soft | 0.50 | 1.00 | Soft photons |
| Med | 1.00 | 3.00 | Moderate energy photons |
| Hard | 3.00 | 5.00 | Hard Photons |
| Harder | 5.00 | 10.00 | Very Hard photons |
| Hardest | 10.00 | Beyond 10 keV |
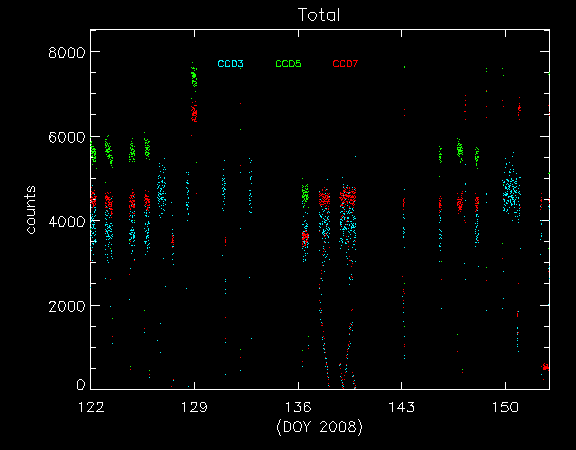
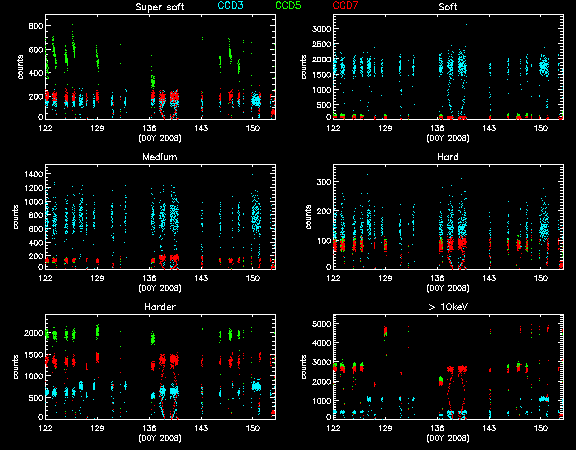
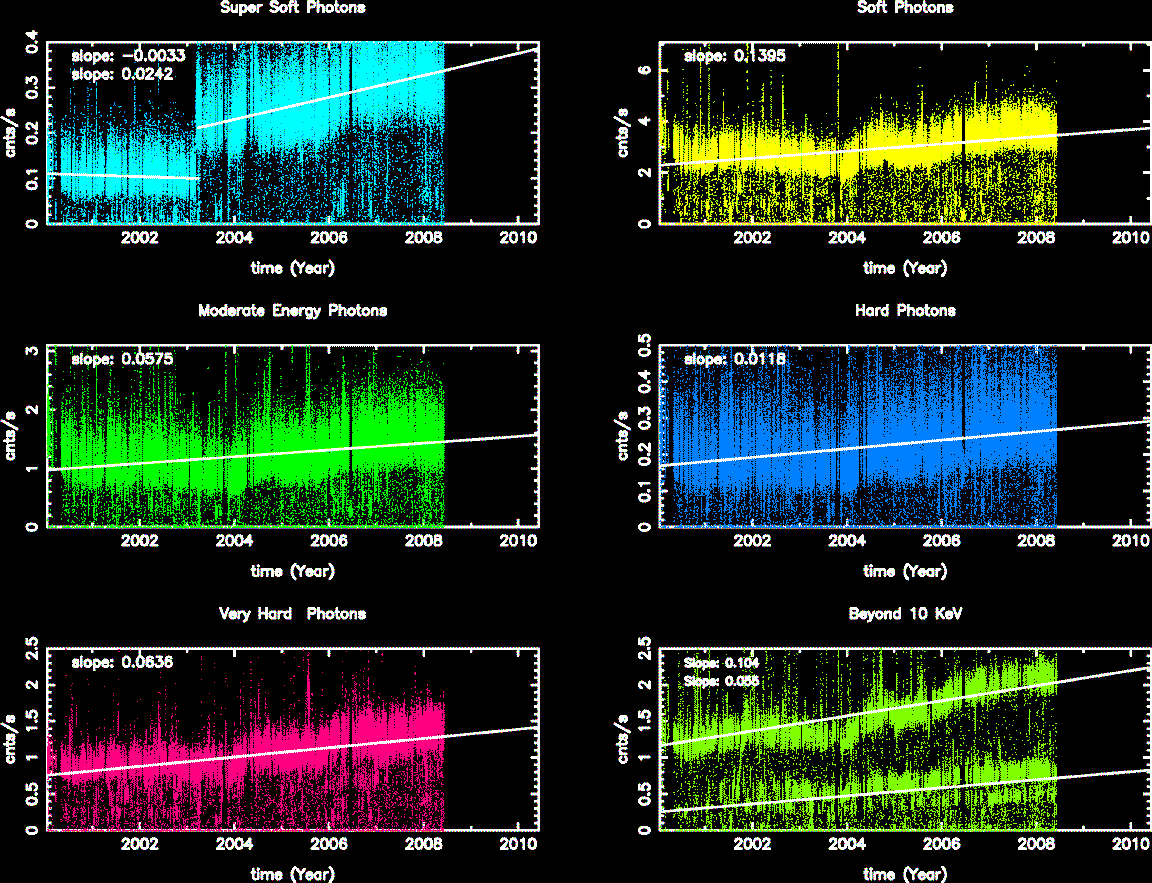
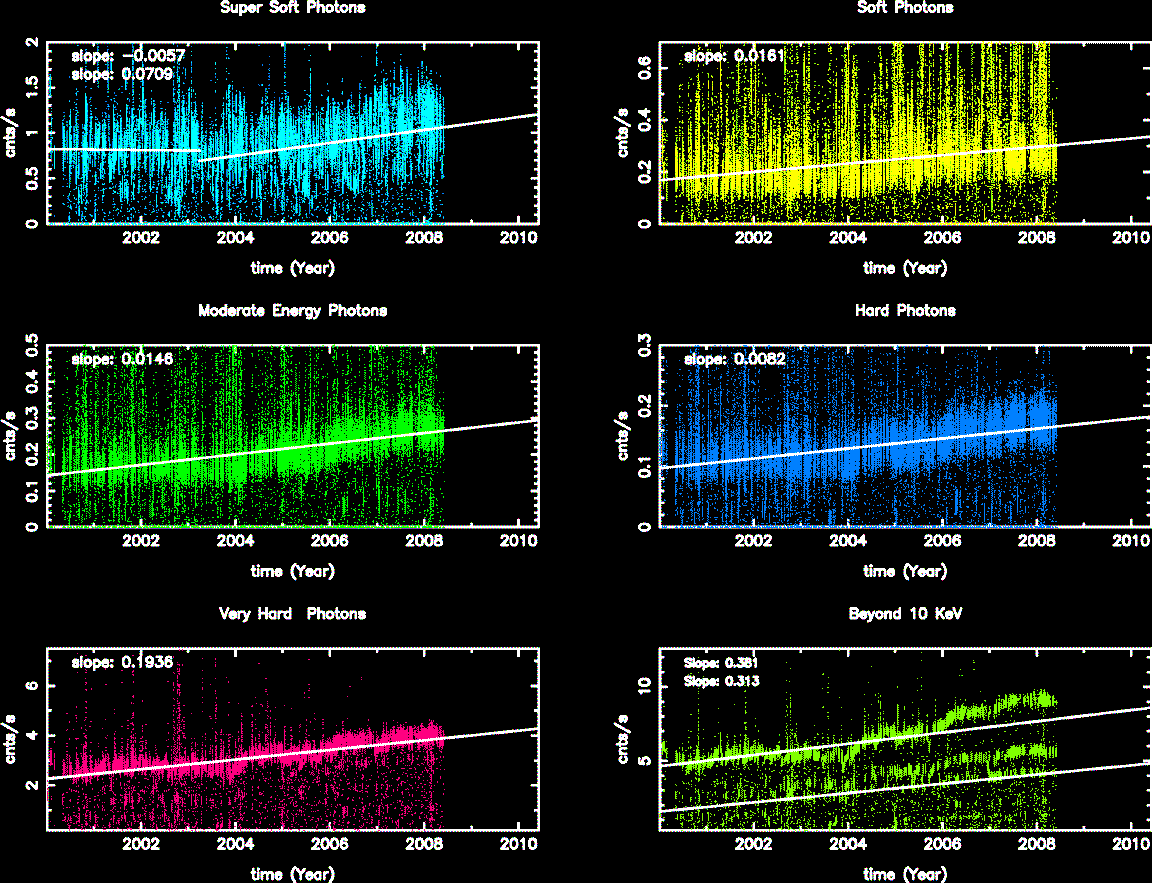
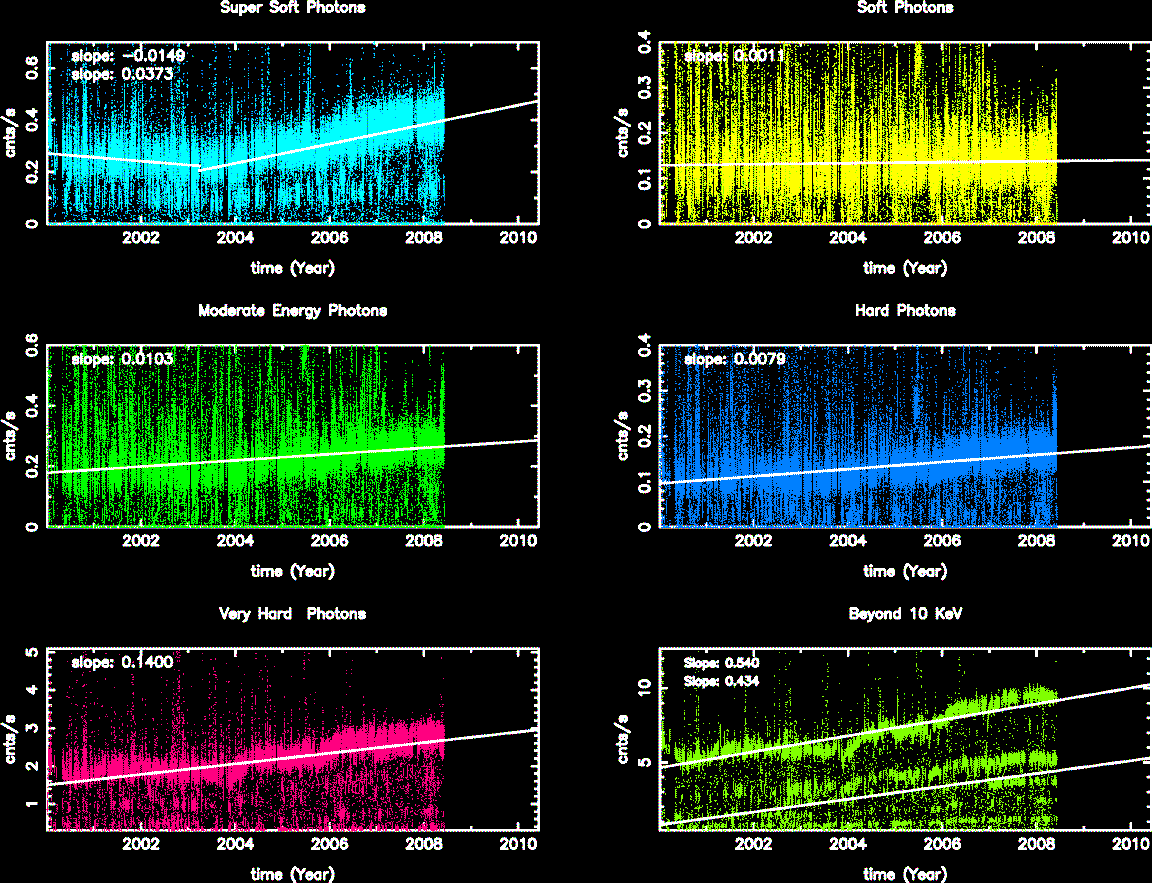
The following three plots show trends of SIB from year 2000. CCDs shown here are CCD3, CCD5, and CCD7. Fitted lines are linear fit after eliminating extreme outliers. For >10 keV plots, 2 lines are fit. One is with a 13 keV filter, and another without.
We collected data from acis histogram mode data, and created trend plots of peak portions and peak widths against time (DOM). The peaks were estimated by fitting a simple Gaussian on three peaks (Al, Ti, and Mn), and the widths were estimated by a width at the half max from the peak.
All histogram data are taken under TIMED and GRADED_HIST mode, SIM position is at an external calibration source position, the focal temperature is around -119.7 C, and parameter settings in aciselec, acistemp are set to about same for all.
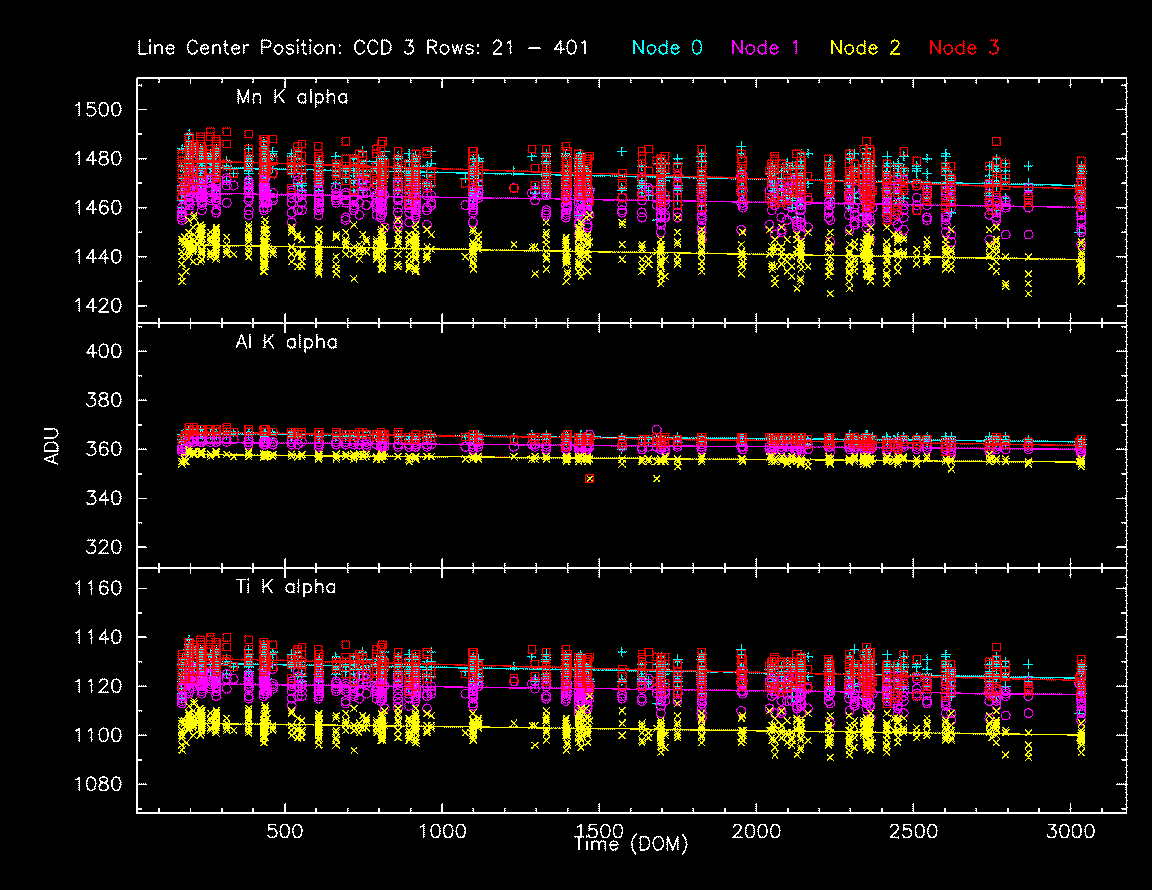
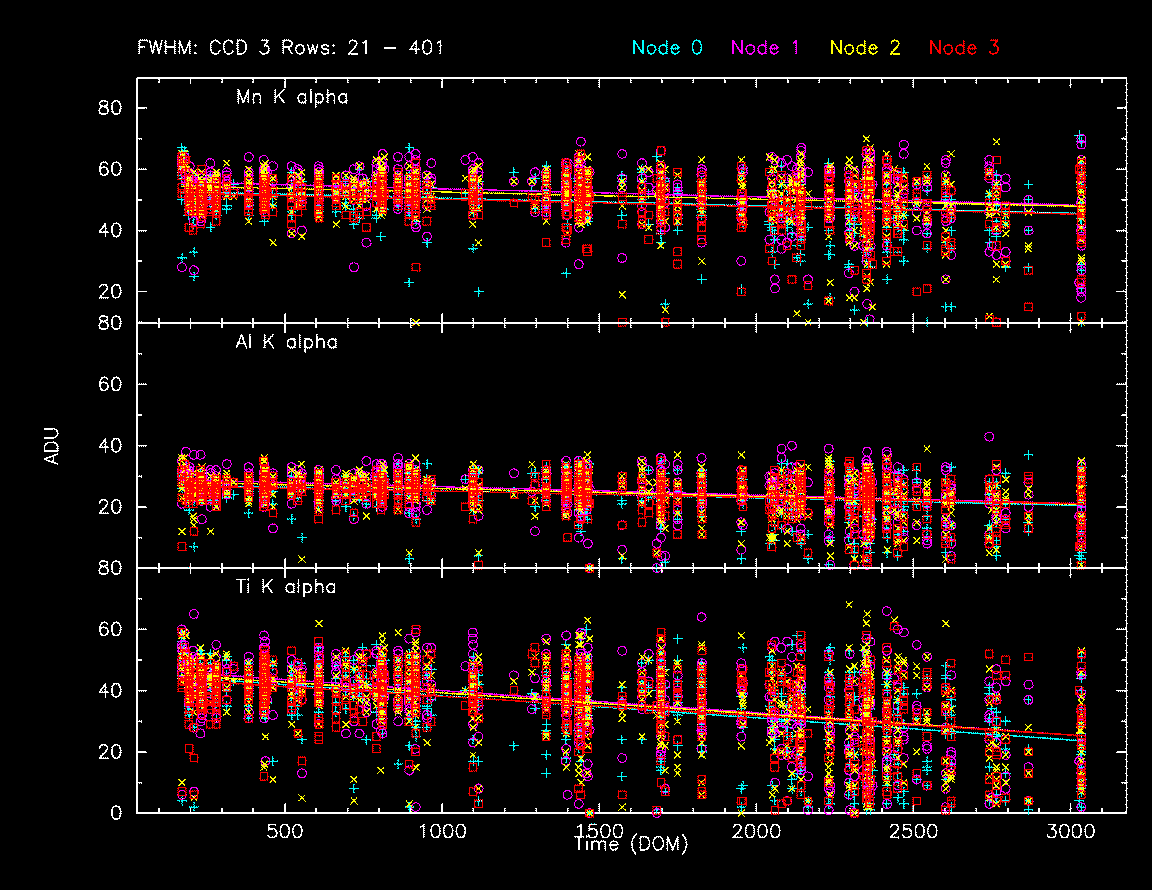
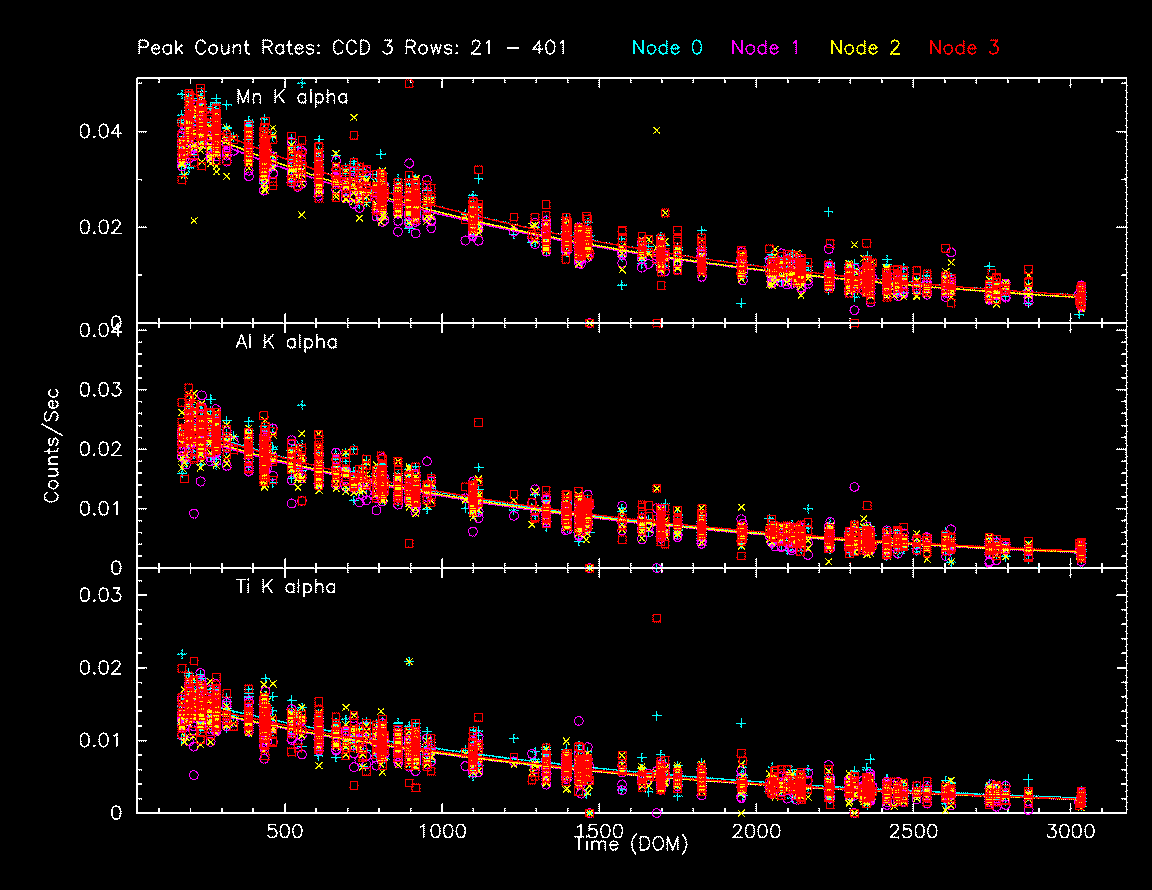
        IMAGE                NPIX      MEAN    STDDEV      MIN       MAX
HRCI_05_2008.fits          16777216   0.022    0.150       0.0        6.0
        IMAGE                NPIX      MEAN    STDDEV      MIN       MAX
HRCI_08_1999_05_2008.fits  16777216   2.596    3.567       0.0       290.0
        IMAGE                NPIX      MEAN    STDDEV      MIN       MAX
HRCS_05_2008.fits          16777216   0.076    0.311       0.0       15.0
        IMAGE                NPIX     MEAN      STDDEV      MIN      MAX
HRCS_08_1999_05_2008.fits  16777216  8.910     17.092       0.0      1548.0
We display a max dose trend plot corrected for events that "pile-up" in the center of the taps due to bad position information.

|
|
|
|
| Feb 2008 | Nov 2007 | Aug 2007 | May 2007 |
|---|
|
|
|
|
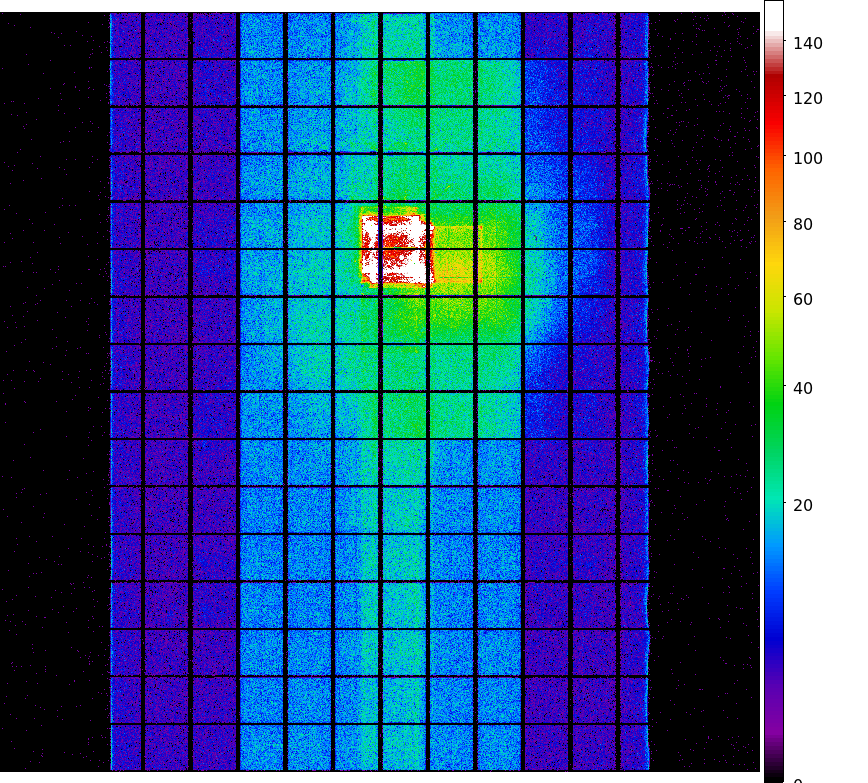
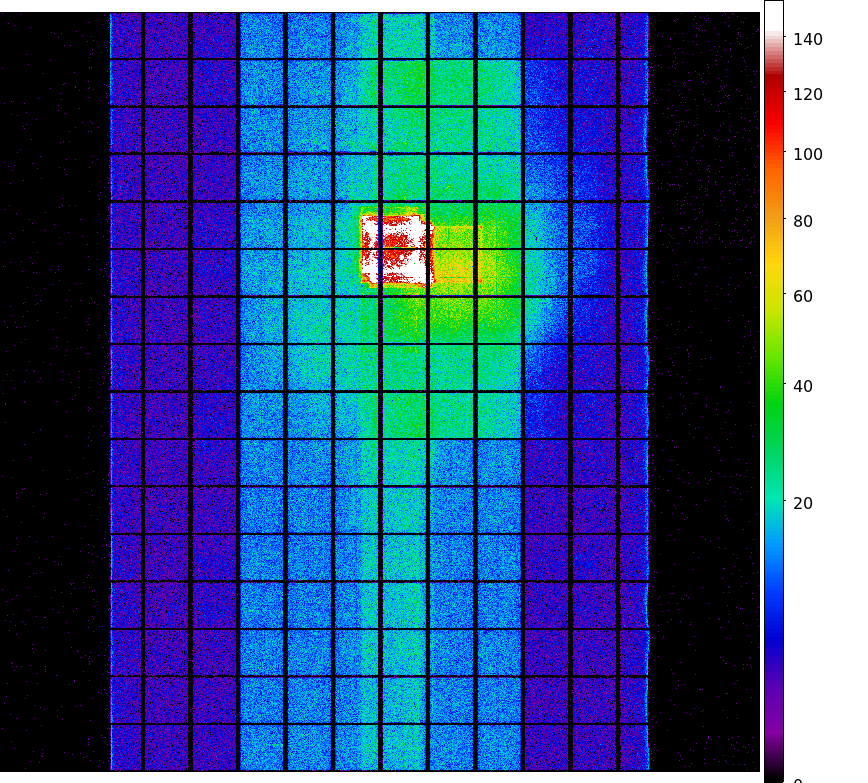
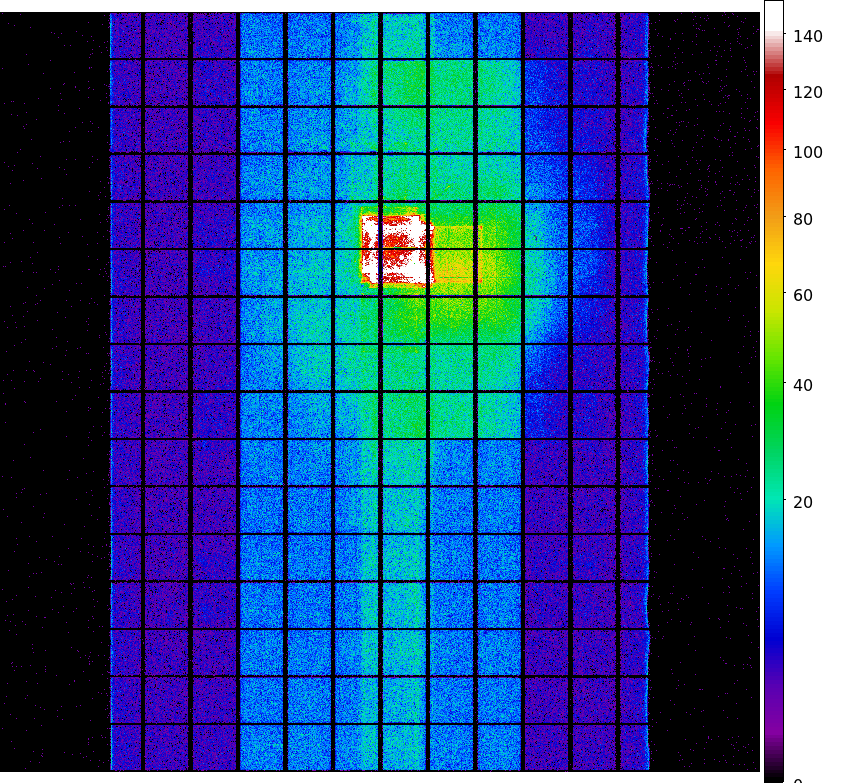
| Feb 2008 | Nov 2007 | Aug 2007 | May 2007 |
|---|

| Previous Quarter | ||||||
| MSID | MEAN | RMS | DELTA/YR | DELTA/YR/YR | UNITS | DESCRIPTION |
| 1DE28AVO | 28.75 | 0.19 | 1.734e+00 | -4.162e+00 | V | DEA +28V INPUT A |
| 1DP28AVO | 28.78 | 0.19 | 1.733e+00 | -4.161e+00 | V | DPA +28V INPUT A |
| Previous Quarter | ||||||
| MSID | MEAN | RMS | DELTA/YR | DELTA/YR/YR | UNITS | DESCRIPTION |
| 5EPHINT | 312.40 | 3.95 | -1.208e+01 | -2.736e+01 | K | EPHIN TEMP |
| Previous Quarter | ||||||
| MSID | MEAN | RMS | DELTA/YR | DELTA/YR/YR | UNITS | DESCRIPTIO N |
| HSTRTGRD1 | -2.96 | 5.144e-02 | 1.772e-01 | -3.994e-01 | K | RT25-RT26: HRMA STRUTS |
| HSTRTGRD2 | -2.36 | 0.16 | 7.993e-01 | -1.572e+01 | K | RT26-RT27: HRMA STRUTS |
| HSTRTGRD3 | -0.27 | 3.644e-02 | -9.145e-04 | 7.215e+00 | K | RT27-RT28: HRMA STRUTS |
| HSTRTGRD4 | 1.80 | 0.15 | -7.556e-01 | 1.482e+01 | K | RT28-RT29: HRMA STRUTS |
| HSTRTGRD5 | 3.14 | 5.338e-02 | -1.615e-01 | -8.184e+00 | K | RT29-RT30: HRMA STRUTS |
| HSTRTGRD6 | 0.64 | 2.795e-02 | -7.284e-02 | 1.610e+00 | K | RT30-RT25: HRMA STRUTS |
| Previous Quarter | ||||||
| MSID | MEAN | RMS | DELTA/YR | DELTA/YR/YR | UNITS | DESCRIPTION |
| HCONEGRD39 | 2.25 | 2.917e-02 | 3.051e-01 | -1.818e+00 | K | RT50-RT51: OBA Cone Panel |
| Previous Quarter | ||||||
| MSID | MEAN | RMS | DELTA/YR | DELTA/YR/YR | UNITS | DESCRIPTION |
| HTFTEGRD6 | -3.68 | 0.24 | 9.171e-01 | 7.977e+00 | K | RT63-RT61: TFTE Cone |
| Previous Quarter | ||||||
| MSID | MEAN | RMS | DELTA/YR | DELTA/YR/YR | UNITS | DESCRIPTION |
| ECNV1V | 14.89 | 3.176e-03 | -1.478e-03 | 4.224e-02 | V | CONV 1 +15V OUTPUT |
| ECNV2V | 14.83 | 8.600e-03 | -3.101e-03 | 1.446e-01 | V | CONV 2 +15V OUTPUT |
| Previous Quarter | ||||||
| MSID | MEAN | RMS | DELTA/YR | DELTA/YR/YR | UNITS | DESCRIPTION |
| AWD3CV5V | 5.31 | 3.253e-03 | -1.504e-02 | -1.195e-01 | V | WDE-3 +5V CONVERTER VOLTAGE |
| ELBV | 29.53 | 0.21 | -2.575e+00 | 4.714e+00 | V | LOAD BUS VOLTAGE |
| OHRMAPWR | 61.66 | 1.23 | 1.203e+01 | -5.455e+01 | W | HRMA COMPUTED TOTAL POWER |
| OOBAPWR | 59.51 | 4.08 | 1.903e+01 | -2.162e+02 | W | OBA COMPUTED TOTAL POWER |
| Previous Quarter | ||||||
| MSID | MEAN | RMS | DELTA/YR | DELTA/YR/YR | UNITS | DESCRIPTION |
| OHRTHR05 | 294.71 | 1.431e-03 | 3.843e-03 | 1.619e-01 | K | RT 13: HRMA AFT HEATER PLATE |
| OHRTHR22 | 295.26 | 1.101e-03 | -7.499e-03 | 2.131e-02 | K | RT 6: HRMA FOWARD APERTURE PLATE |
| OHRTHR24 | 294.73 | 1.776e-03 | -1.802e-02 | 8.468e-02 | K | RT 12: HRMA AFT HEATER PLATE |
| OHRTHR46 | 295.27 | 1.564e-03 | -1.335e-02 | 1.107e-01 | K | RT 7: HRMA FORWARD APERTURE PLATE |
| Previous Quarter | ||||||
| MSID | MEAN | RMS | DELTA/YR | DELTA/YR/YR | UNITS | DESCRIPTION |
| 4RT590T | 288.21 | 0.98 | -4.129e+00 | -3.561e+00 | K | RT 590 - STRUT TEMP |
| 
|

| Year | Month | |||||||||||
|---|---|---|---|---|---|---|---|---|---|---|---|---|
| 1999 | Jul | Aug | Sep | Oct | Nov | Dec | ||||||
| 2000 | Jan | Feb | Mar | Apr | May | Jun | Jul | Aug | Sep | Oct | Nov | Dec |
| 2001 | Jan | Feb | Mar | Apr | May | Jun | Jul | Aug | Sep | Oct | Nov | Dec |
| 2002 | Jan | Feb | Mar | Apr | May | Jun | Jul | Aug | Sep | Oct | Nov | Dec |
| 2003 | Jan | Feb | Mar | Apr | May | Jun | Jul | Aug | Sep | Oct | Nov | Dec |
| 2004 | Jan | Feb | Mar | Apr | May | Jun | Jul | Aug | Sep | Oct | Nov | Dec |
| 2005 | Jan | Feb | Mar | Apr | May | Jun | Jul | Aug | Sep | Oct | Nov | Dec |
| 2006 | Jan | Feb | Mar | Apr | May | Jun | Jul | Aug | Sep | Oct | Nov | Dec |
| 2007 | Jan | Feb | Mar | Apr | May | Jun | Jul | Aug | Sep | Oct | Nov | Dec |
| 2008 | Jan | Feb | Mar | Apr | ||||||||