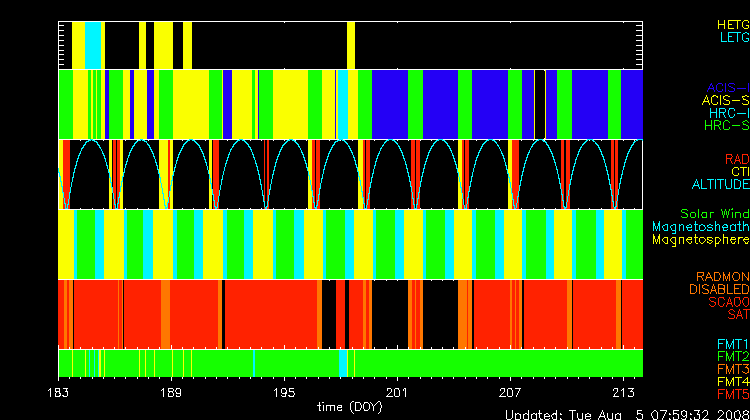

The steps we took to compute the dose map are;
Please check more detail plots at Telemetered Photon Dose Trend page.
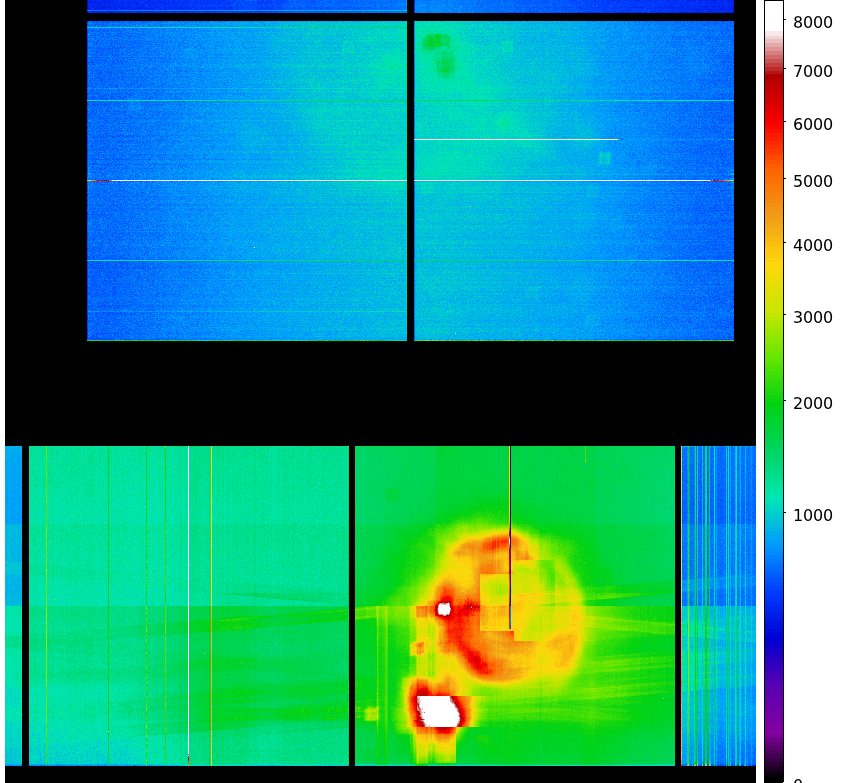
Statistics:
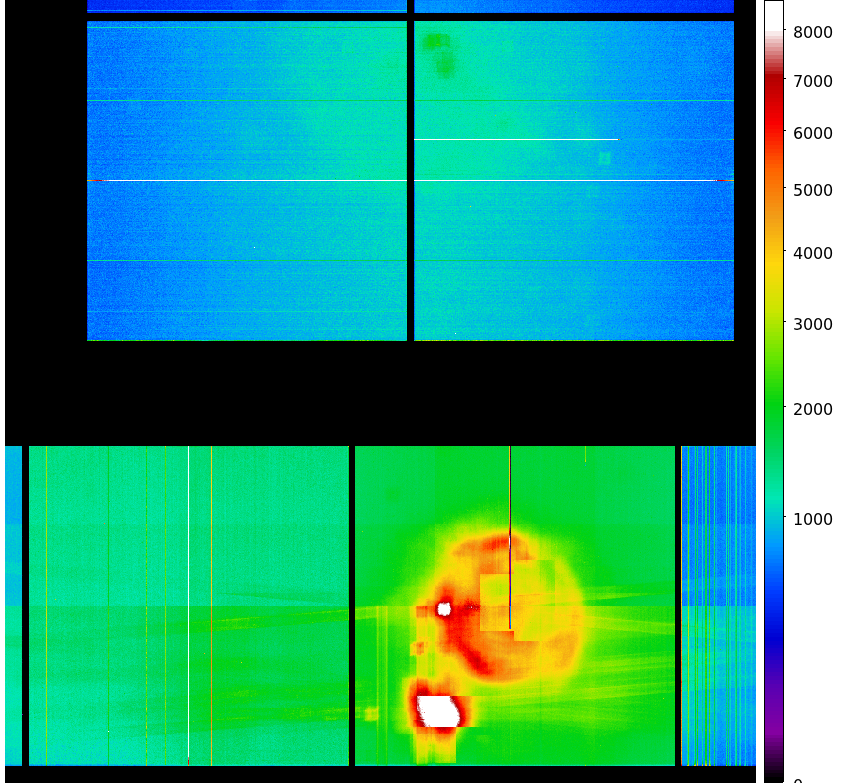
# IMAGE     NPIX        MEAN           RMS              MIN     MAX
ACIS_jul08 6004901      10.71          20.84            0.0     26121.0

 I2 node 0  262654      12.333550       4.928884        0.0      77.0
 I2 node 1  262654      13.094889       5.128260        0.0     339.0
 I2 node 2  262654      12.747208       4.423503        0.0      91.0
 I2 node 3  262654      12.772314       51.617686       0.0     26121.0

 I3 node 0  262654      12.350268       4.507912        0.0      62.0
 I3 node 1  262654      12.984821       12.012177       0.0     306.0
 I3 node 2  262654      11.923514       4.183553        0.0     106.0
 I3 node 3  262654      11.896450       4.328989        0.0     235.0

 I2 node 0  262654      15.678064       15.805902       0.0     5221.0
 I2 node 1  262654      16.371160       6.511526        1.0     104.0
 I2 node 2  262654      17.529404       7.998889        1.0     121.0
 I2 node 3  262654      16.362616       6.097565        1.0     522.0

 I3 node 0  262654      14.221592       8.701747        0.0     188.0
 I3 node 1  262654      14.178521       5.095204        0.0     164.0
 I3 node 2  262654      14.718761       6.279708        1.0      92.0
 I3 node 3  262654      14.479599       8.489646        1.0     108.0
Statistics:
 IMAGE        NPIX      MEAN          RMS              MIN    MAX
ACIS_total  6004901    1166.35          1597.88         0.0    70621.0

 I2 node 0  262654      889.154575      158.990382      0.0     3976.0
 I2 node 1  262654      940.067057      217.353507      0.0     14579.0
 I2 node 2  262654      955.094158      184.567672      0.0     8341.0
 I2 node 3  262654      957.179253      235.039651      0.0     27208.0

 I3 node 0  262654      1010.300564     246.626177      0.0     5452.0
 I3 node 1  262654      1047.776291     746.777148      0.0     19828.0
 I3 node 2  262654      931.112909      158.616929      0.0     3937.0
 I3 node 3  262654      919.359047      170.054859      0.0     17085.0

 I2 node 0  262654      1382.543700     175.893725      676.0   12888.0
 I2 node 1  262654      1467.999432     299.678701      703.0   7553.0
 I2 node 2  262654      1642.329845     311.346874      921.0   10739.0
 I2 node 3  262654      1588.159343     237.624445      909.0   19911.0

 I3 node 0  262654      2481.423916     1270.813046     992.0   10863.0
 I3 node 1  262654      3691.835146     1780.902619     0.0     11783.0
 I3 node 2  262654      2691.999031     806.066839      893.0   6028.0
 I3 node 3  262654      2013.506668     327.480538      1056.0  8045.0
|
|
|
|
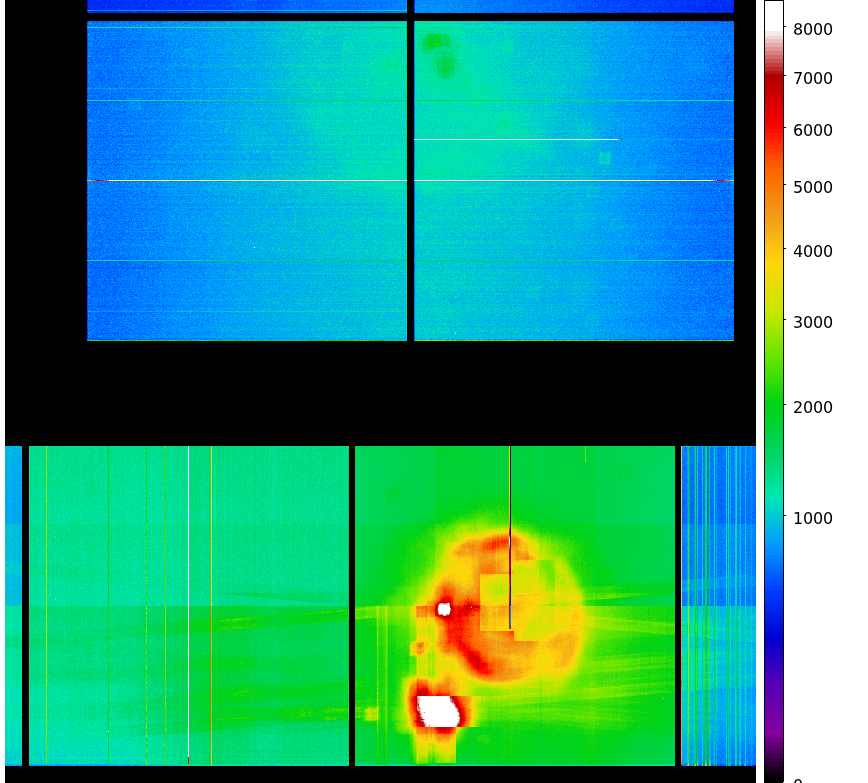
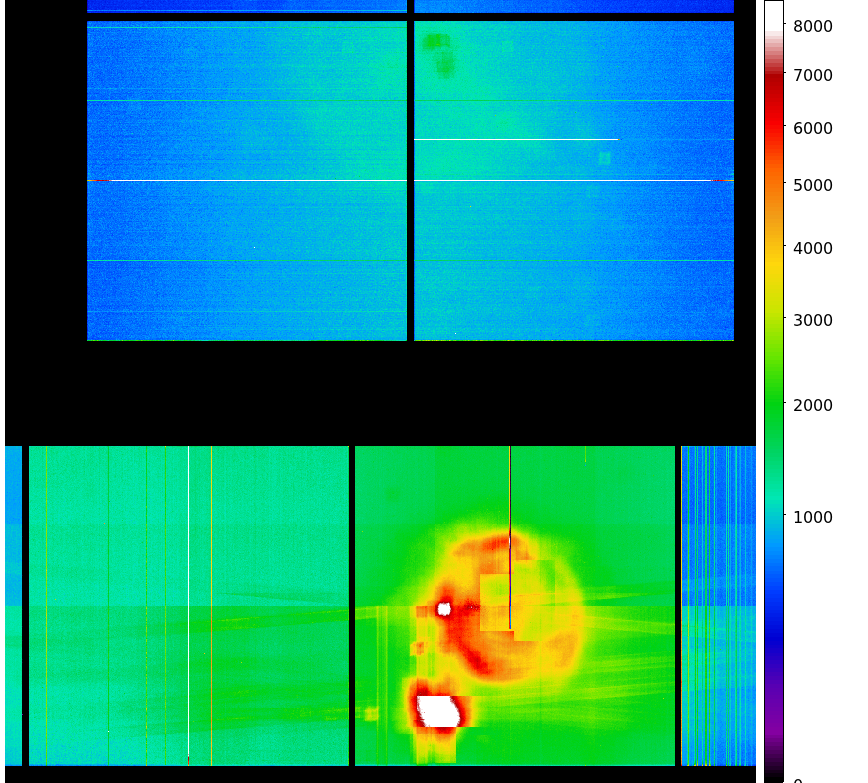
| Apr 2008 | Jan 2008 | Oct 2007 | Jul 2007 |
|---|
We report CTIs with a refined data definition. CTIs were computed for the temperature
dependency corrected data.
Please see
CTI page
for detailed explanation.
CTI's are computed for Mn K alpha, and defined as slope/intercept x10^4 of row # vs ADU.
Data file here
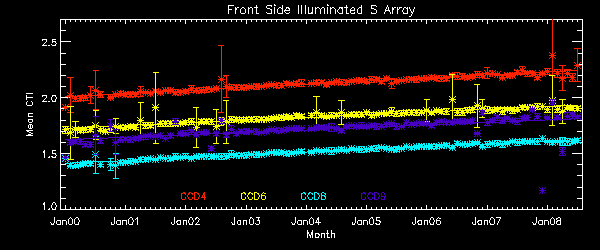
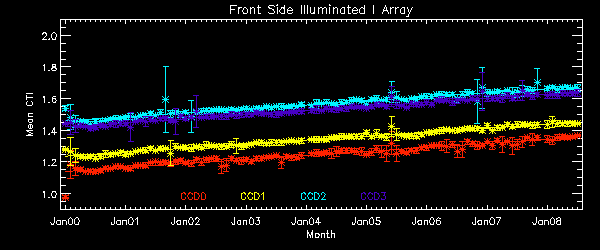
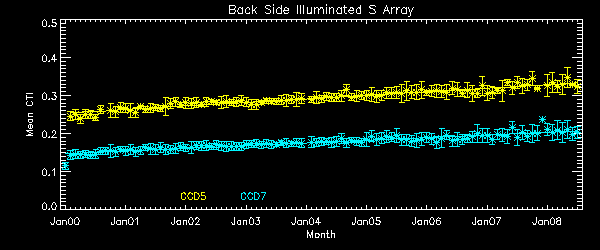
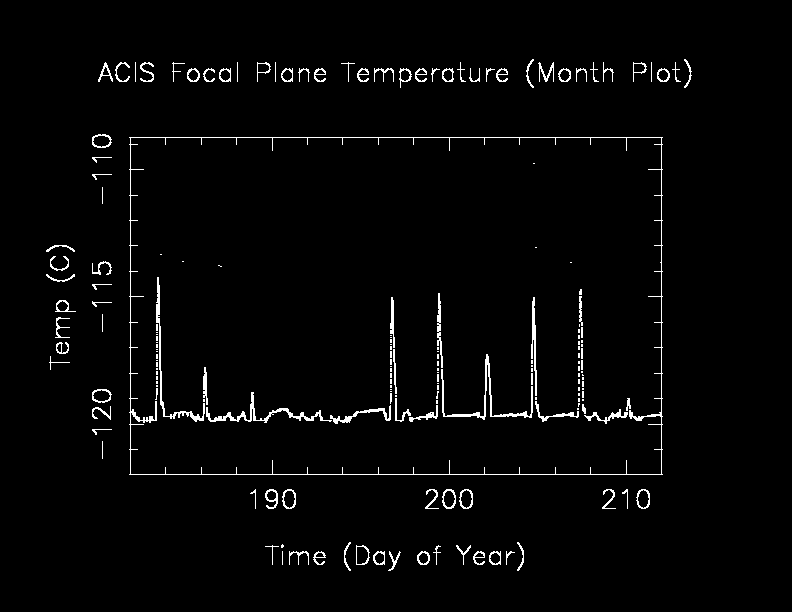
       The Mean (max) FPT: -116.56 C    std dev: 1.87
               mean width:    0.29 days std dev: 0.09

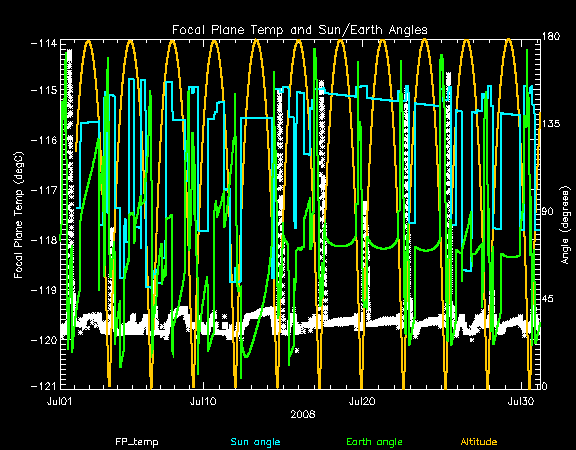
The following is a plot of focal plane temperature and sun angle, earth angle, and altitude.
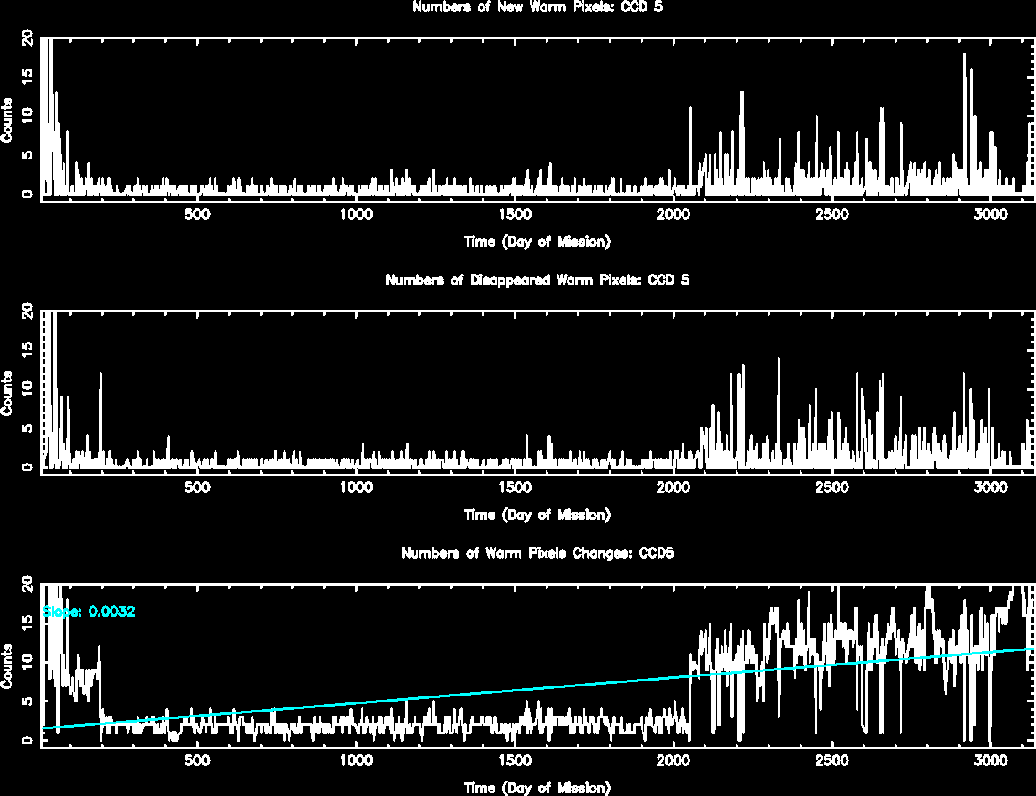
The plots below were generated with a new warm pixel finding script. Please see Acis Bad Pixel Page for details.
Front Side CCDs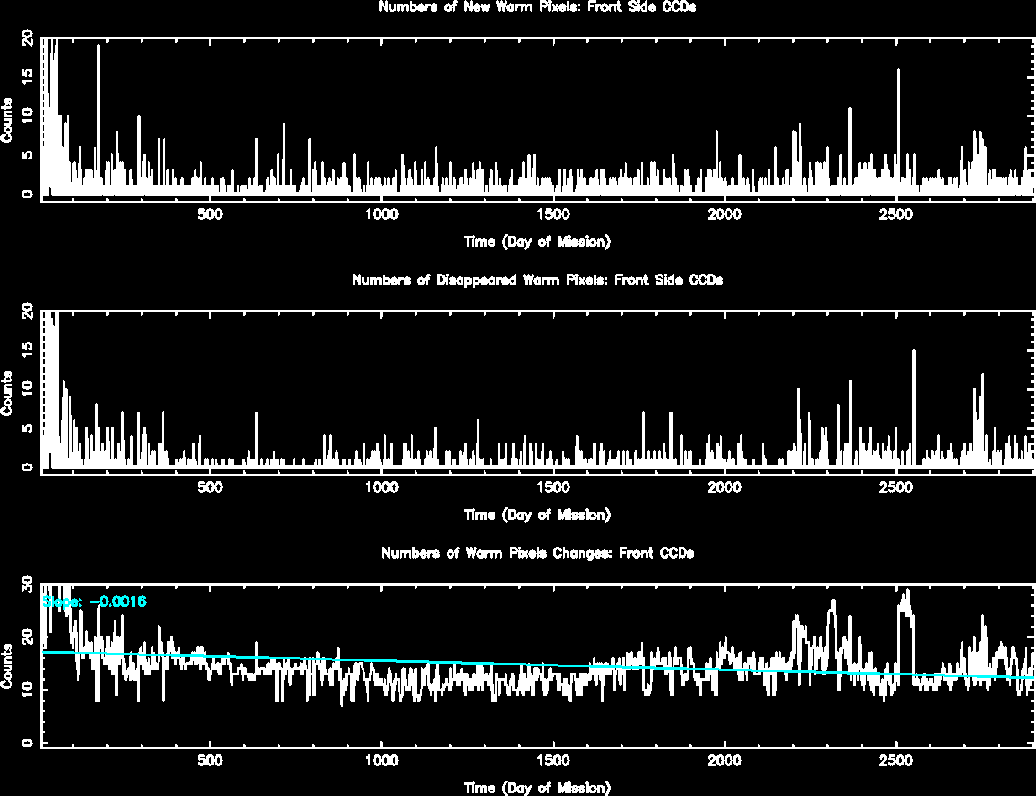
Back Side CCD (CCD5)
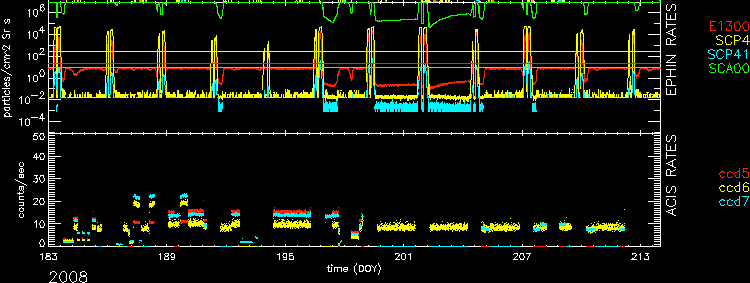
| Name | Low (keV) | High(KeV) | Description |
|---|---|---|---|
| SSoft | 0.00 | 0.50 | Super soft photons |
| Soft | 0.50 | 1.00 | Soft photons |
| Med | 1.00 | 3.00 | Moderate energy photons |
| Hard | 3.00 | 5.00 | Hard Photons |
| Harder | 5.00 | 10.00 | Very Hard photons |
| Hardest | 10.00 | Beyond 10 keV |
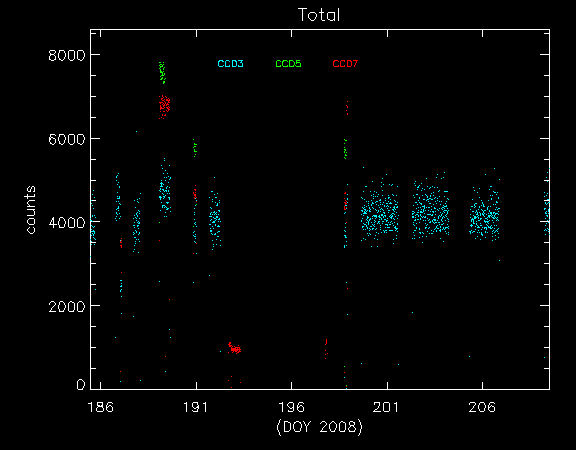
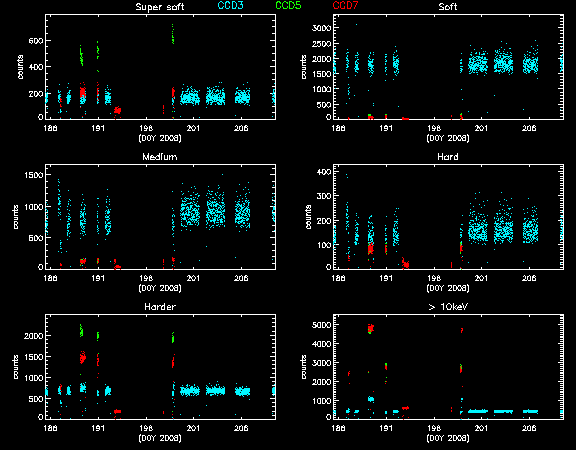
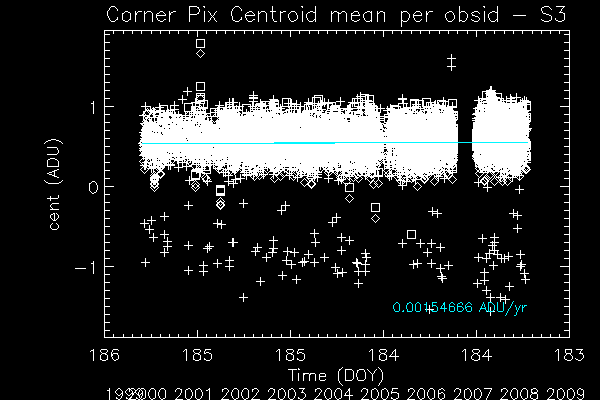
The following three plots show trends of SIB from year 2000. CCDs shown here are CCD3, CCD5, and CCD7. Fitted lines are linear fit after eliminating extreme outliers. For >10 keV plots, 2 lines are fit. One is with a 13 keV filter, and another without.
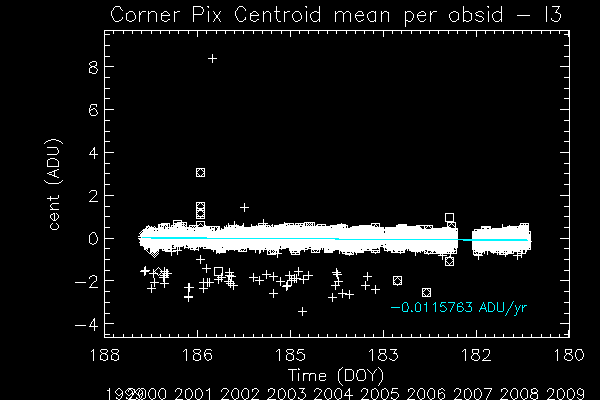
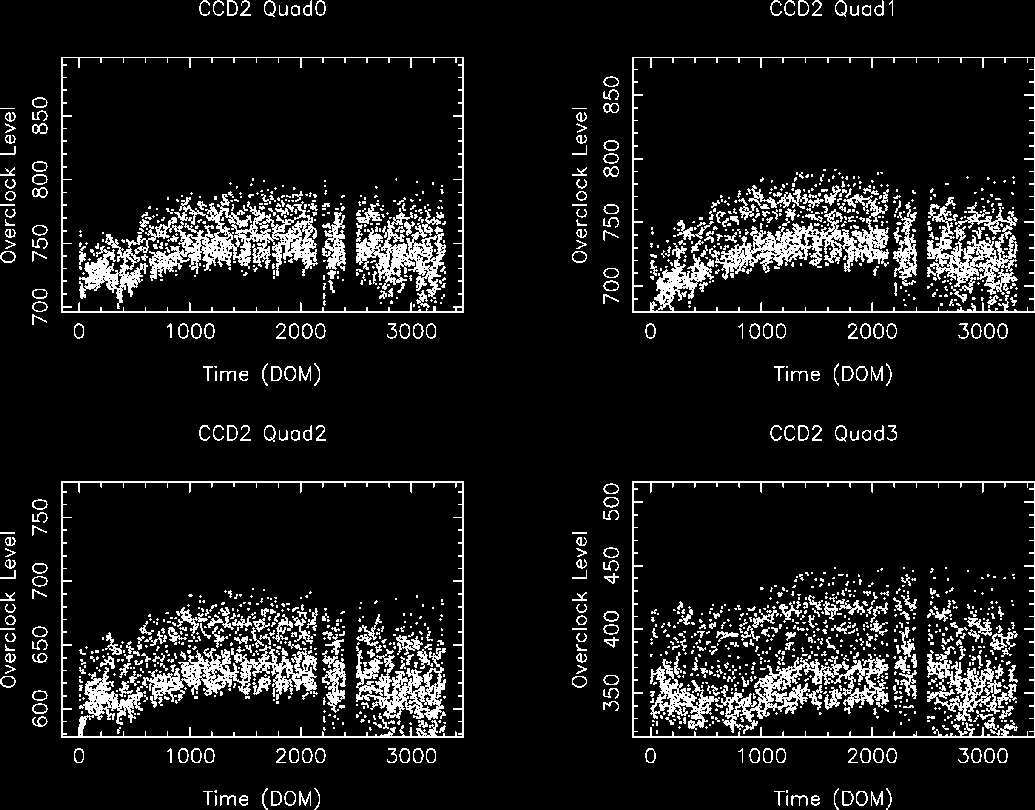
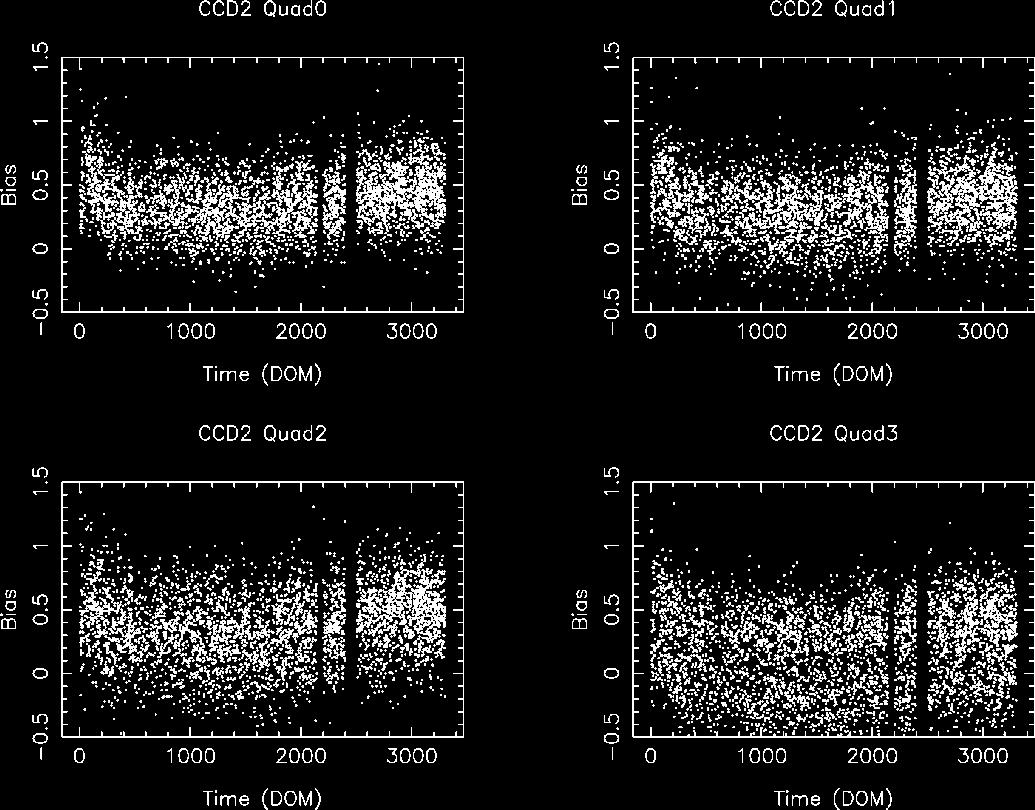
We collected data from acis histogram mode data, and created trend plots of peak portions and peak widths against time (DOM). The peaks were estimated by fitting a simple Gaussian on three peaks (Al, Ti, and Mn), and the widths were estimated by a width at the half max from the peak.
All histogram data are taken under TIMED and GRADED_HIST mode, SIM position is at an external calibration source position, the focal temperature is around -119.7 C, and parameter settings in aciselec, acistemp are set to about same for all.
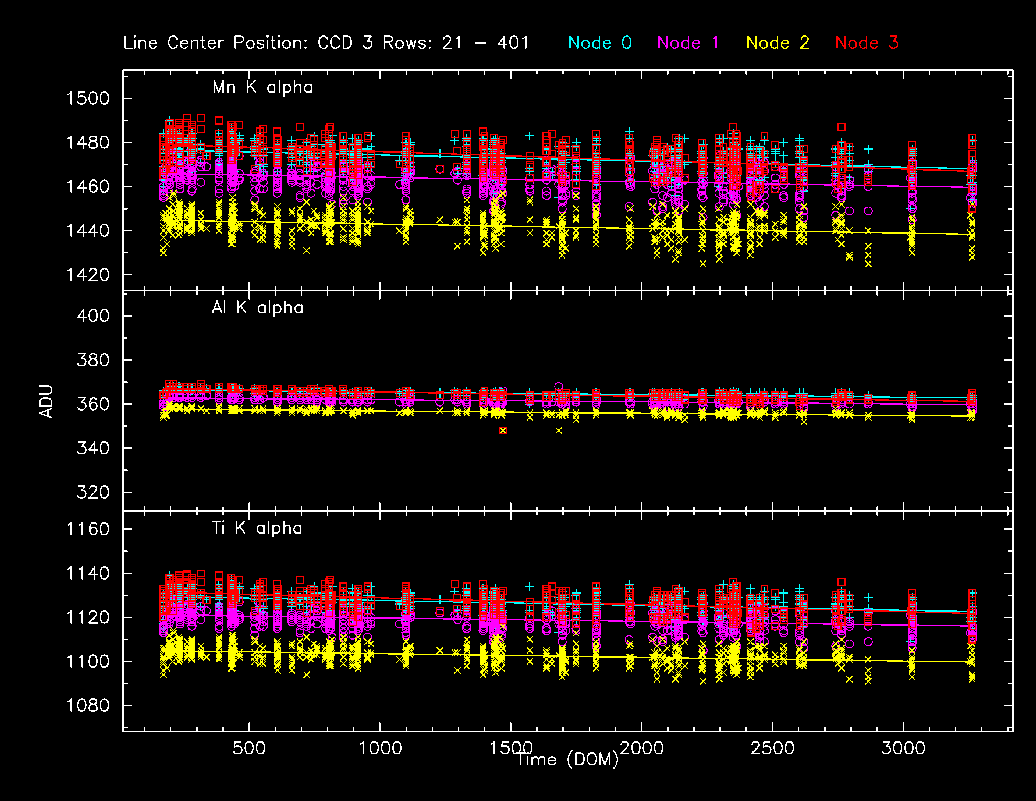
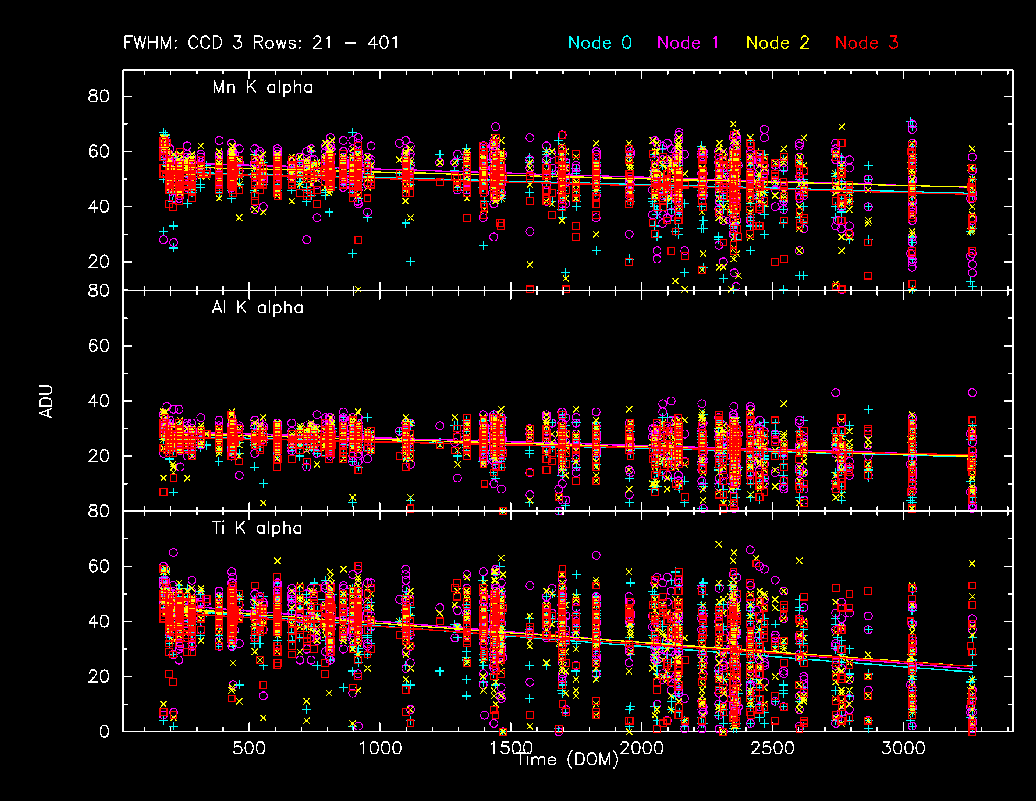
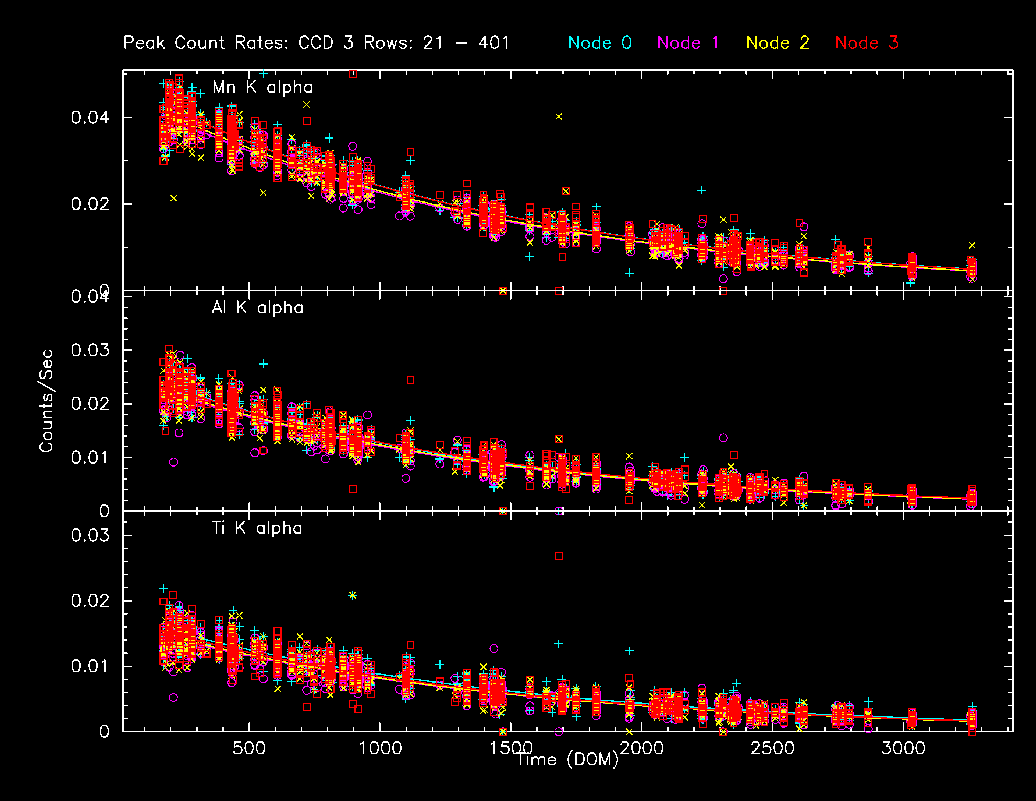
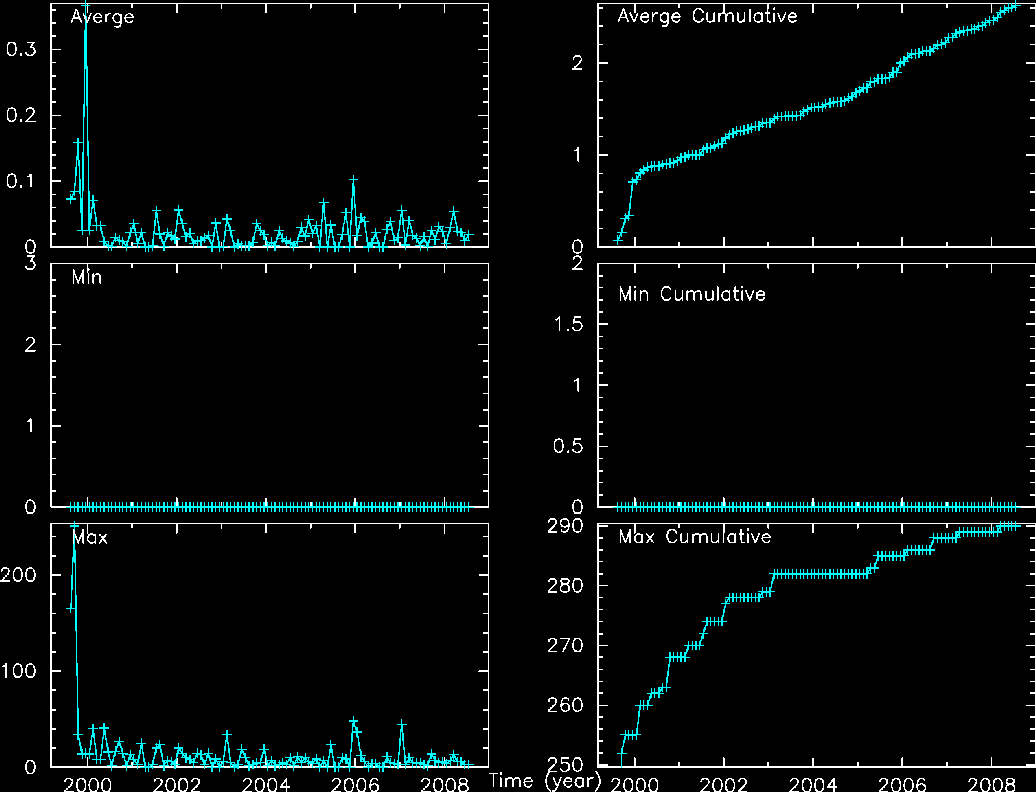
        IMAGE                NPIX      MEAN    STDDEV      MIN       MAX
HRCI_07_2008.fits          16777216   0.019    0.137       0.0        3.0
        IMAGE                NPIX      MEAN    STDDEV      MIN       MAX
HRCI_08_1999_07_2008.fits  16777216   2.624    3.574       0.0       290.0
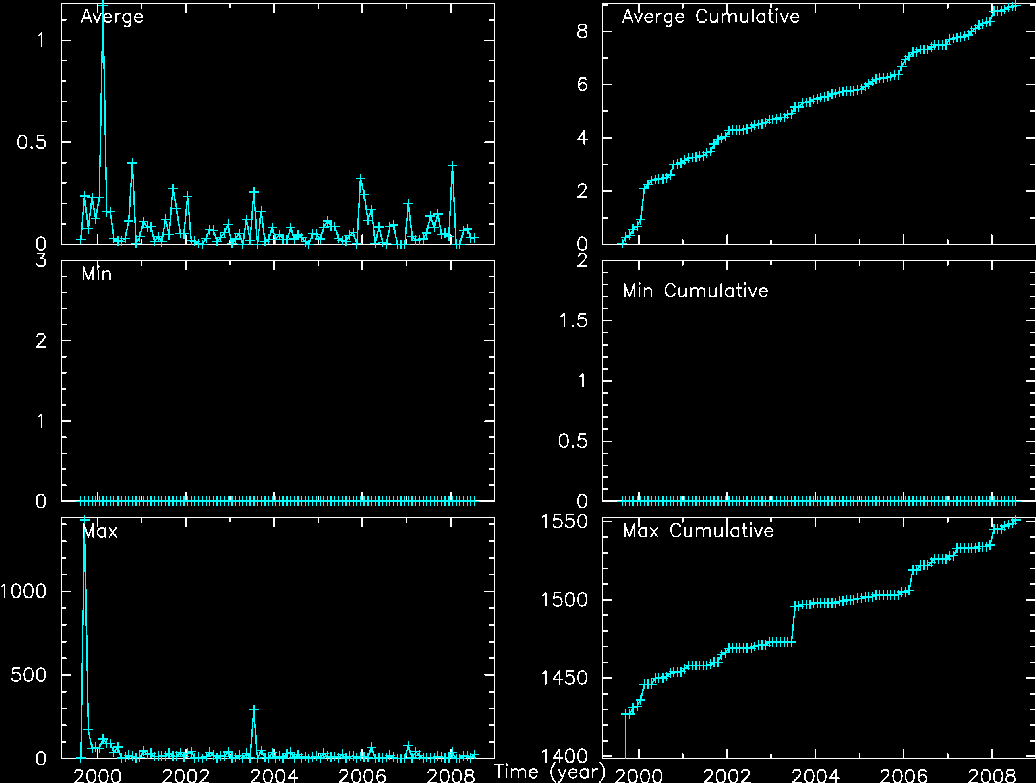
        IMAGE                NPIX      MEAN    STDDEV      MIN       MAX
HRCS_07_2008.fits          16777216   0.031    0.212       0.0       25.0
        IMAGE                NPIX     MEAN      STDDEV      MIN      MAX
HRCS_08_1999_07_2008.fits  16777216  8.973     17.181       0.0      1551.0
We display a max dose trend plot corrected for events that "pile-up" in the center of the taps due to bad position information.
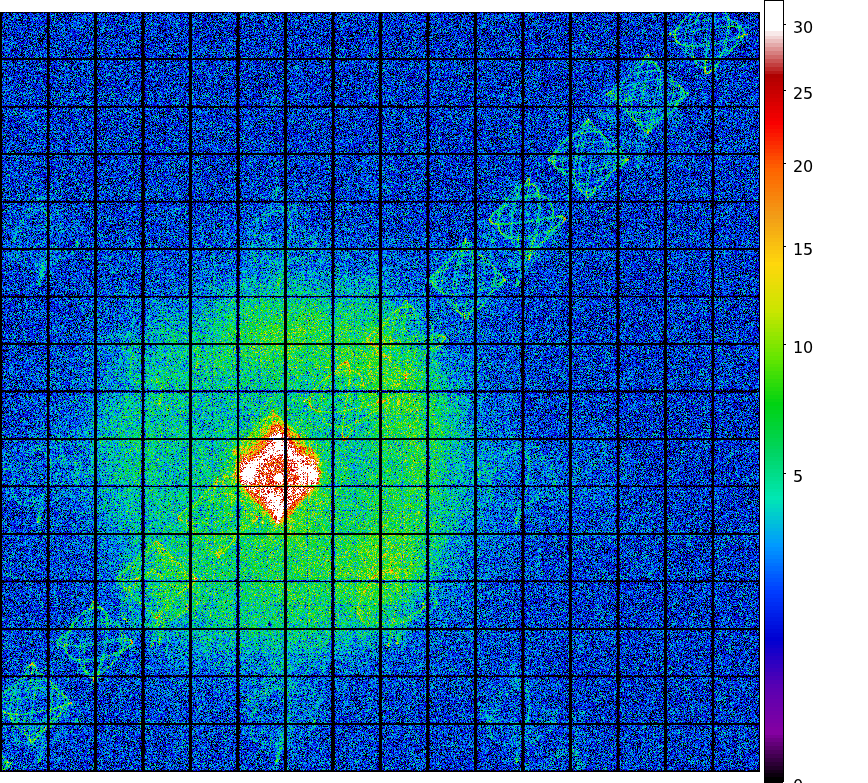
|
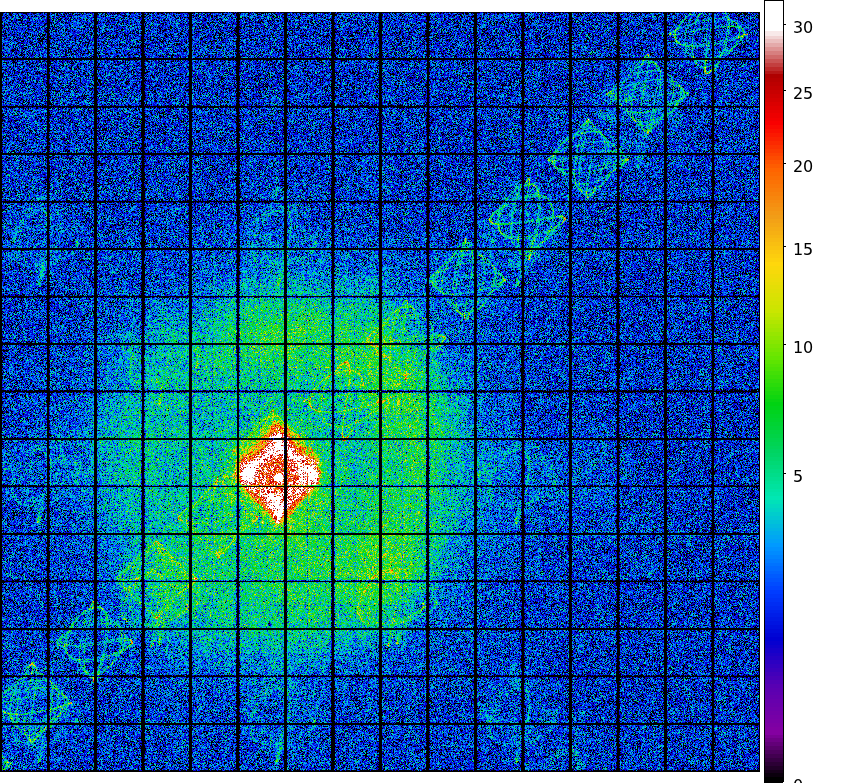
|
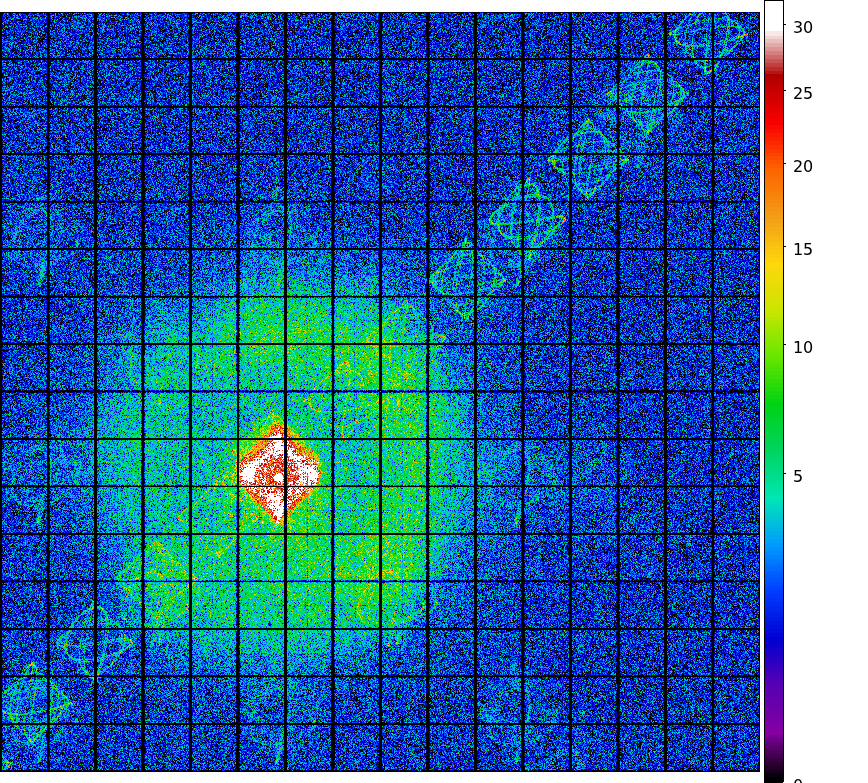
|
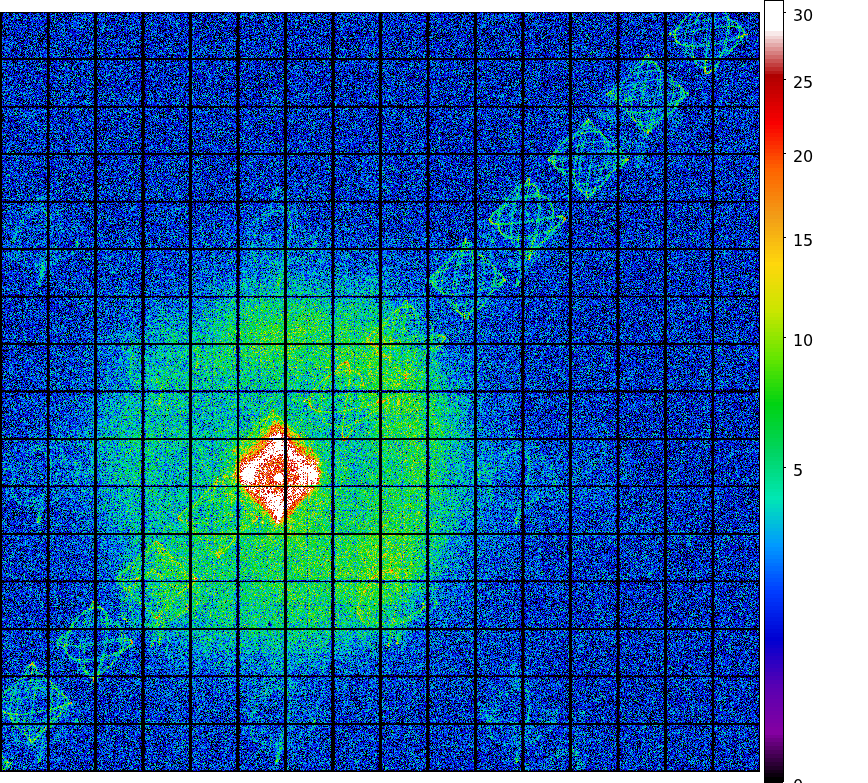
|
| Apr 2008 | Jan 2008 | Oct 2007 | Jul 2007 |
|---|
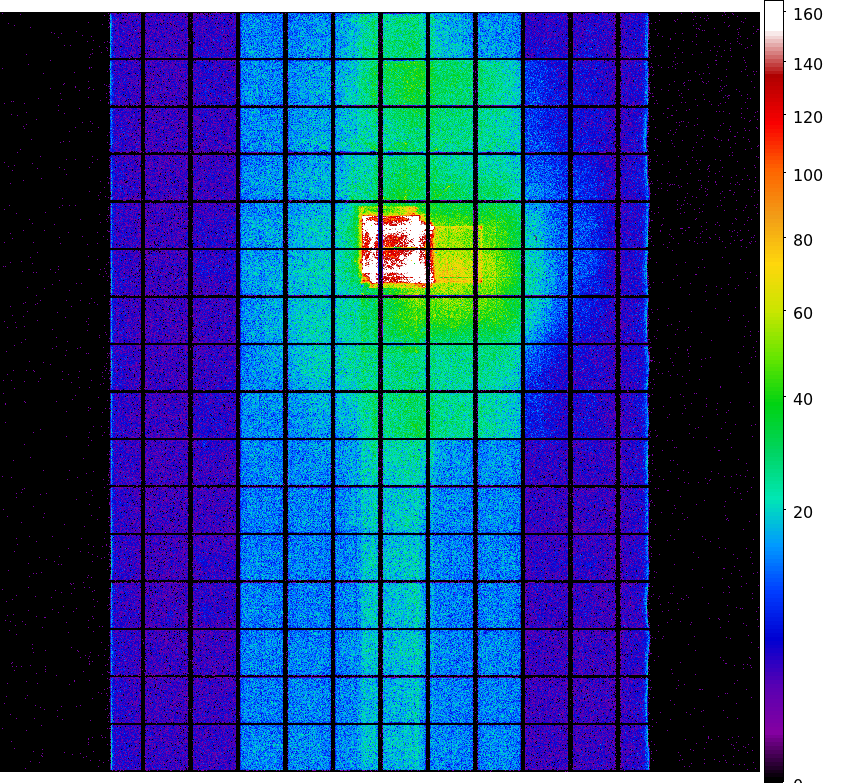
|
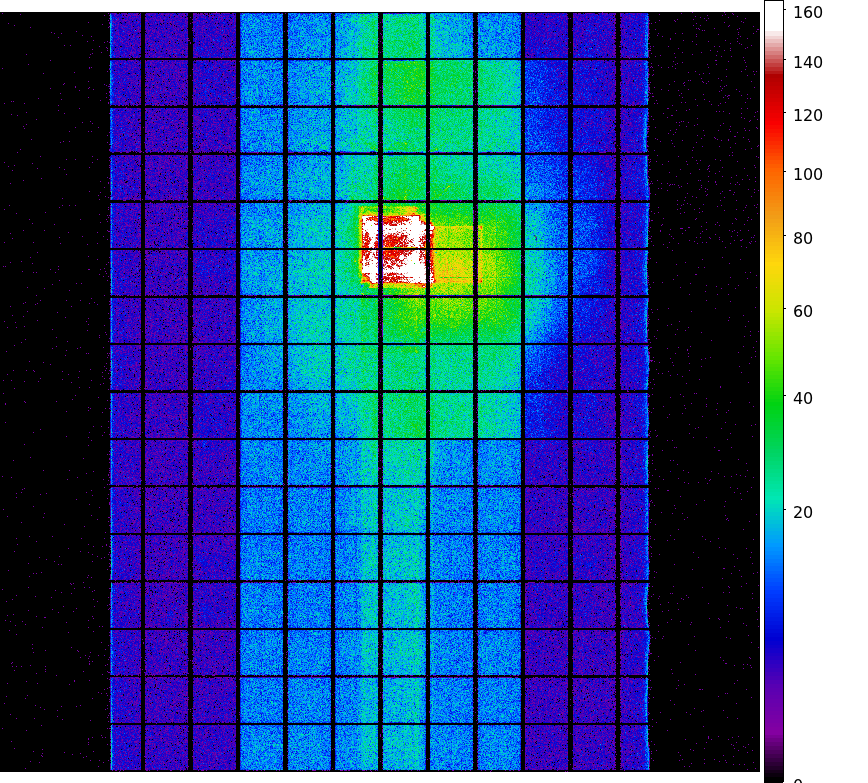
|
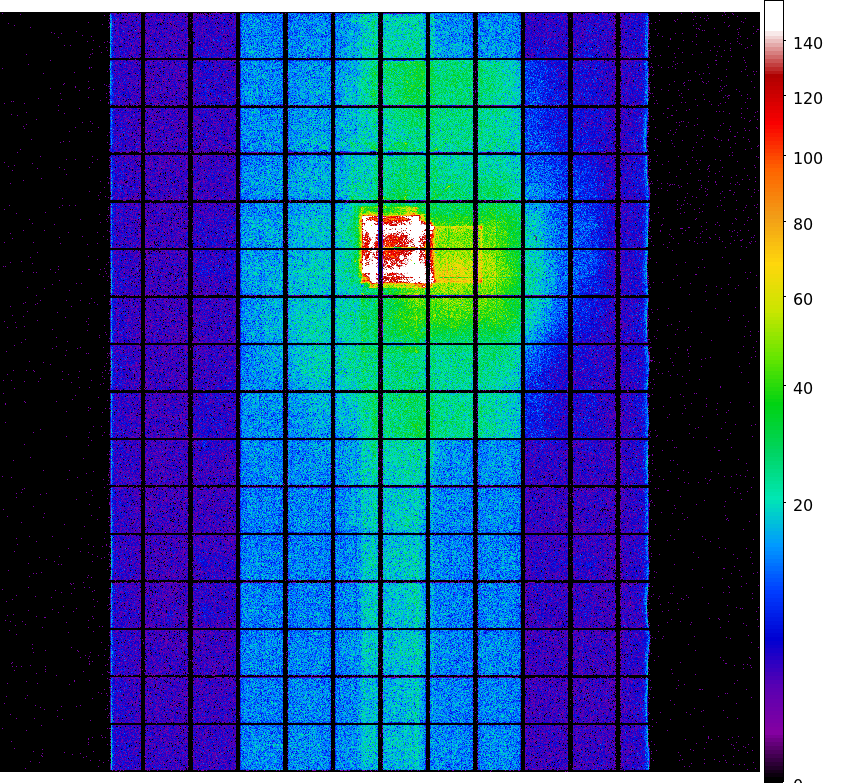
|
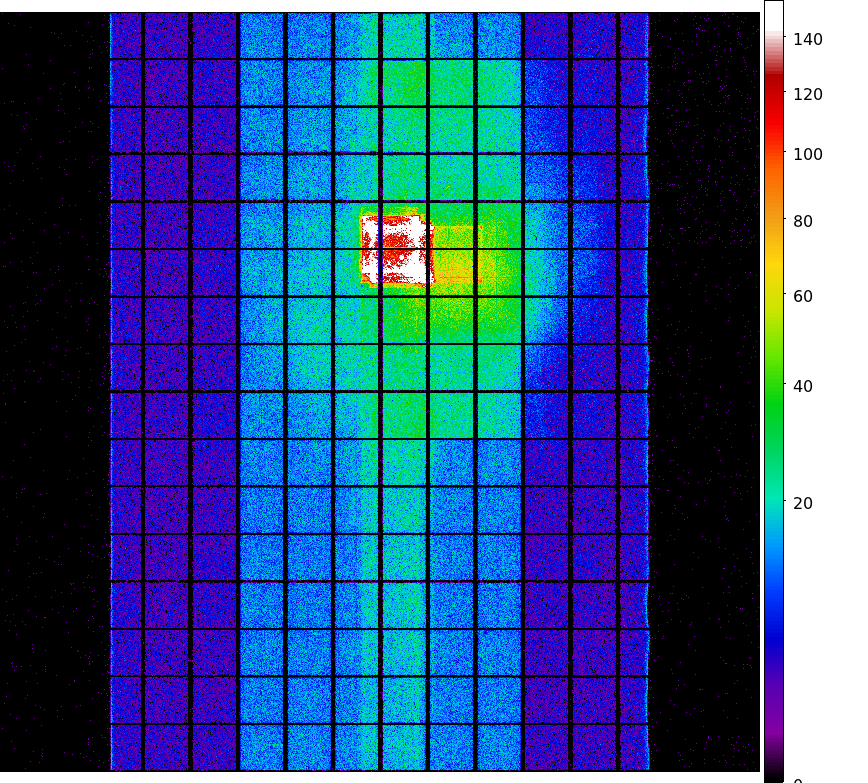
|
| Apr 2008 | Jan 2008 | Oct 2007 | Jul 2007 |
|---|

| Previous Quarter | ||||||
| MSID | MEAN | RMS | DELTA/YR | DELTA/YR/YR | UNITS | DESCRIPTION |
| 1CBAT | 203.70 | 1.26 | 1.549e+00 | 1.235e+02 | K | CAMERA BODY TEMP. A |
| 1CBBT | 204.12 | 1.26 | 1.221e+00 | 1.162e+02 | K | CAMERA BODY TEMP. B |
| 1CRAT | 145.74 | 1.00 | 7.308e-01 | 3.093e+01 | K | COLD RADIATOR TEMP. A |
| 1CRBT | 146.46 | 1.42 | 9.791e-01 | 1.252e+02 | K | |
| Previous Quarter | ||||||
| MSID | MEAN | RMS | DELTA/YR | DELTA/YR/YR | UNITS | DESCRIPTION |
| 5EPHINT | 311.32 | 4.76 | 5.268e+00 | -1.051e+02 | K | EPHIN TEMP |
| HKP27I | 6.89 | 0.56 | 1.457e-01 | 3.336e+00 | AMP | HK 27 Volts Rail - Current |
| HKP27V | 26.81 | 4.499e-02 | -2.607e-02 | -4.516e-01 | V | HK 27 Volts Rail - Voltage |
| TEIO | 306.96 | 18.44 | 1.455e+01 | -1.043e+03 | K | EPHIN ELECTRONICS HOUSING TEMP |
| TEPHIN | 311.05 | 5.17 | 5.801e+00 | -1.723e+02 | K | EPHIN SENSOR HOUSING TEMP |
| 
|

| Year | Month | |||||||||||
|---|---|---|---|---|---|---|---|---|---|---|---|---|
| 1999 | Jul | Aug | Sep | Oct | Nov | Dec | ||||||
| 2000 | Jan | Feb | Mar | Apr | May | Jun | Jul | Aug | Sep | Oct | Nov | Dec |
| 2001 | Jan | Feb | Mar | Apr | May | Jun | Jul | Aug | Sep | Oct | Nov | Dec |
| 2002 | Jan | Feb | Mar | Apr | May | Jun | Jul | Aug | Sep | Oct | Nov | Dec |
| 2003 | Jan | Feb | Mar | Apr | May | Jun | Jul | Aug | Sep | Oct | Nov | Dec |
| 2004 | Jan | Feb | Mar | Apr | May | Jun | Jul | Aug | Sep | Oct | Nov | Dec |
| 2005 | Jan | Feb | Mar | Apr | May | Jun | Jul | Aug | Sep | Oct | Nov | Dec |
| 2006 | Jan | Feb | Mar | Apr | May | Jun | Jul | Aug | Sep | Oct | Nov | Dec |
| 2007 | Jan | Feb | Mar | Apr | May | Jun | Jul | Aug | Sep | Oct | Nov | Dec |
| 2008 | Jan | Feb | Mar | Apr | May | Jun | ||||||